Copyright
©The Author(s) 2025.
World J Gastrointest Oncol. May 15, 2025; 17(5): 103667
Published online May 15, 2025. doi: 10.4251/wjgo.v17.i5.103667
Published online May 15, 2025. doi: 10.4251/wjgo.v17.i5.103667
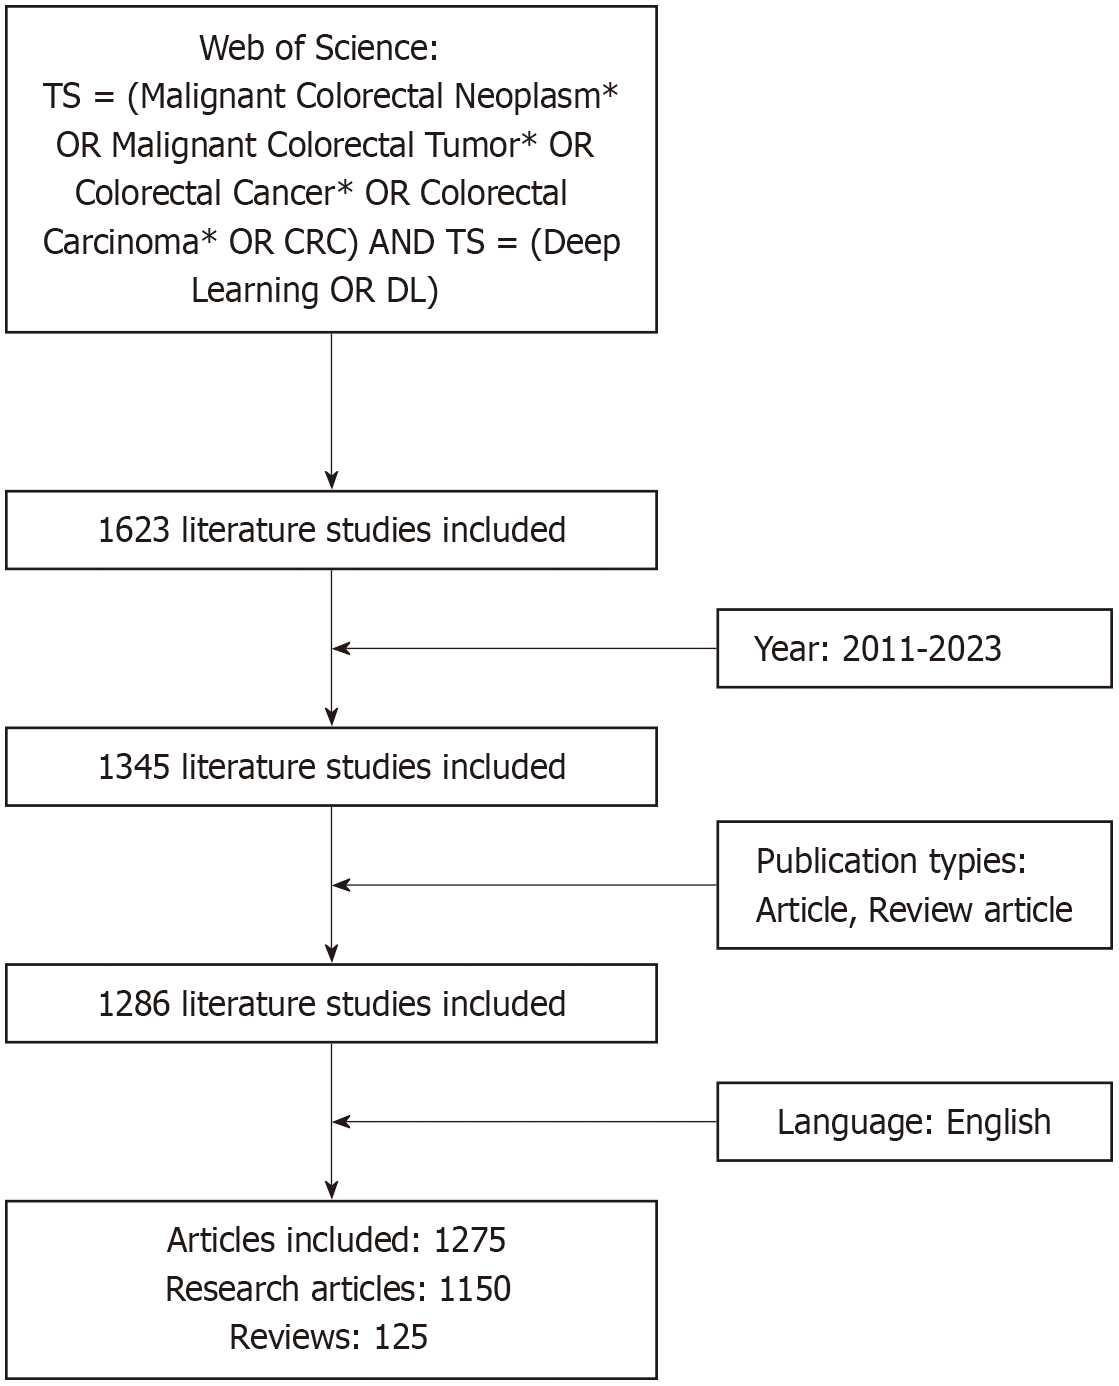
Figure 1 Literature screening flowchart.
CRC: Colorectal cancer; DL: Deep learning.
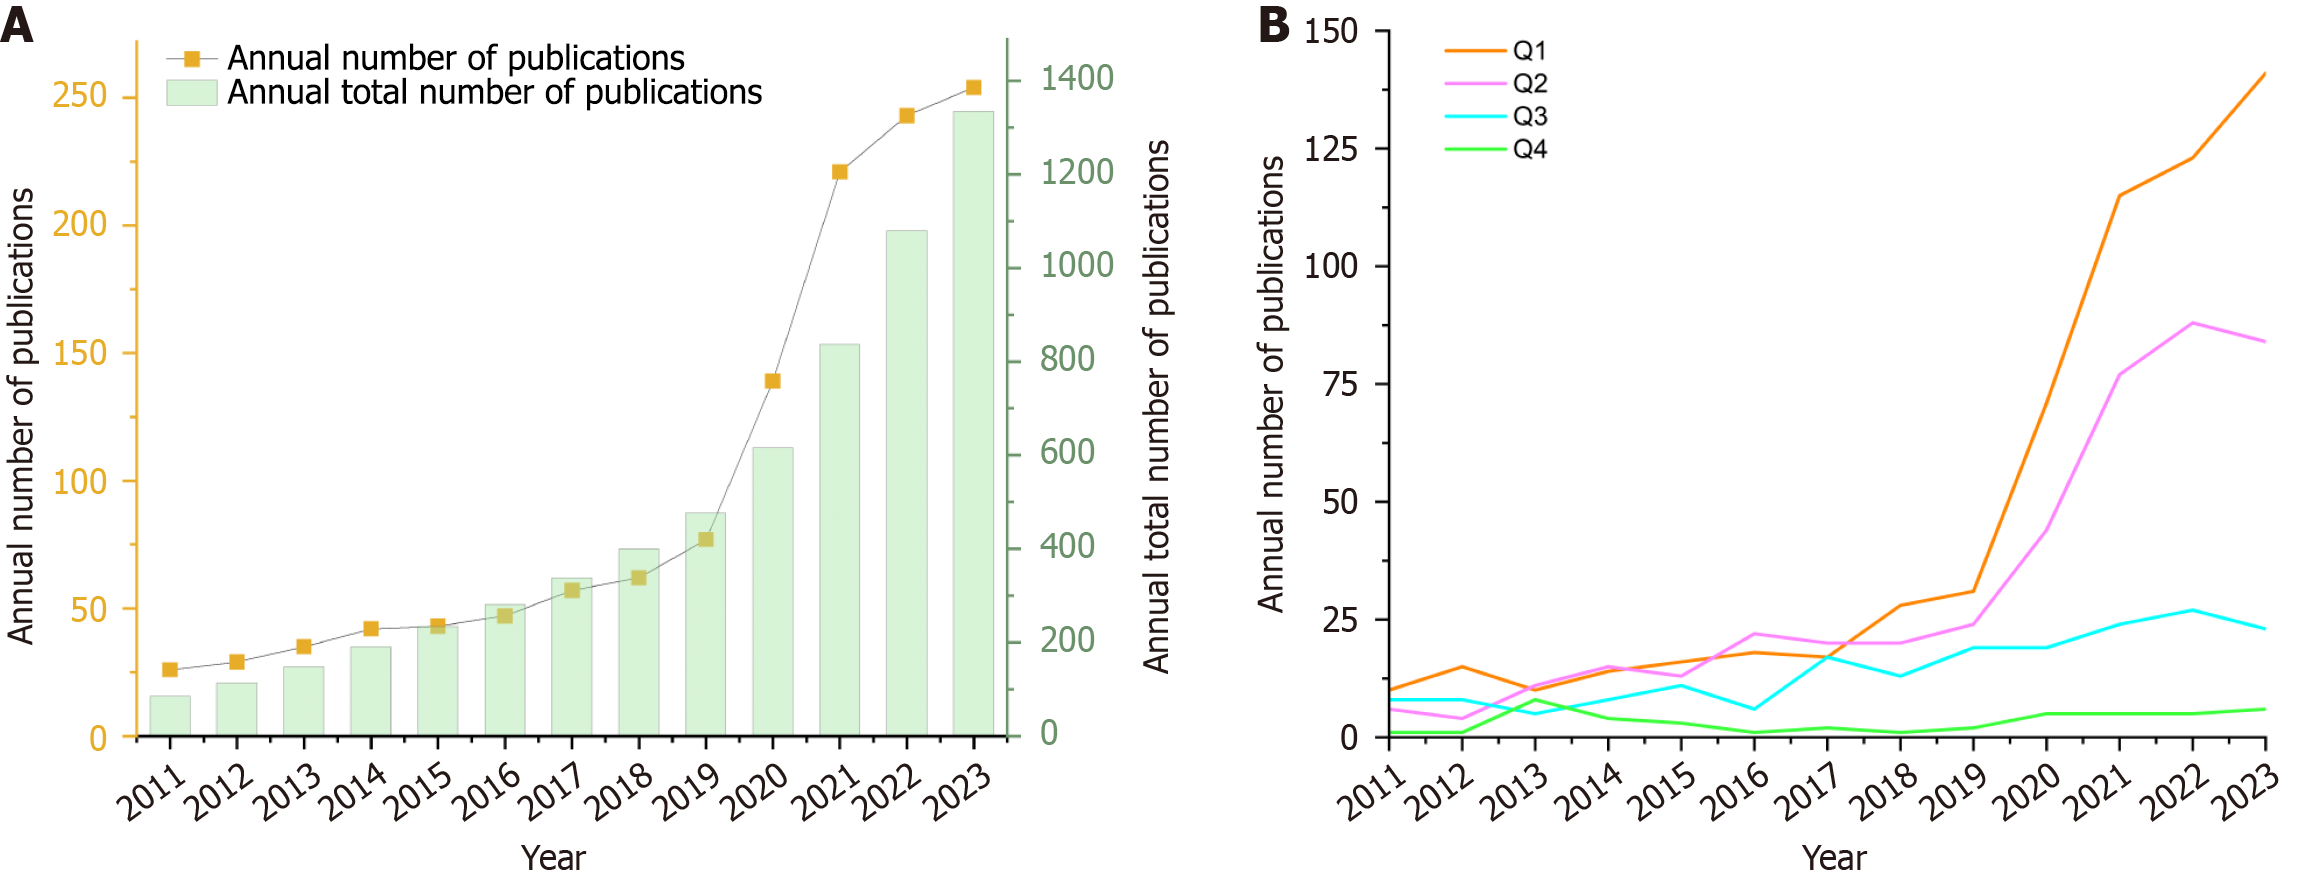
Figure 2 Number of publications.
A: Annual and total number of publications; B: Number of publications classified by Journal Citation Reports quartiles.
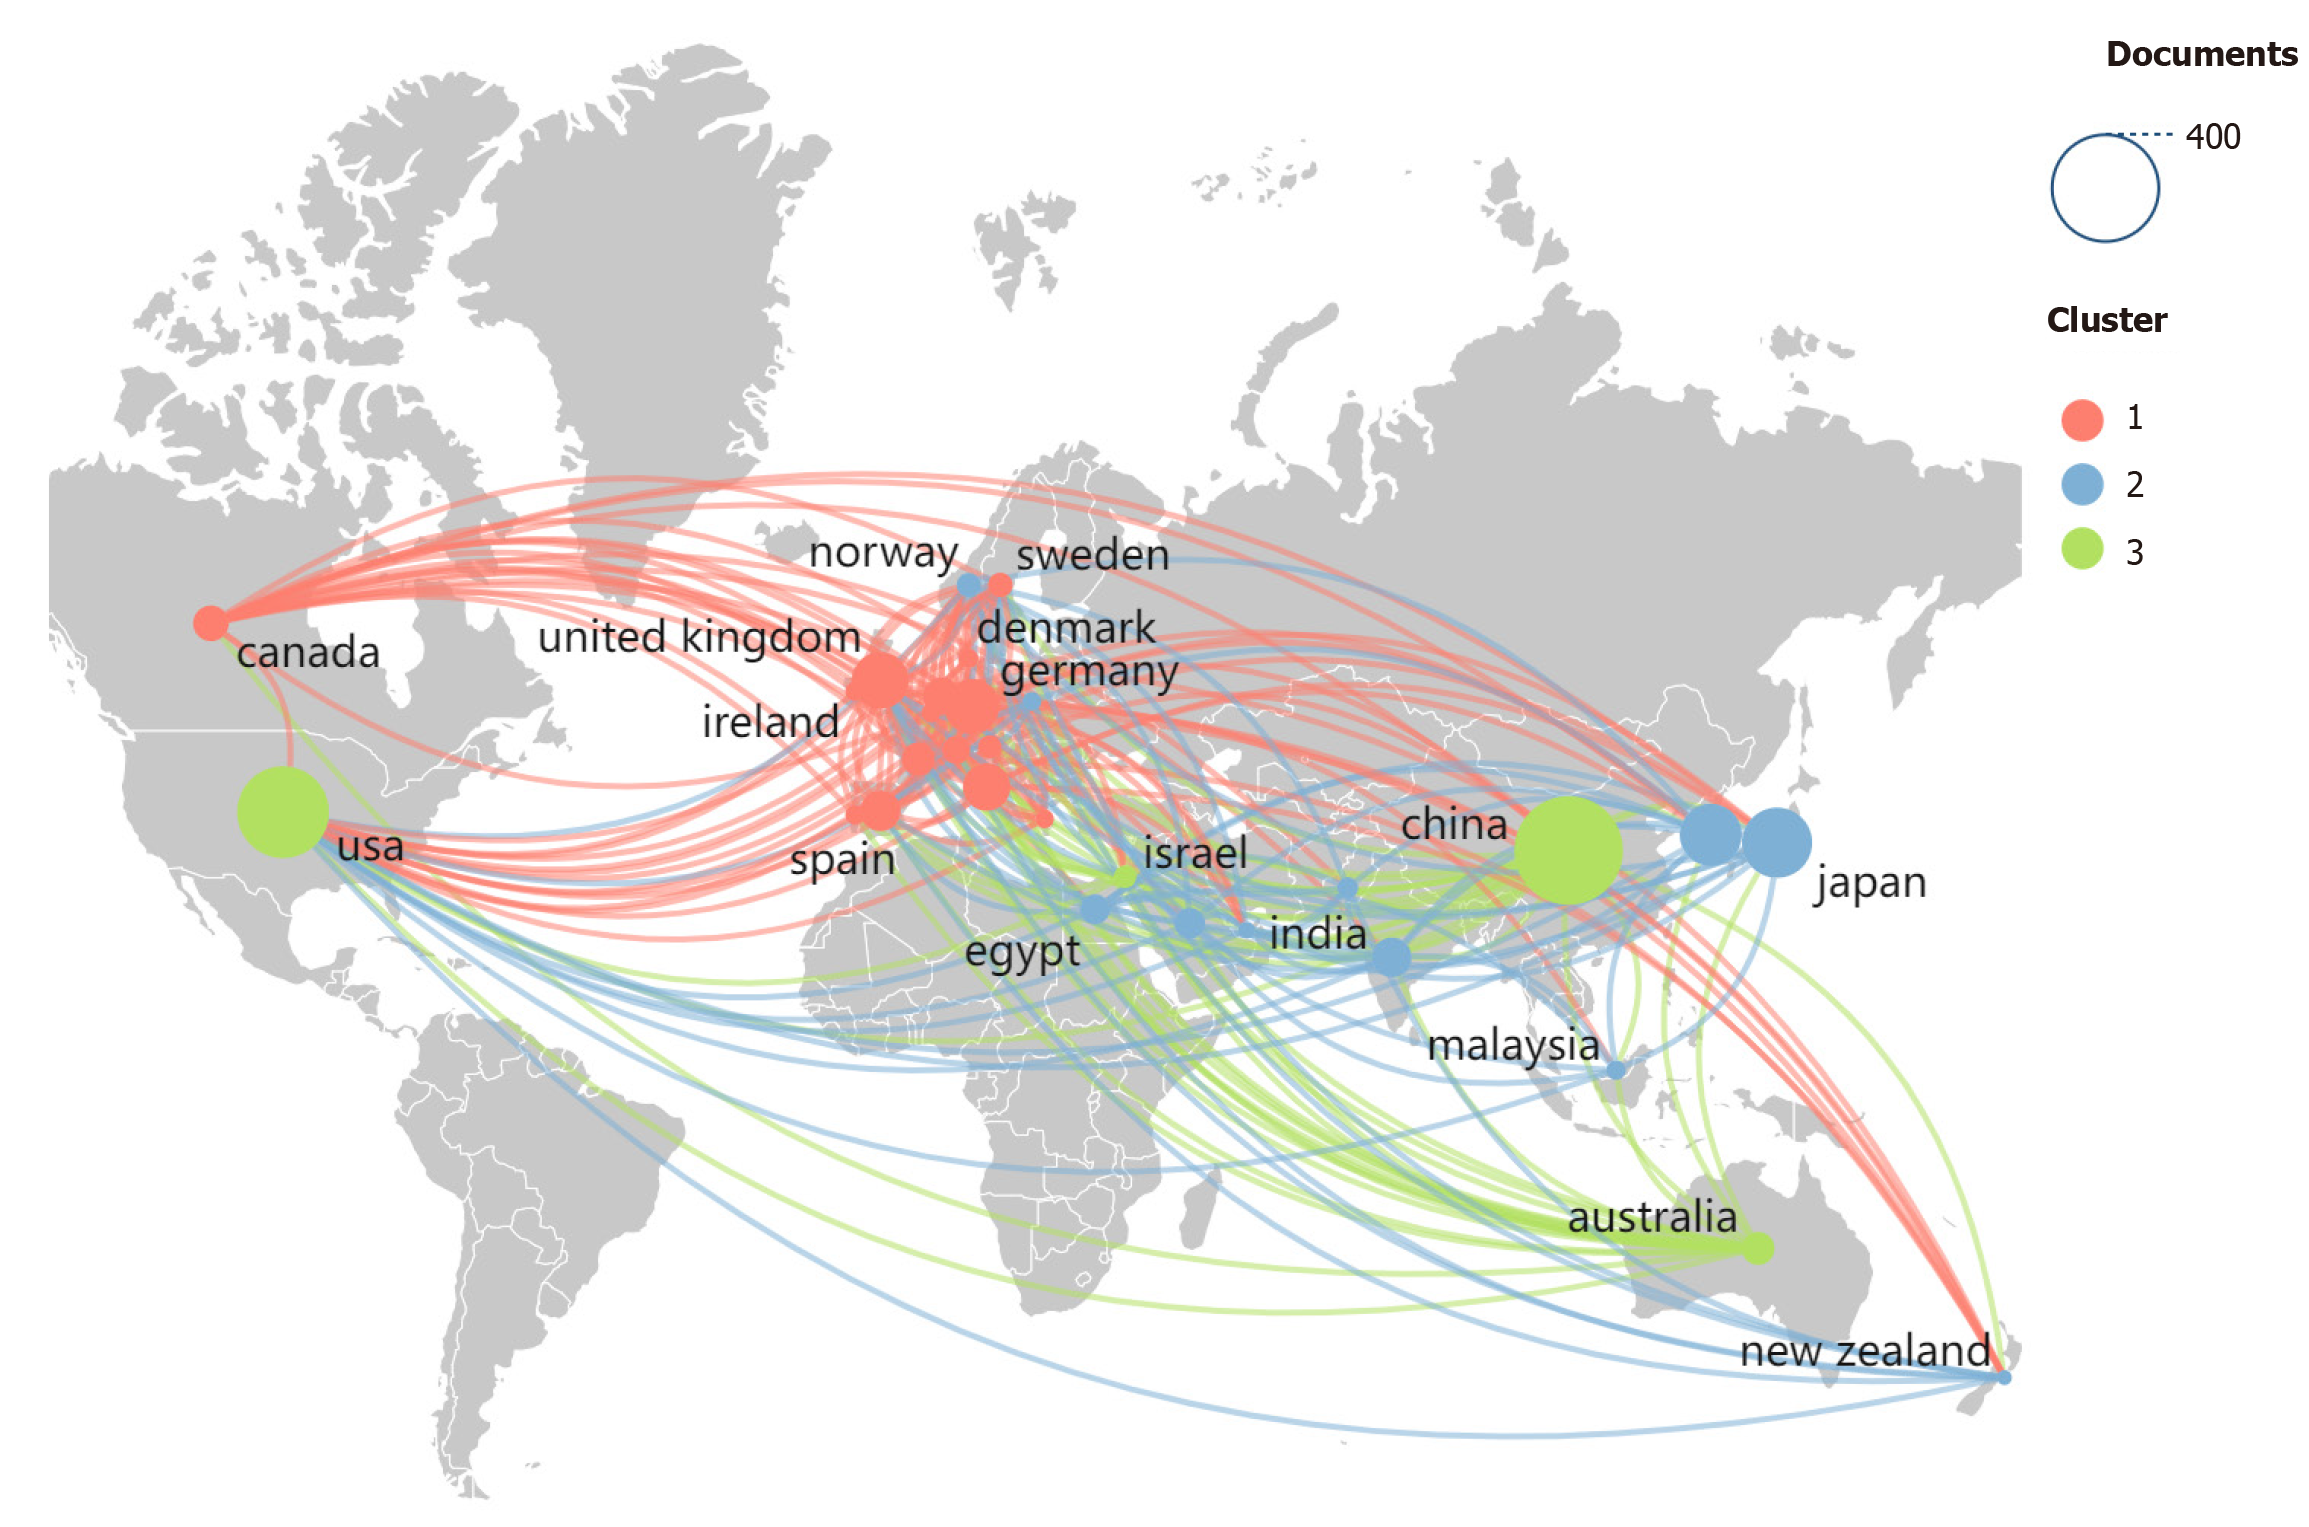
Figure 3
Country cooperation map.
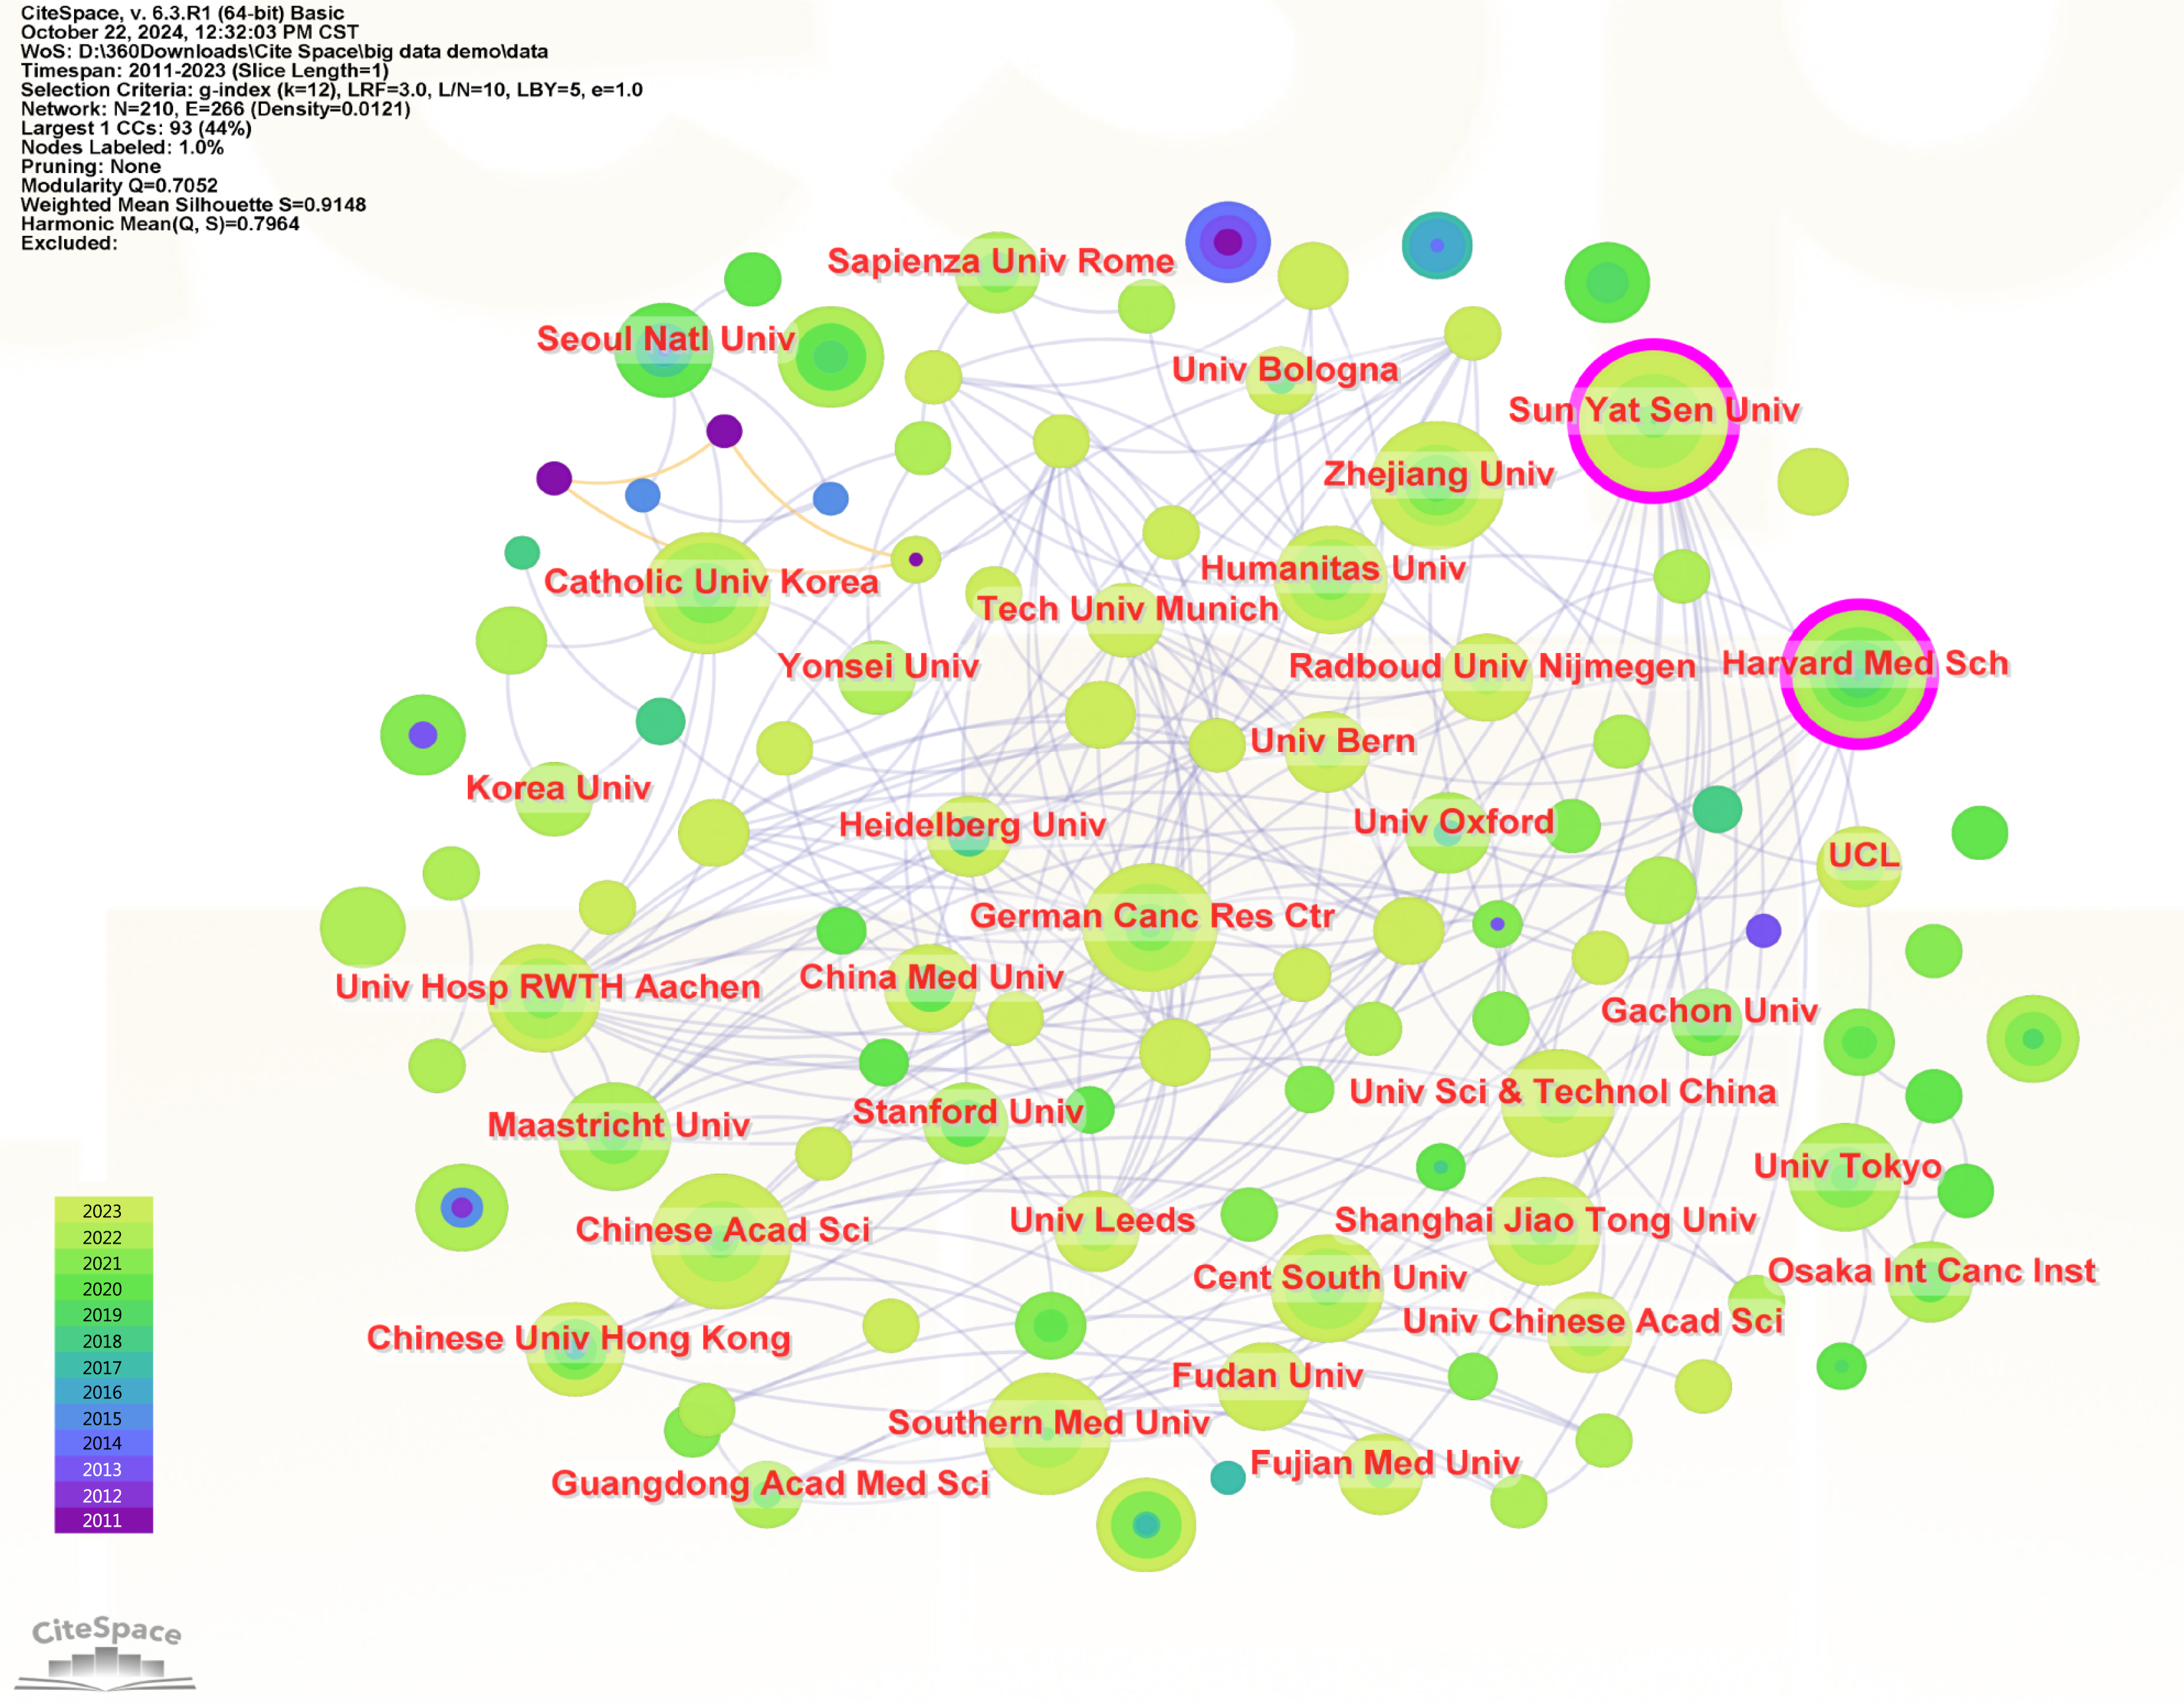
Figure 4
Visualization mapping of institutional cooperation.
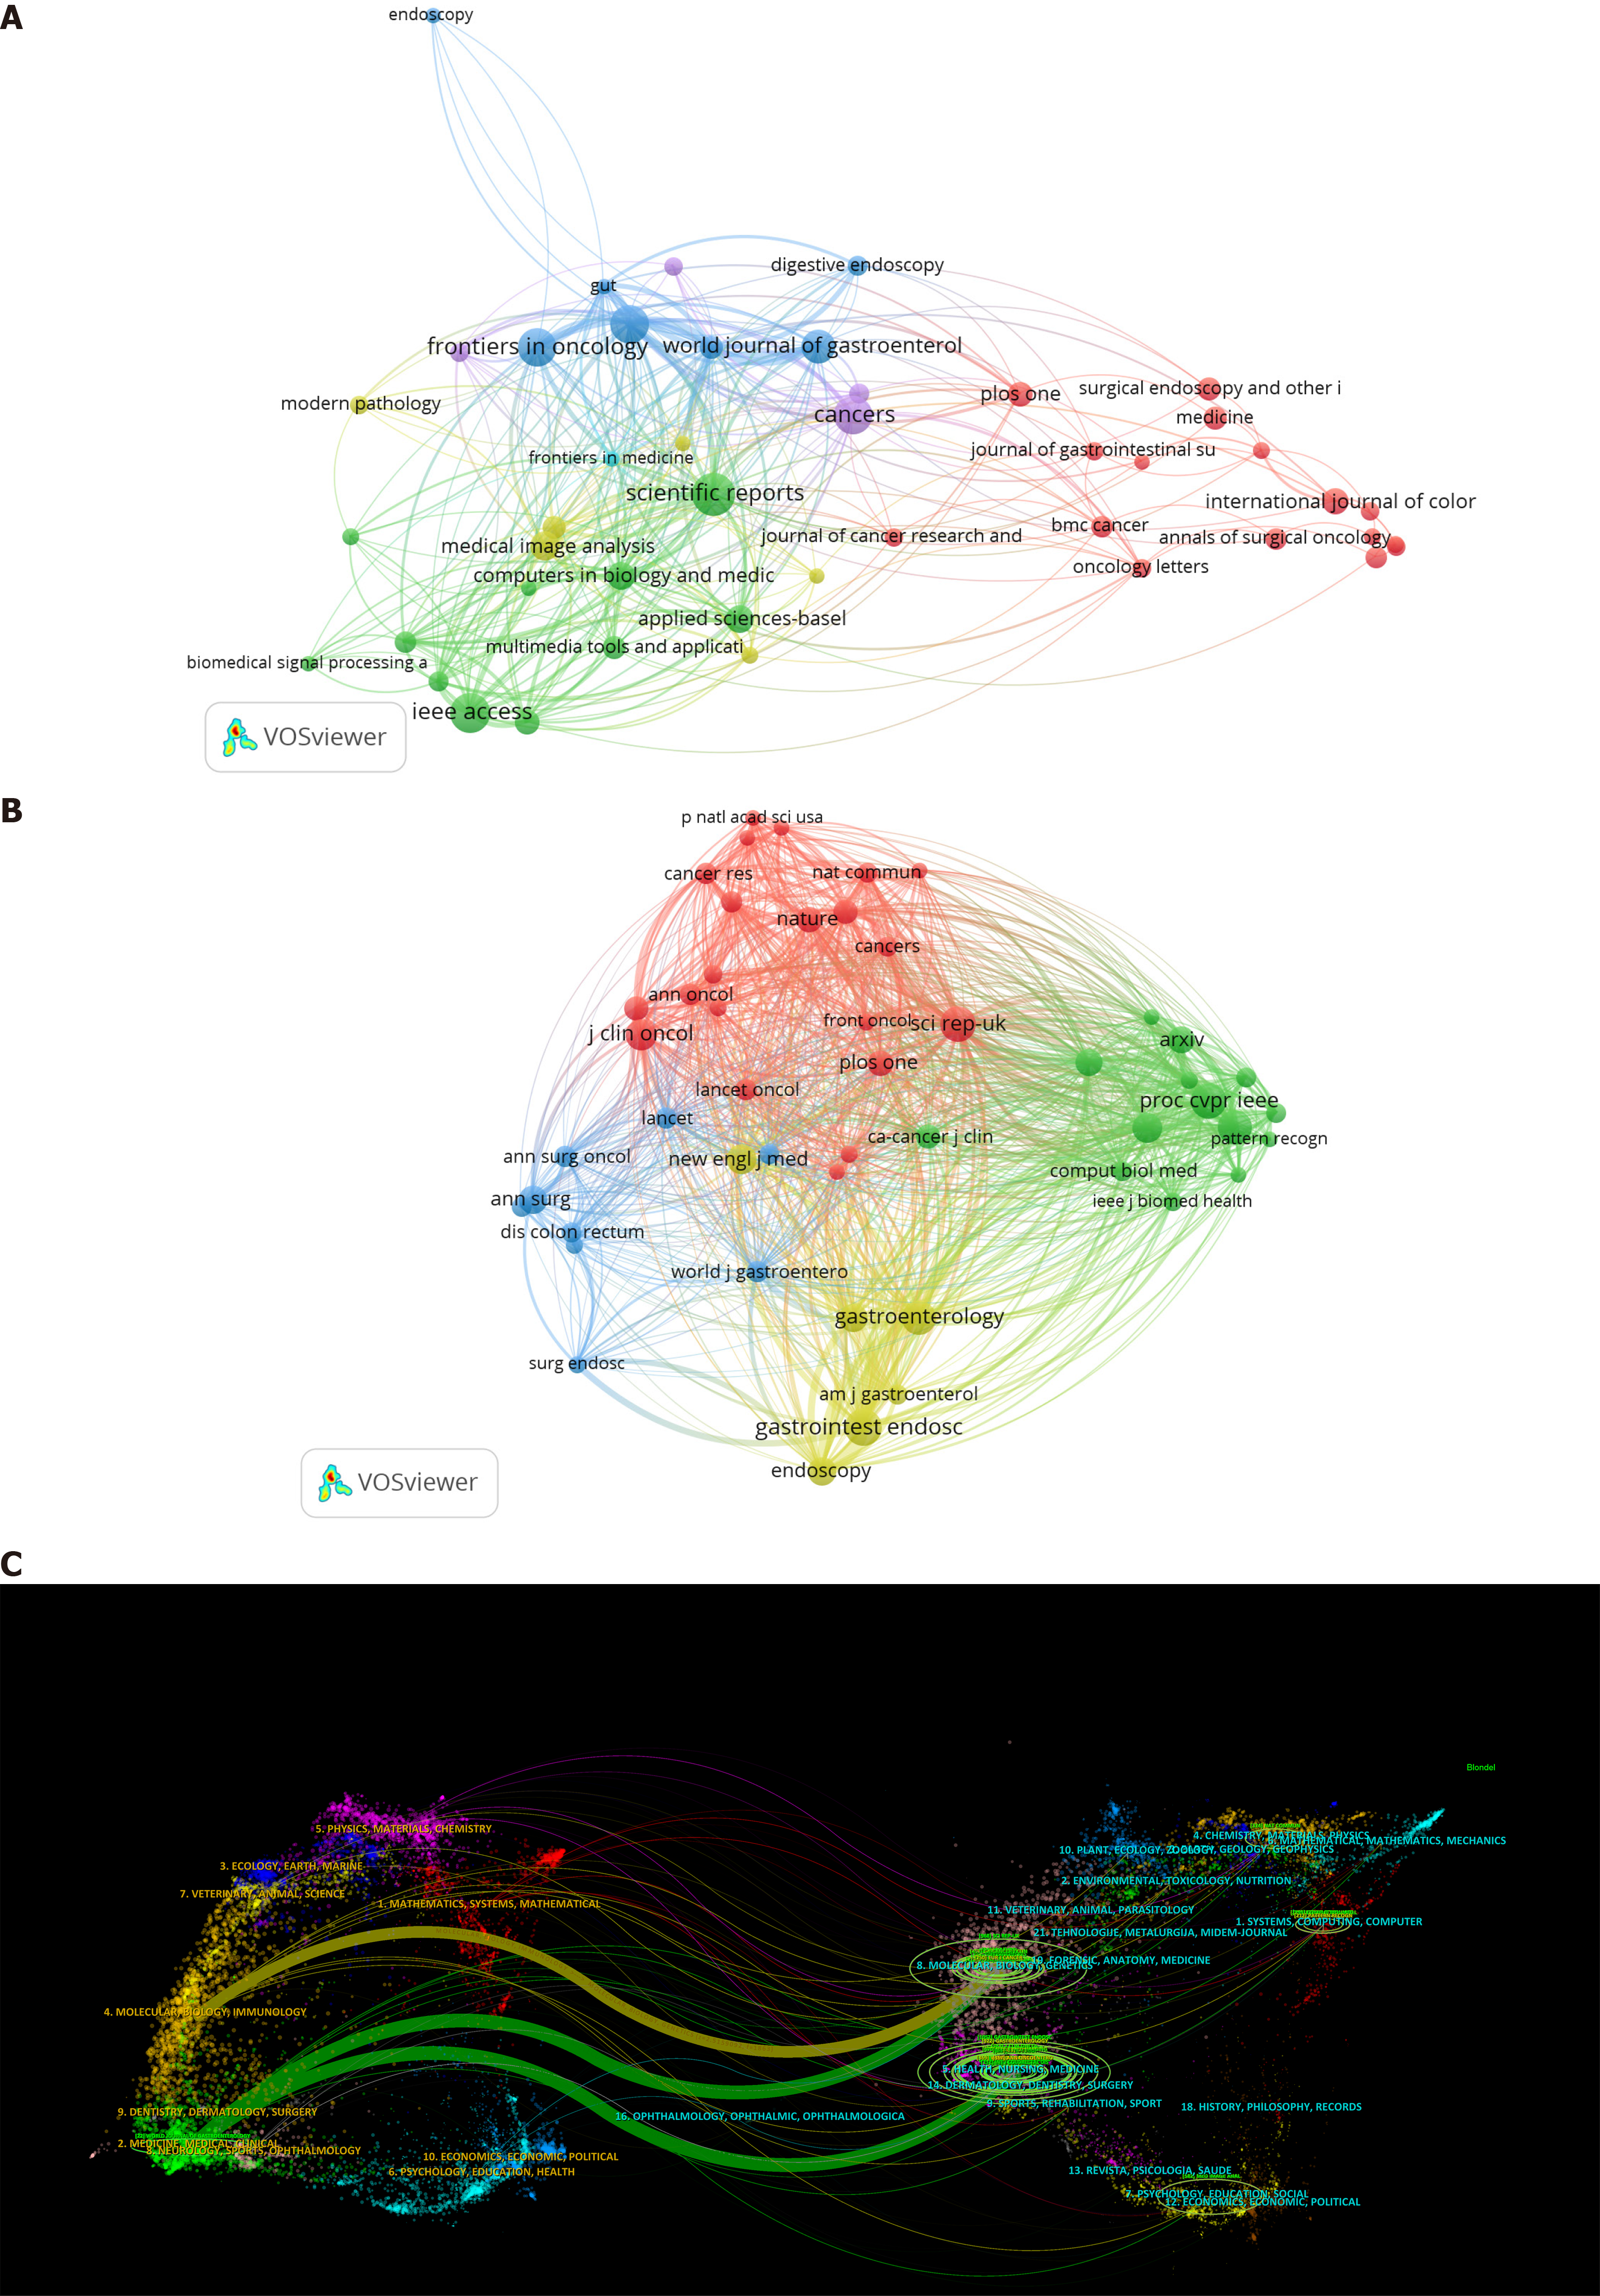
Figure 5 Journal and co-cited journal analysis.
A: Journal cluster analysis; B: Co-cited journal cluster analysis; C: Double map overlay.
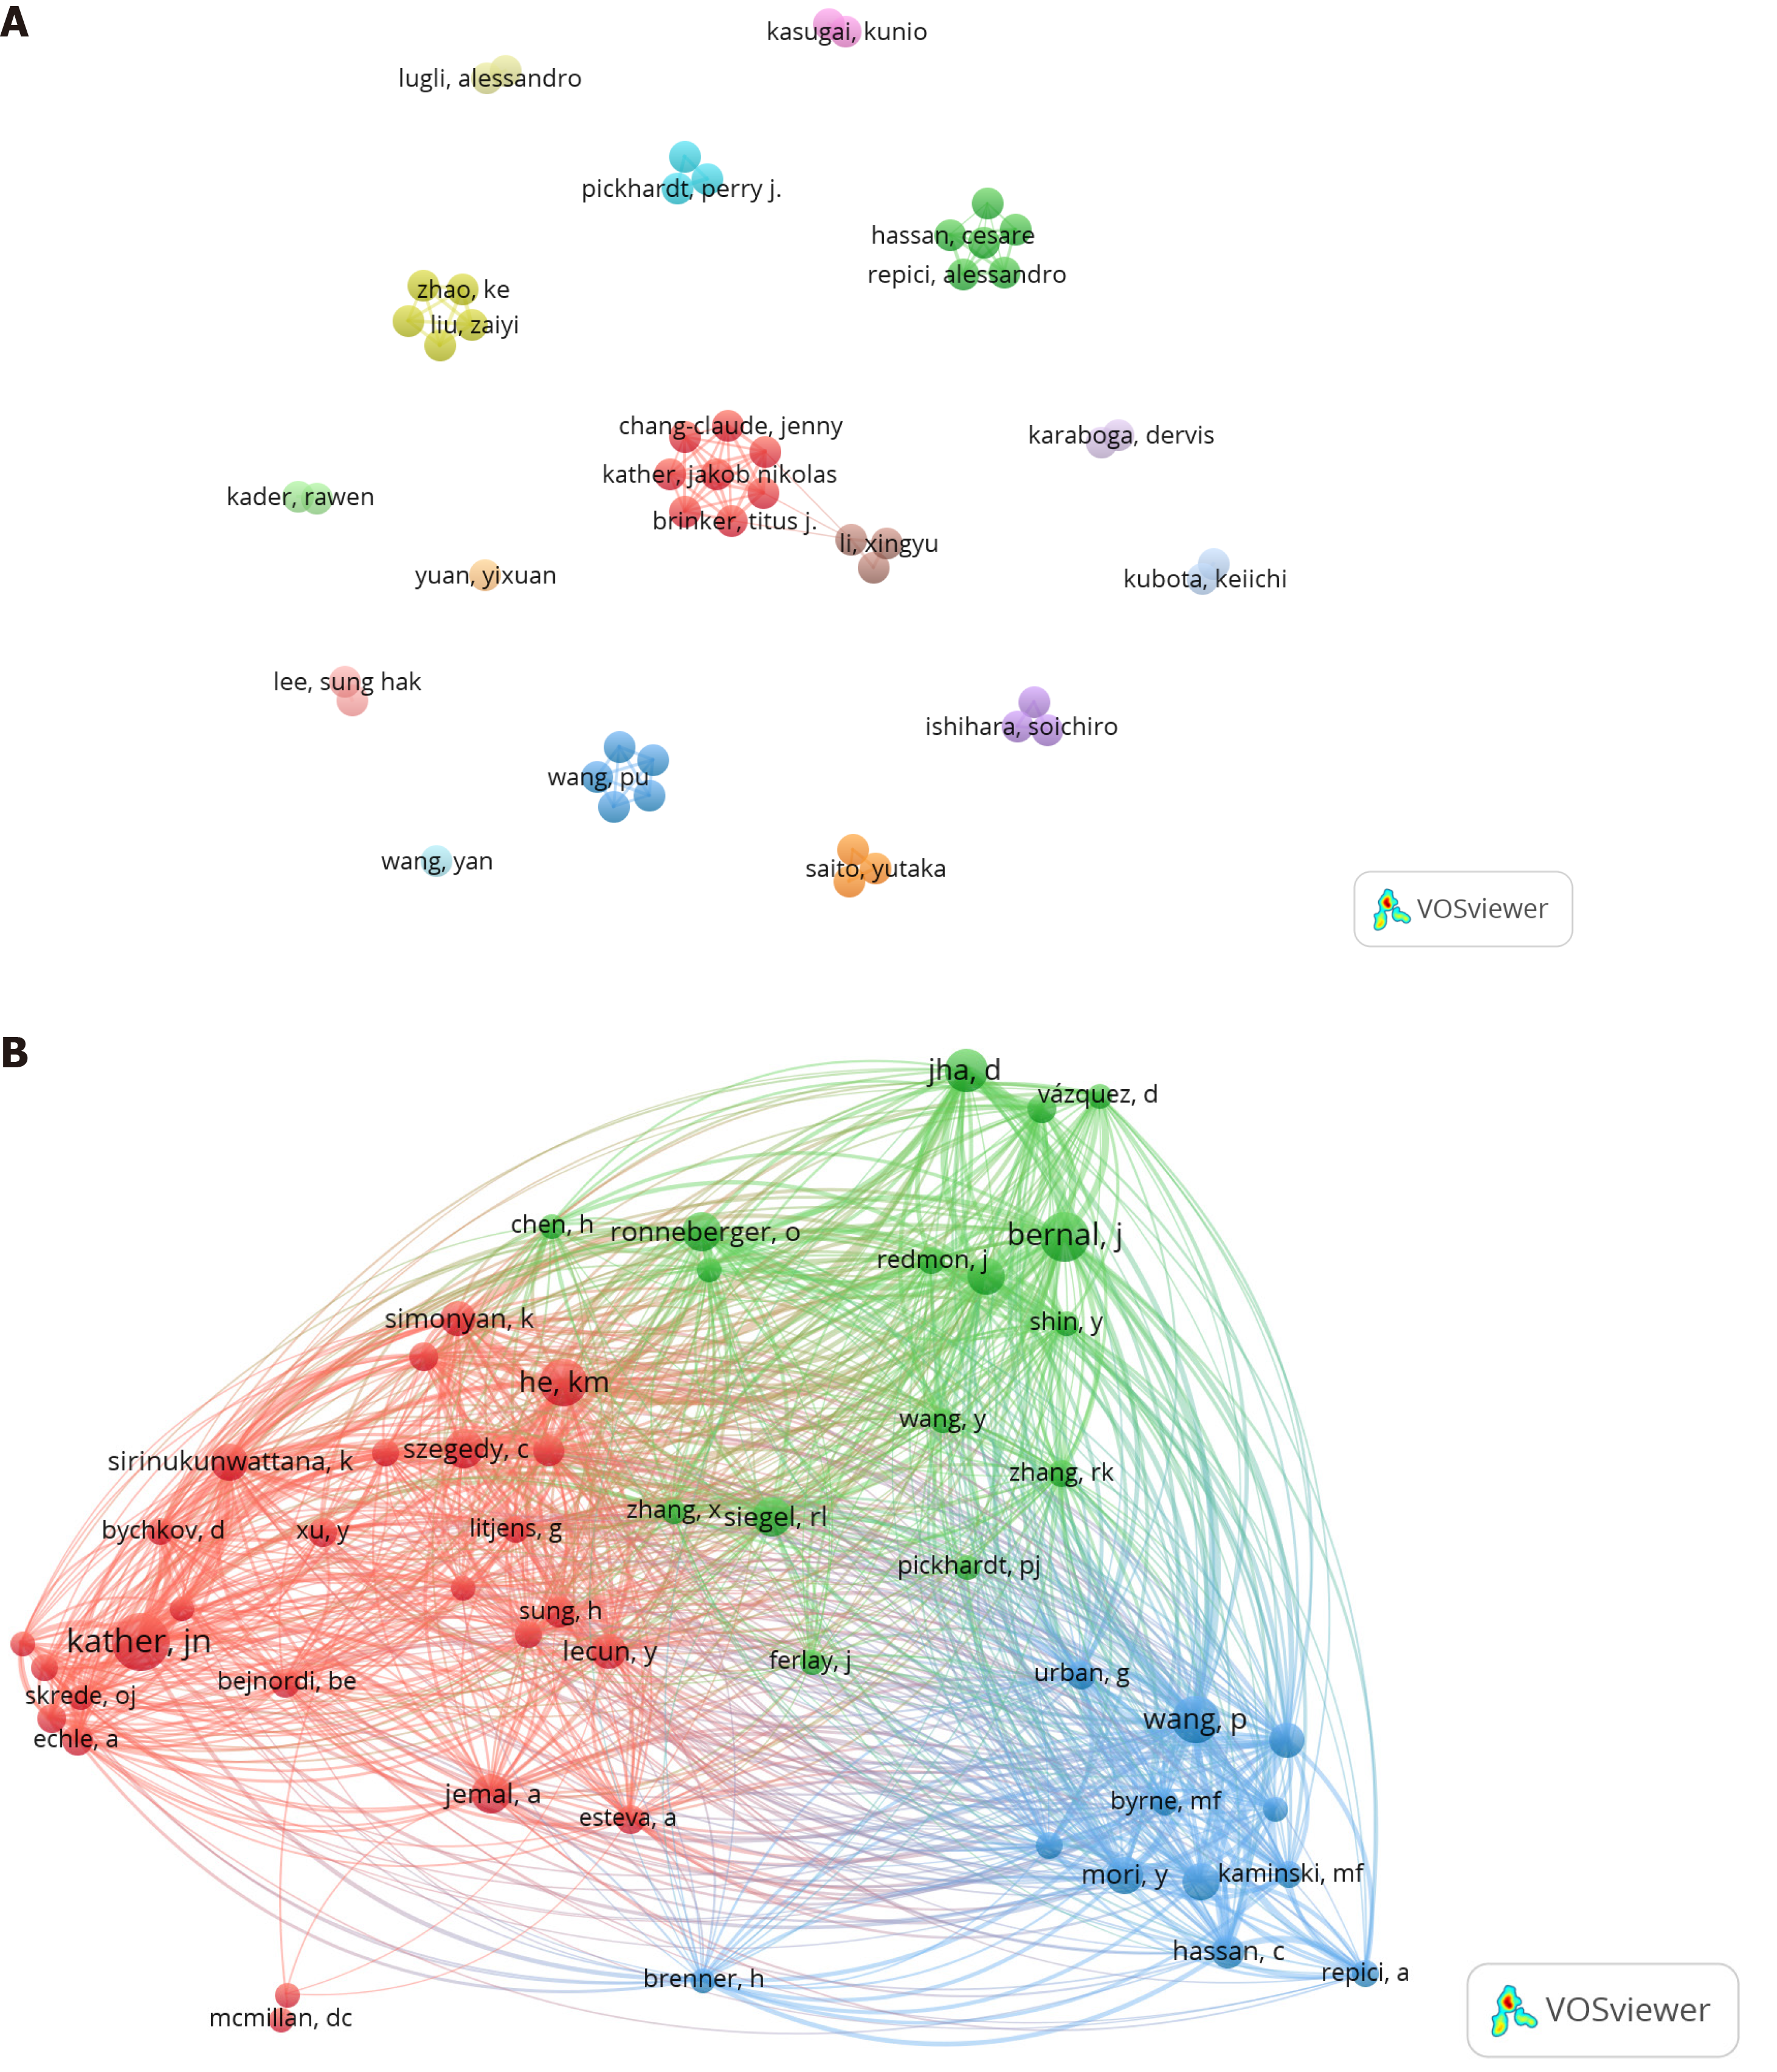
Figure 6 Collaboration networks.
A: Author collaboration network; B: Co-cited authors collaboration network.
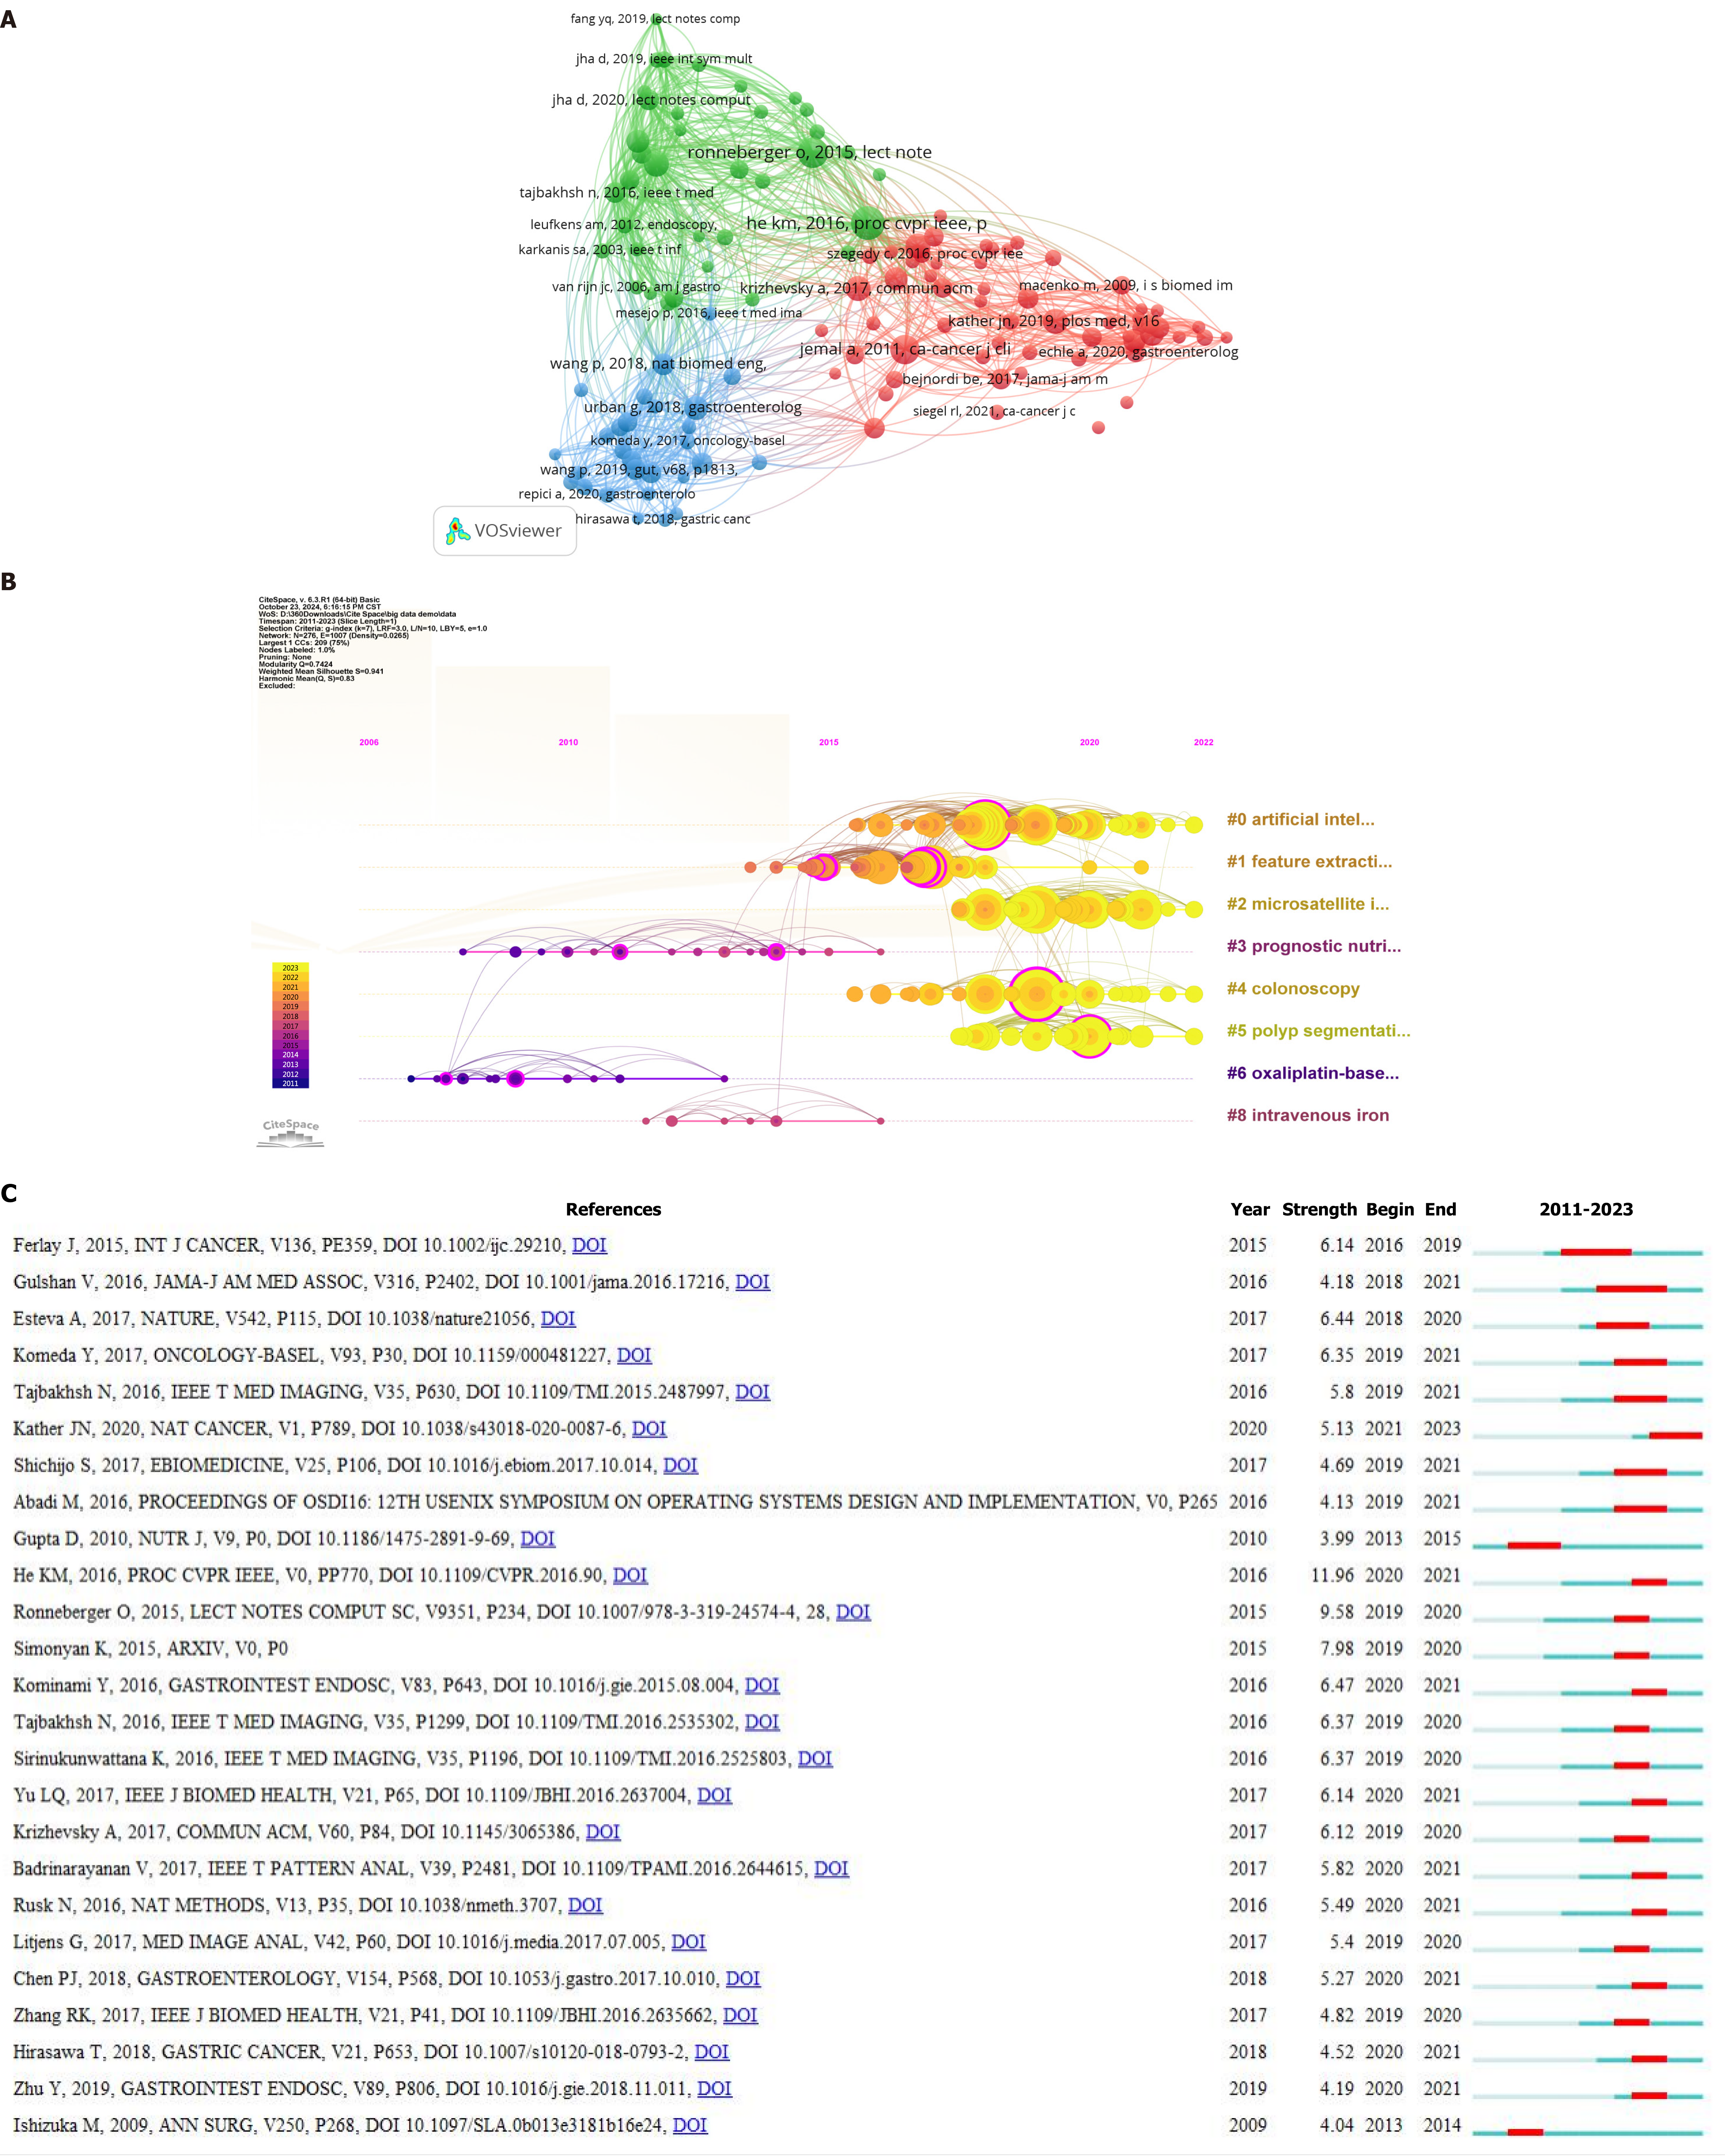
Figure 7 Analysis of references.
A: Cluster analysis of references; B: Reference timeline chart; C: Top 25 references with the highest citation explosion rates.
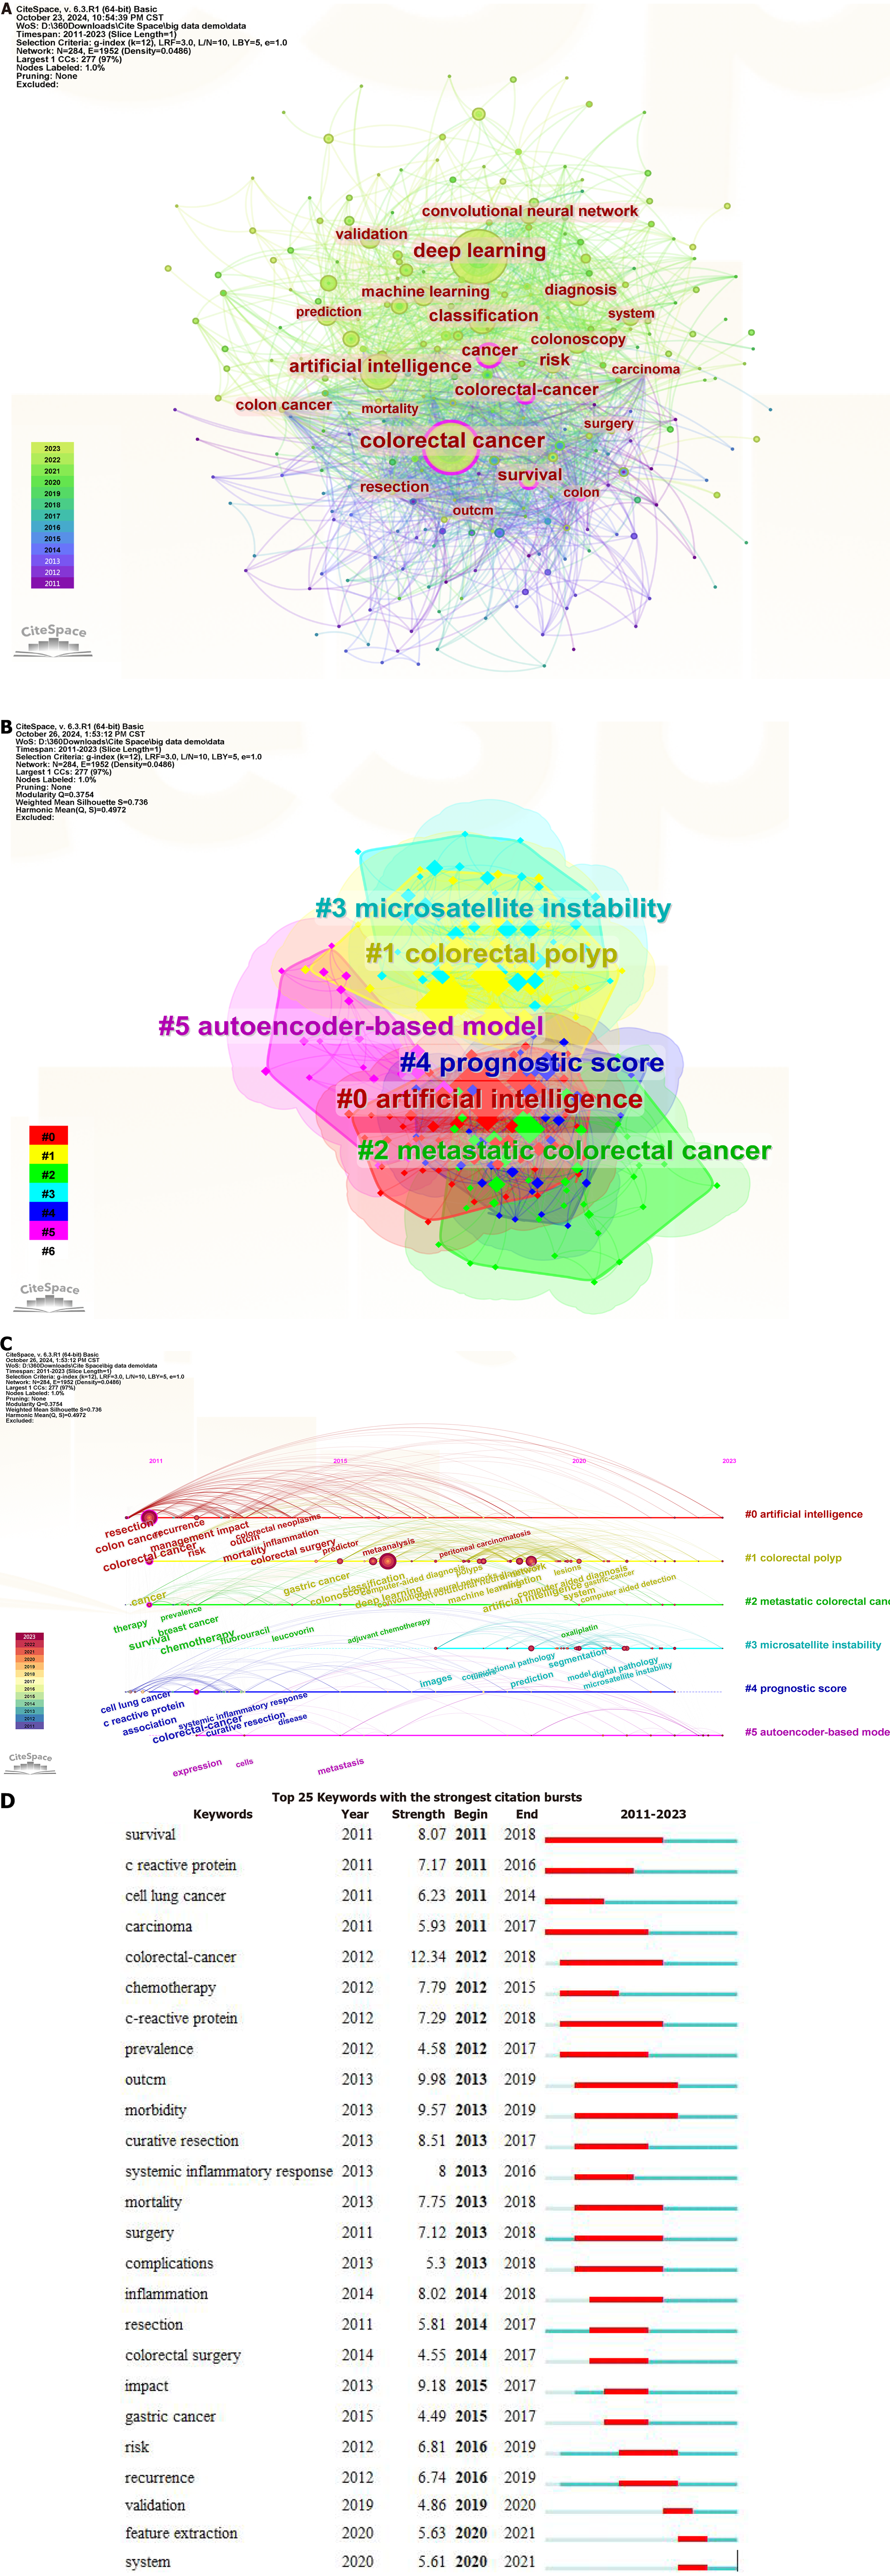
Figure 8 Analysis of keywords.
A: Keyword co-occurrence chart; B: Keyword clustering chart; C: Keyword timeline chart; D: Top 25 keywords with the highest citation explosion rates.
- Citation: Qi LY, Li BW, Chen JQ, Bian HP, Xue JN, Zhao HX. Research status and trends of deep learning in colorectal cancer (2011-2023): Bibliometric analysis and visualization. World J Gastrointest Oncol 2025; 17(5): 103667
- URL: https://www.wjgnet.com/1948-5204/full/v17/i5/103667.htm
- DOI: https://dx.doi.org/10.4251/wjgo.v17.i5.103667


