Copyright
©The Author(s) 2025.
World J Gastrointest Oncol. May 15, 2025; 17(5): 102767
Published online May 15, 2025. doi: 10.4251/wjgo.v17.i5.102767
Published online May 15, 2025. doi: 10.4251/wjgo.v17.i5.102767
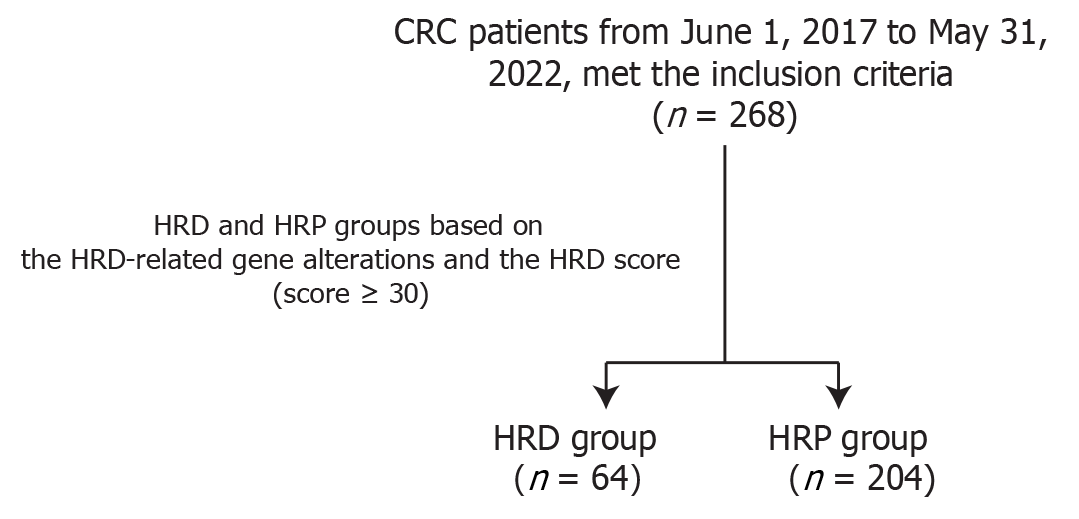
Figure 1 The flow diagram of the study population.
CRC: Colorectal cancer; HRD: Homologous recombination deficiency; HRP: Homologous recombination proficient.
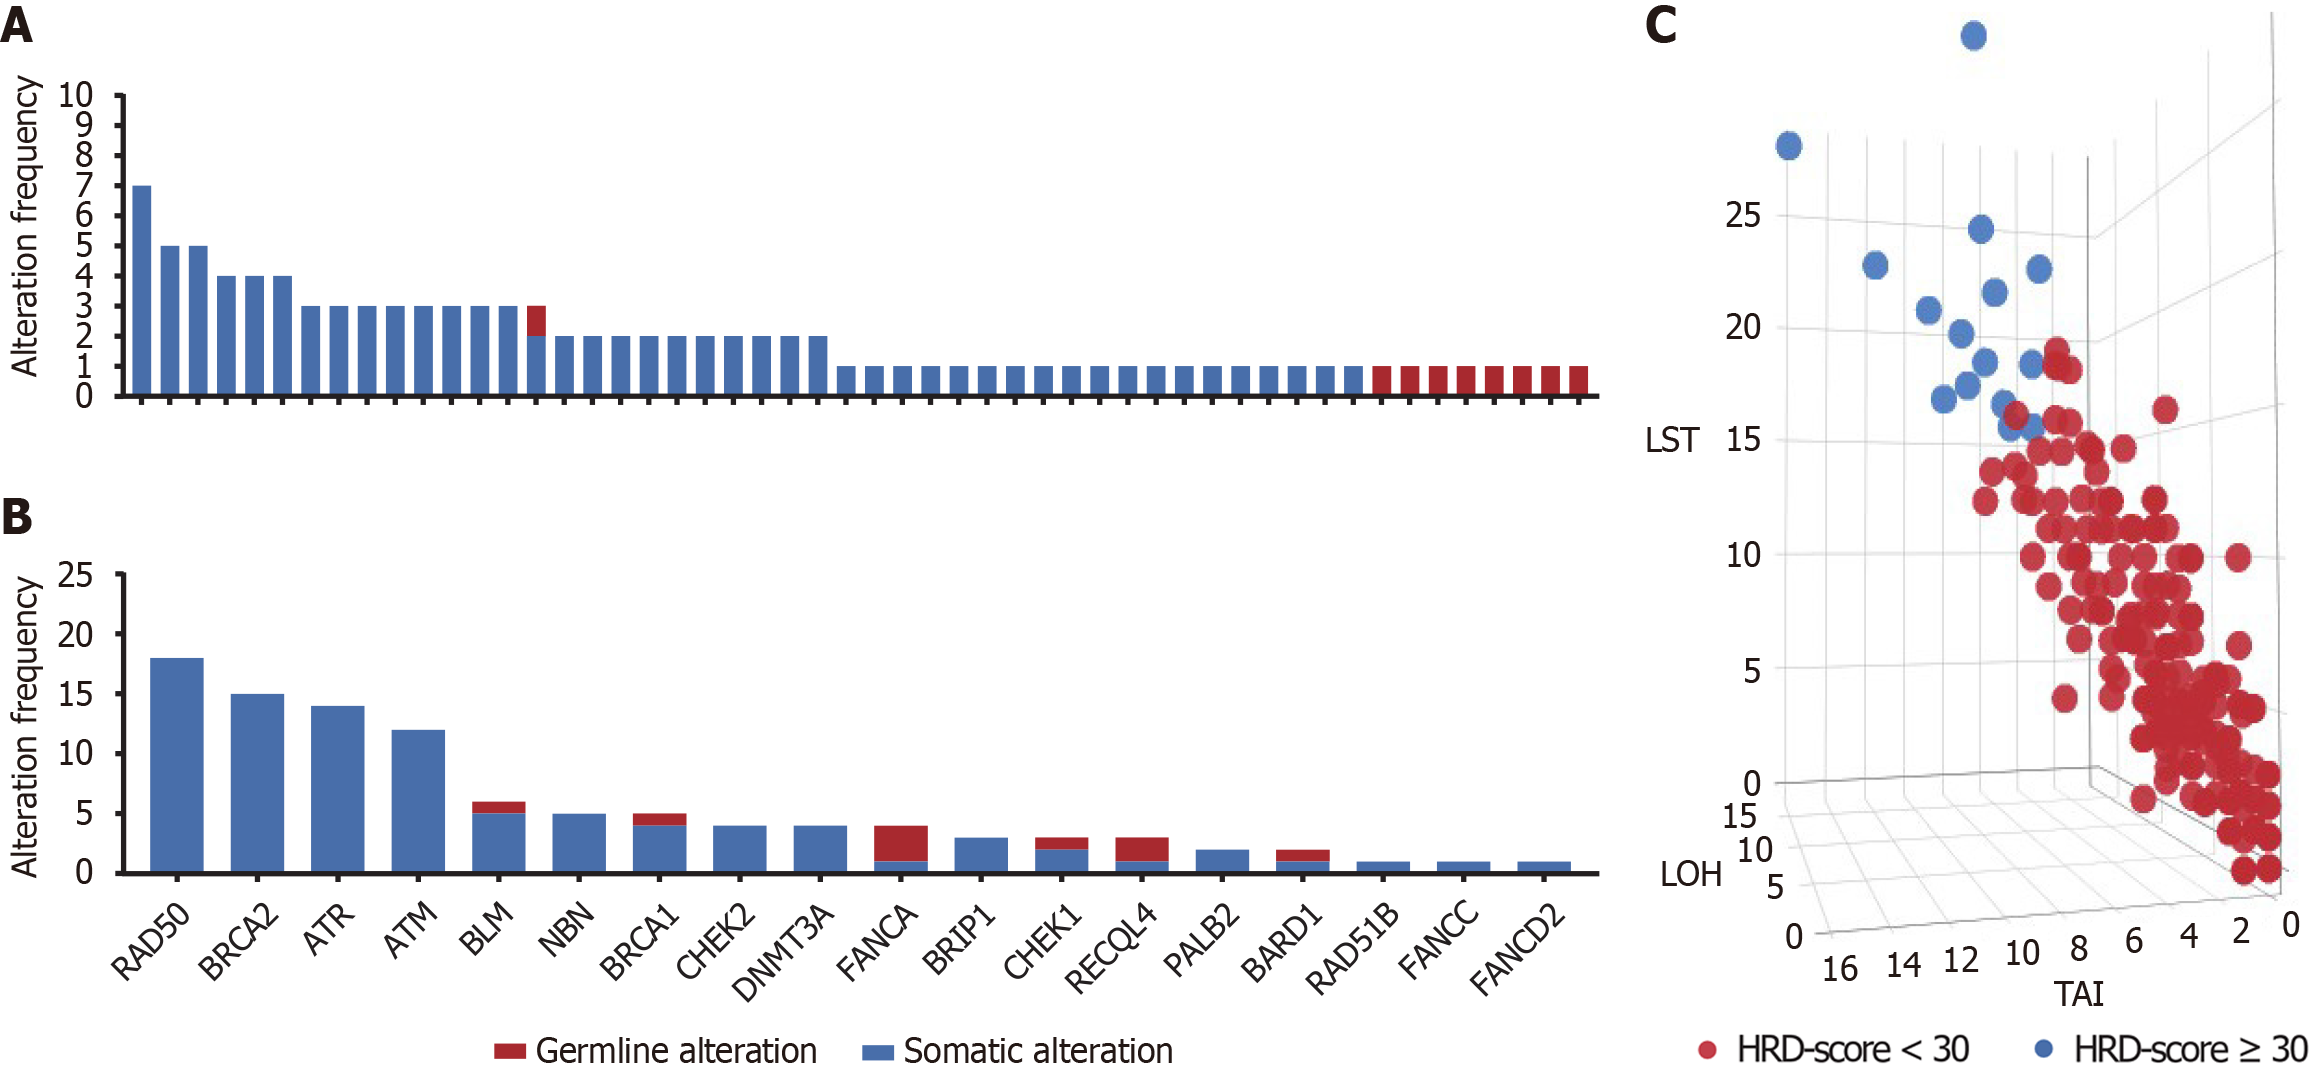
Figure 2 Homologous recombination deficiency-related gene alterations and homologous recombination deficiency-score distribution among colorectal cancer patients.
A: Each bar represents the number of patients carrying alterations in homologous recombination deficiency (HRD)-related genes, including germline and somatic alterations, with 52 individuals carrying the relevant alterations; B: Each bar represents the number of alterations in one HRD-related gene in the total population, including germline and somatic alterations; C: The X-axis, Y-axis, and Z-axis represent the telomere-allele imbalance, loss of heterozygosity, and large-scale state transition scores, respectively. The blue dots represent colorectal cancer patients whose sum of the three is greater than or equal to 30. HRD: Homologous recombination deficiency; LOH: Loss of heterozygosity; LST: Large-scale state transition.
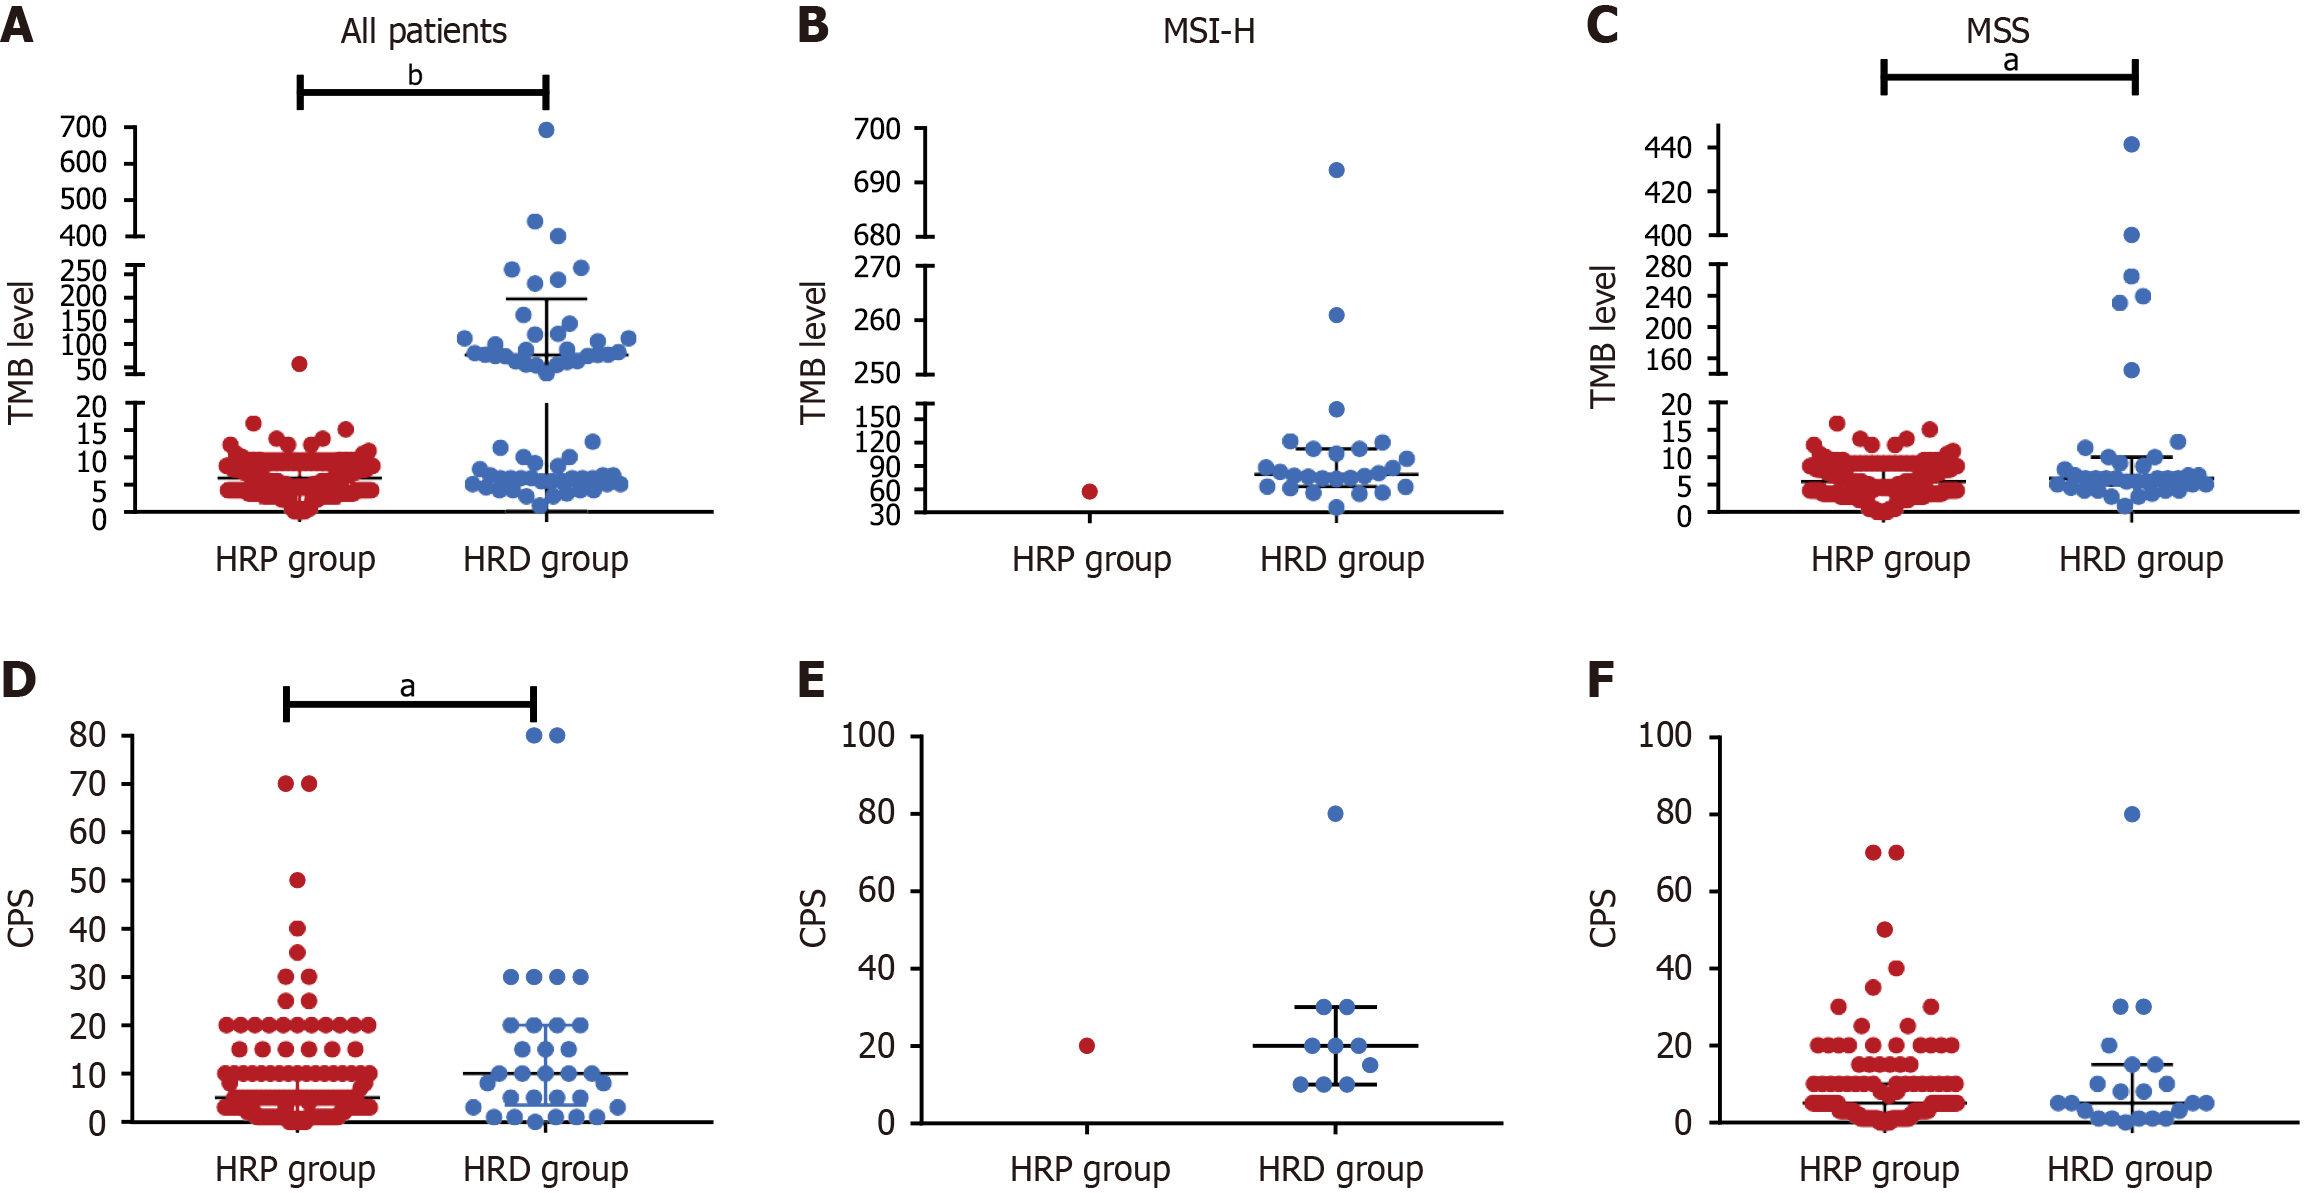
Figure 3 Combined positive score and tumor mutation burden level distribution characteristics in colorectal cancer patients.
A: Distribution of tumor mutation burden (TMB) levels between homologous recombination deficiency (HRD) and homologous recombination proficient (HRP) groups in all patients; B: Distribution of TMB level between HRD and HRP groups in microsatellite instability-high (MSI-H) patients; C: Distribution of TMB level between HRD and HRP groups in microsatellite-stable (MSS) patients; D: Distribution of combined positive score (CPS) between HRD and HRP groups in all patients; E: Distribution of CPS between HRD and HRP groups in MSI-H patients; F: Distribution of CPS between HRD and HRP groups in MSS patients. aP < 0.05; bP < 0.01. CPS: Combined positive score; TMB: Tumor mutation burden; CRC: Colorectal cancer; HRD: Homologous recombination deficiency; HRP: Homologous recombination proficient; MSI-H: Microsatellite instability-high; MSS: Microsatellite-stable.
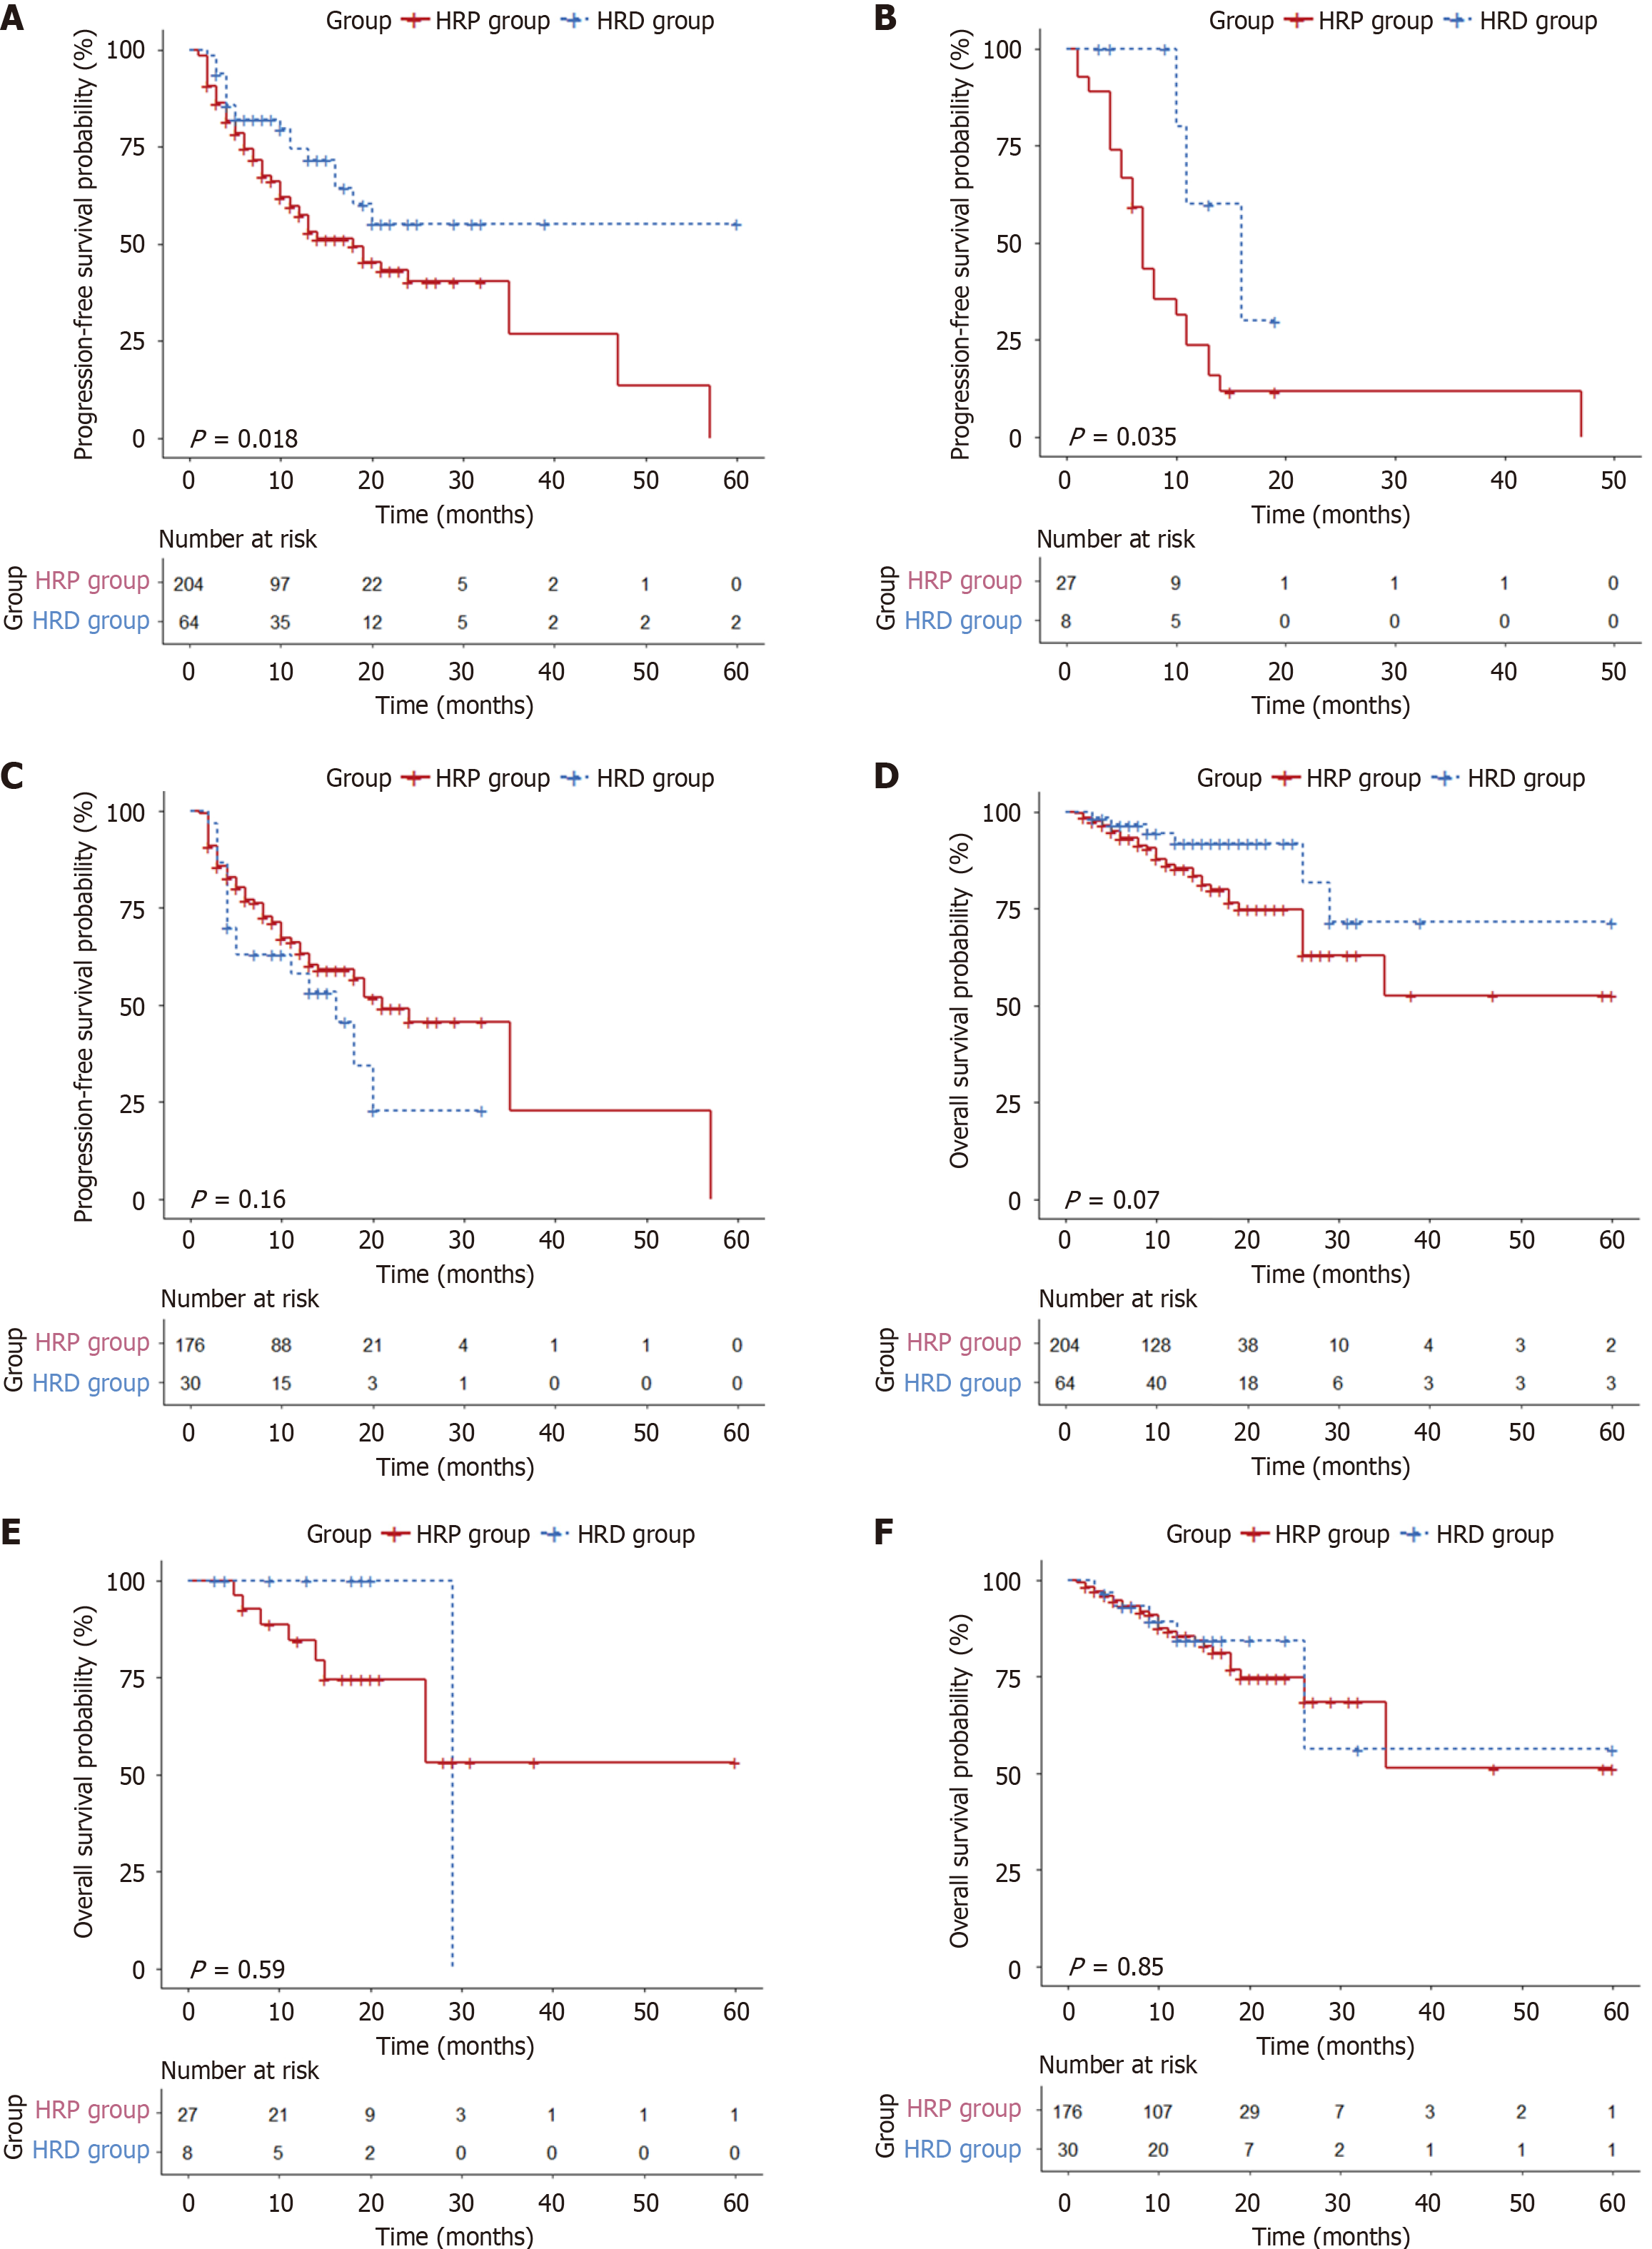
Figure 4 Kaplan-Meier curves of progression-free survival and overall survival in homologous recombination deficiency/homologous recombination proficient cohort.
Survival curves were compared, and P values were determined using a 2-sided log-rank test. A: Progression-free survival (PFS) in all colorectal cancer (CRC) patients stratified by homologous recombination deficiency (HRD) and homologous recombination proficient (HRP) status; B: PFS in microsatellite-stable (MSS) CRC patients who received immune checkpoint inhibitors (ICIs), stratified by HRD and HRP status; C: PFS in MSS CRC patients who did not receive ICIs, stratified by HRD and HRP status; D: Overall survival (OS) in all CRC patients stratified by HRD and HRP status; E: OS in MSS CRC patients who received ICIs, stratified by HRD and HRP status; F: OS in MSS CRC patients who did not receive ICIs, stratified by HRD and HRP status. PFS: Progression-free survival; OS: Overall survival; HRD: Homologous recombination deficiency; HRP: Homologous recombination proficient; CRC: Colorectal cancer; MSS: Microsatellite-stable.
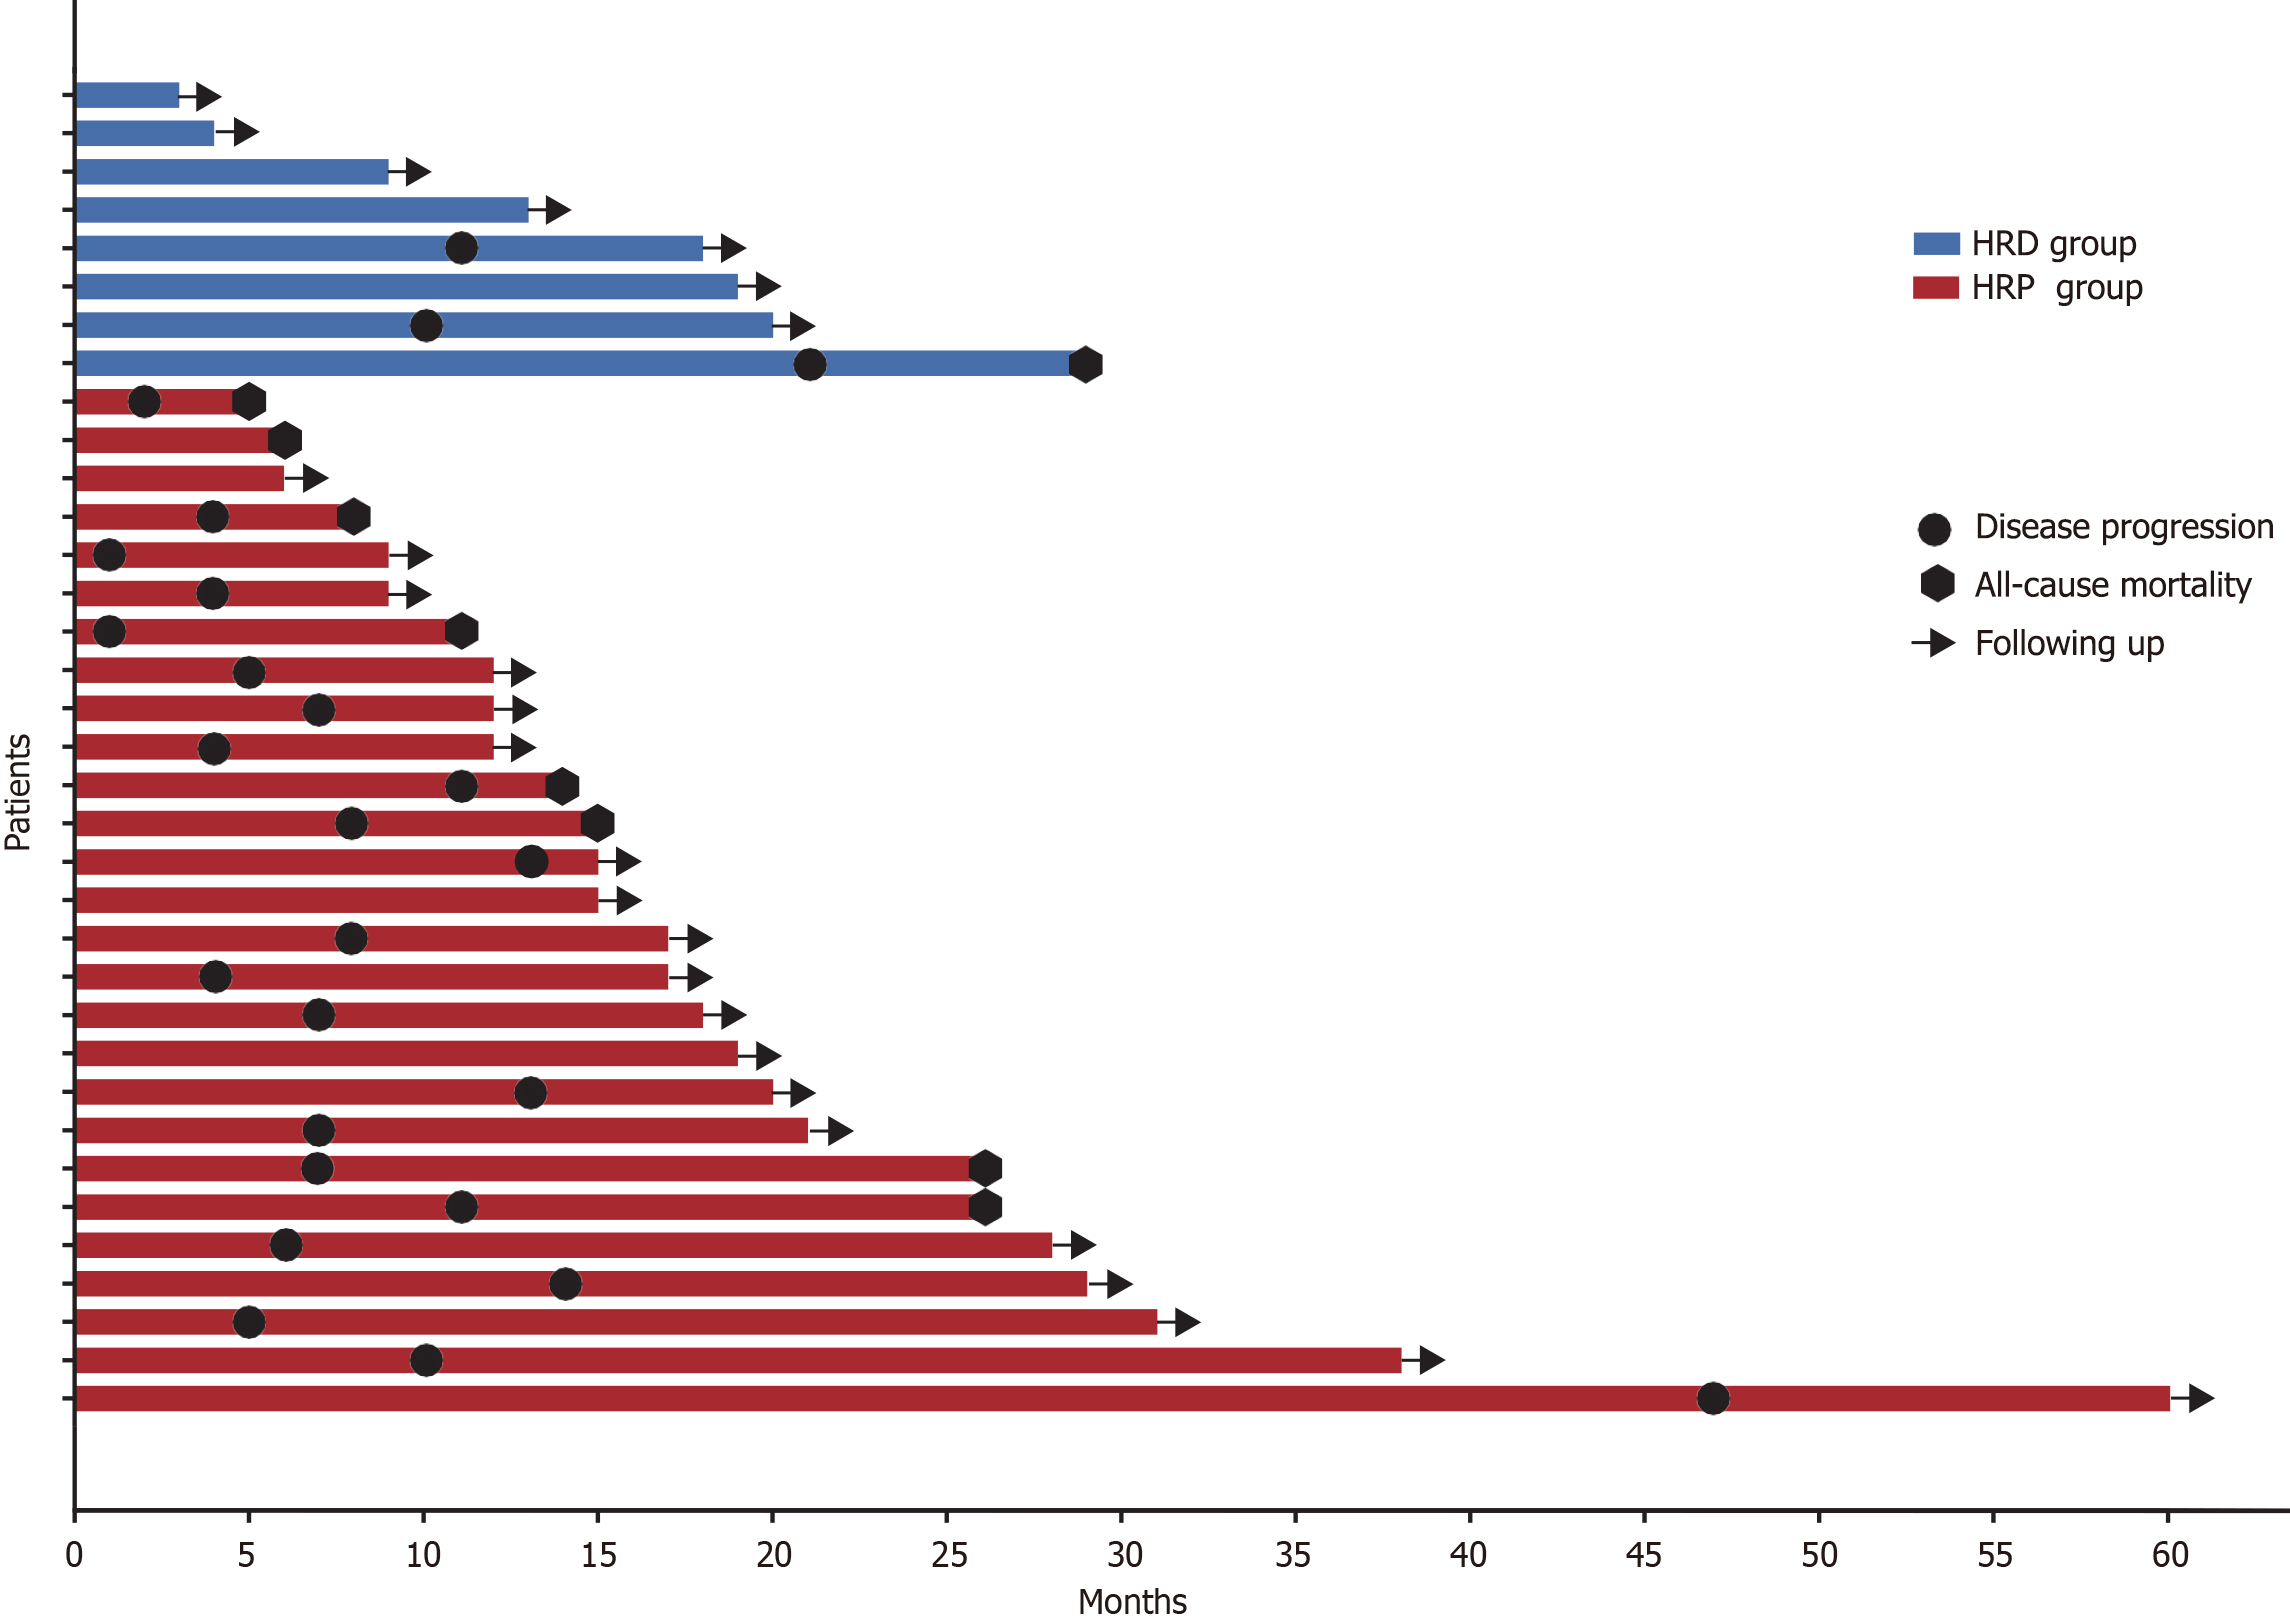
Figure 5 The swimmer plot of patients treated with immunotherapy in microsatellite-stable cohort.
Different colors represent the homologous recombination deficiency group and homologous recombination proficient group, respectively. The horizontal axis represents the survival time, each bar on the vertical axis represents a different patient, and symbols represent different clinical outcomes. HRD: Homologous recombination deficiency; HRP: Homologous recombination proficient.
- Citation: Feng H, Zhao LY, Xu Z, Xie QF, Deng HJ, Yu J, Liu H. Homologous recombination deficiency and immunotherapy response in microsatellite-stable colorectal cancer: Evidence from a cohort study in China. World J Gastrointest Oncol 2025; 17(5): 102767
- URL: https://www.wjgnet.com/1948-5204/full/v17/i5/102767.htm
- DOI: https://dx.doi.org/10.4251/wjgo.v17.i5.102767


