Copyright
©The Author(s) 2025.
World J Gastrointest Oncol. May 15, 2025; 17(5): 102767
Published online May 15, 2025. doi: 10.4251/wjgo.v17.i5.102767
Published online May 15, 2025. doi: 10.4251/wjgo.v17.i5.102767
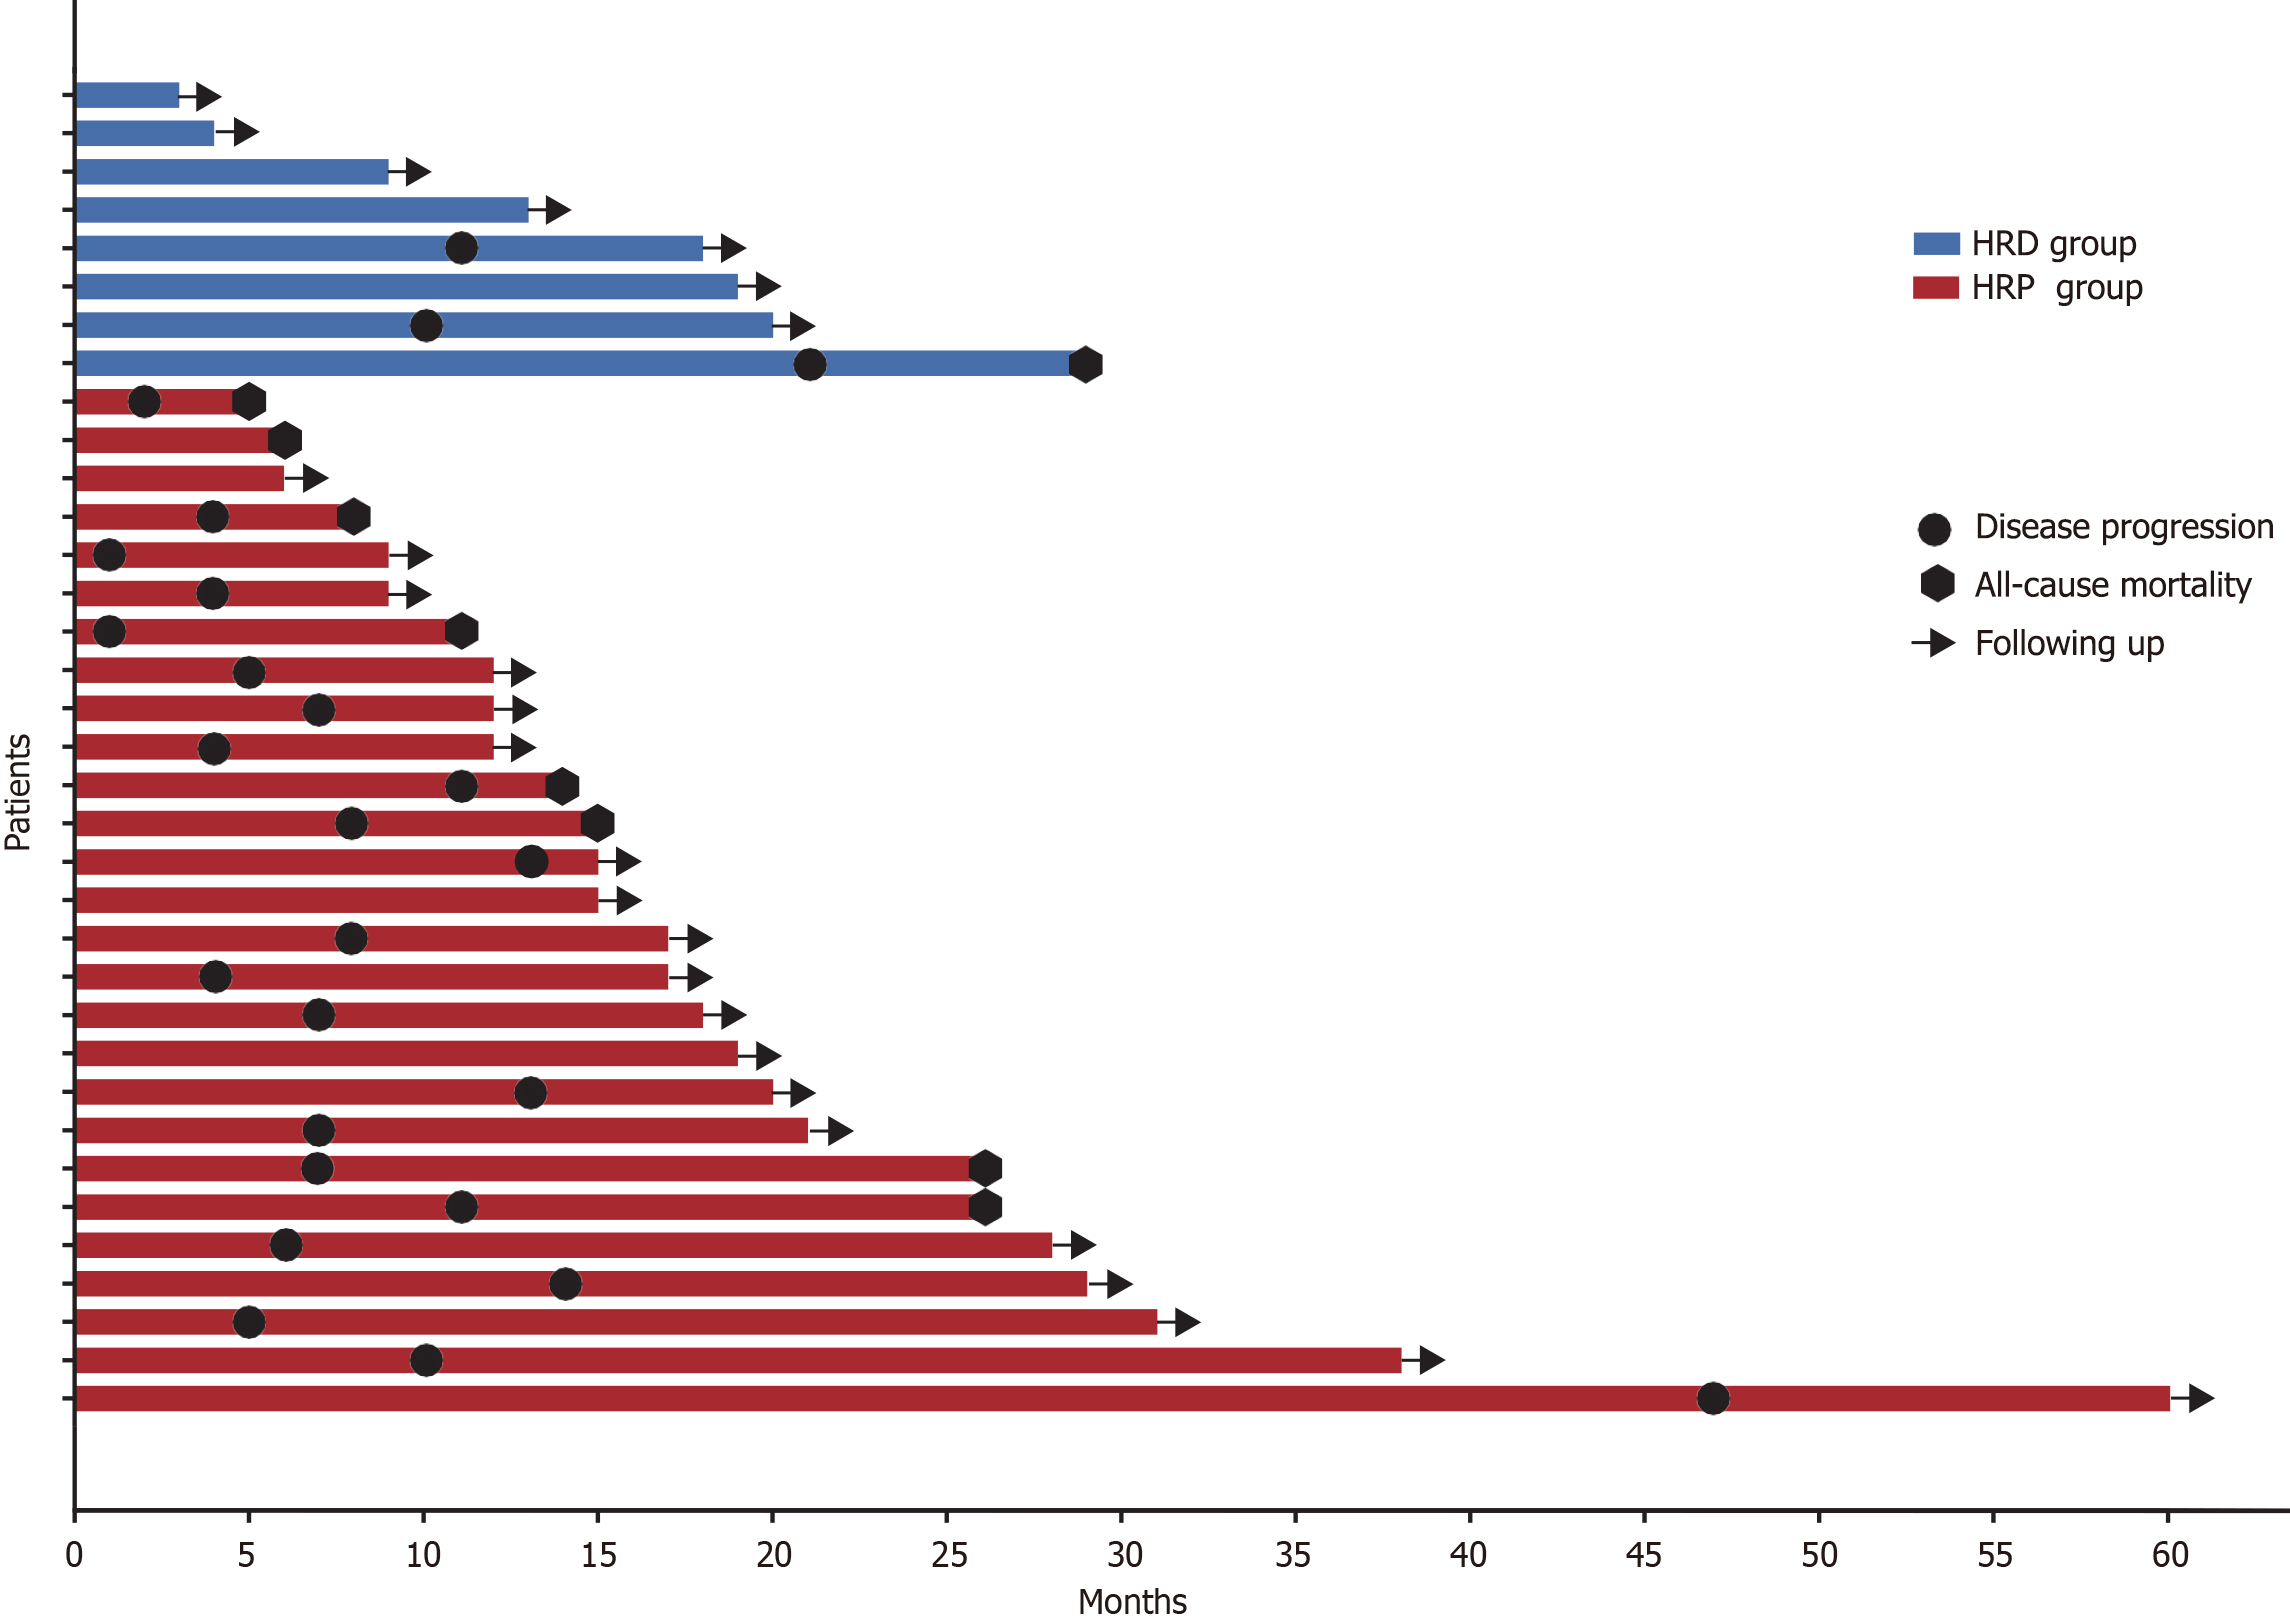
Figure 5 The swimmer plot of patients treated with immunotherapy in microsatellite-stable cohort.
Different colors represent the homologous recombination deficiency group and homologous recombination proficient group, respectively. The horizontal axis represents the survival time, each bar on the vertical axis represents a different patient, and symbols represent different clinical outcomes. HRD: Homologous recombination deficiency; HRP: Homologous recombination proficient.
- Citation: Feng H, Zhao LY, Xu Z, Xie QF, Deng HJ, Yu J, Liu H. Homologous recombination deficiency and immunotherapy response in microsatellite-stable colorectal cancer: Evidence from a cohort study in China. World J Gastrointest Oncol 2025; 17(5): 102767
- URL: https://www.wjgnet.com/1948-5204/full/v17/i5/102767.htm
- DOI: https://dx.doi.org/10.4251/wjgo.v17.i5.102767


