Copyright
©The Author(s) 2023.
World J Gastrointest Oncol. Nov 15, 2023; 15(11): 1951-1973
Published online Nov 15, 2023. doi: 10.4251/wjgo.v15.i11.1951
Published online Nov 15, 2023. doi: 10.4251/wjgo.v15.i11.1951
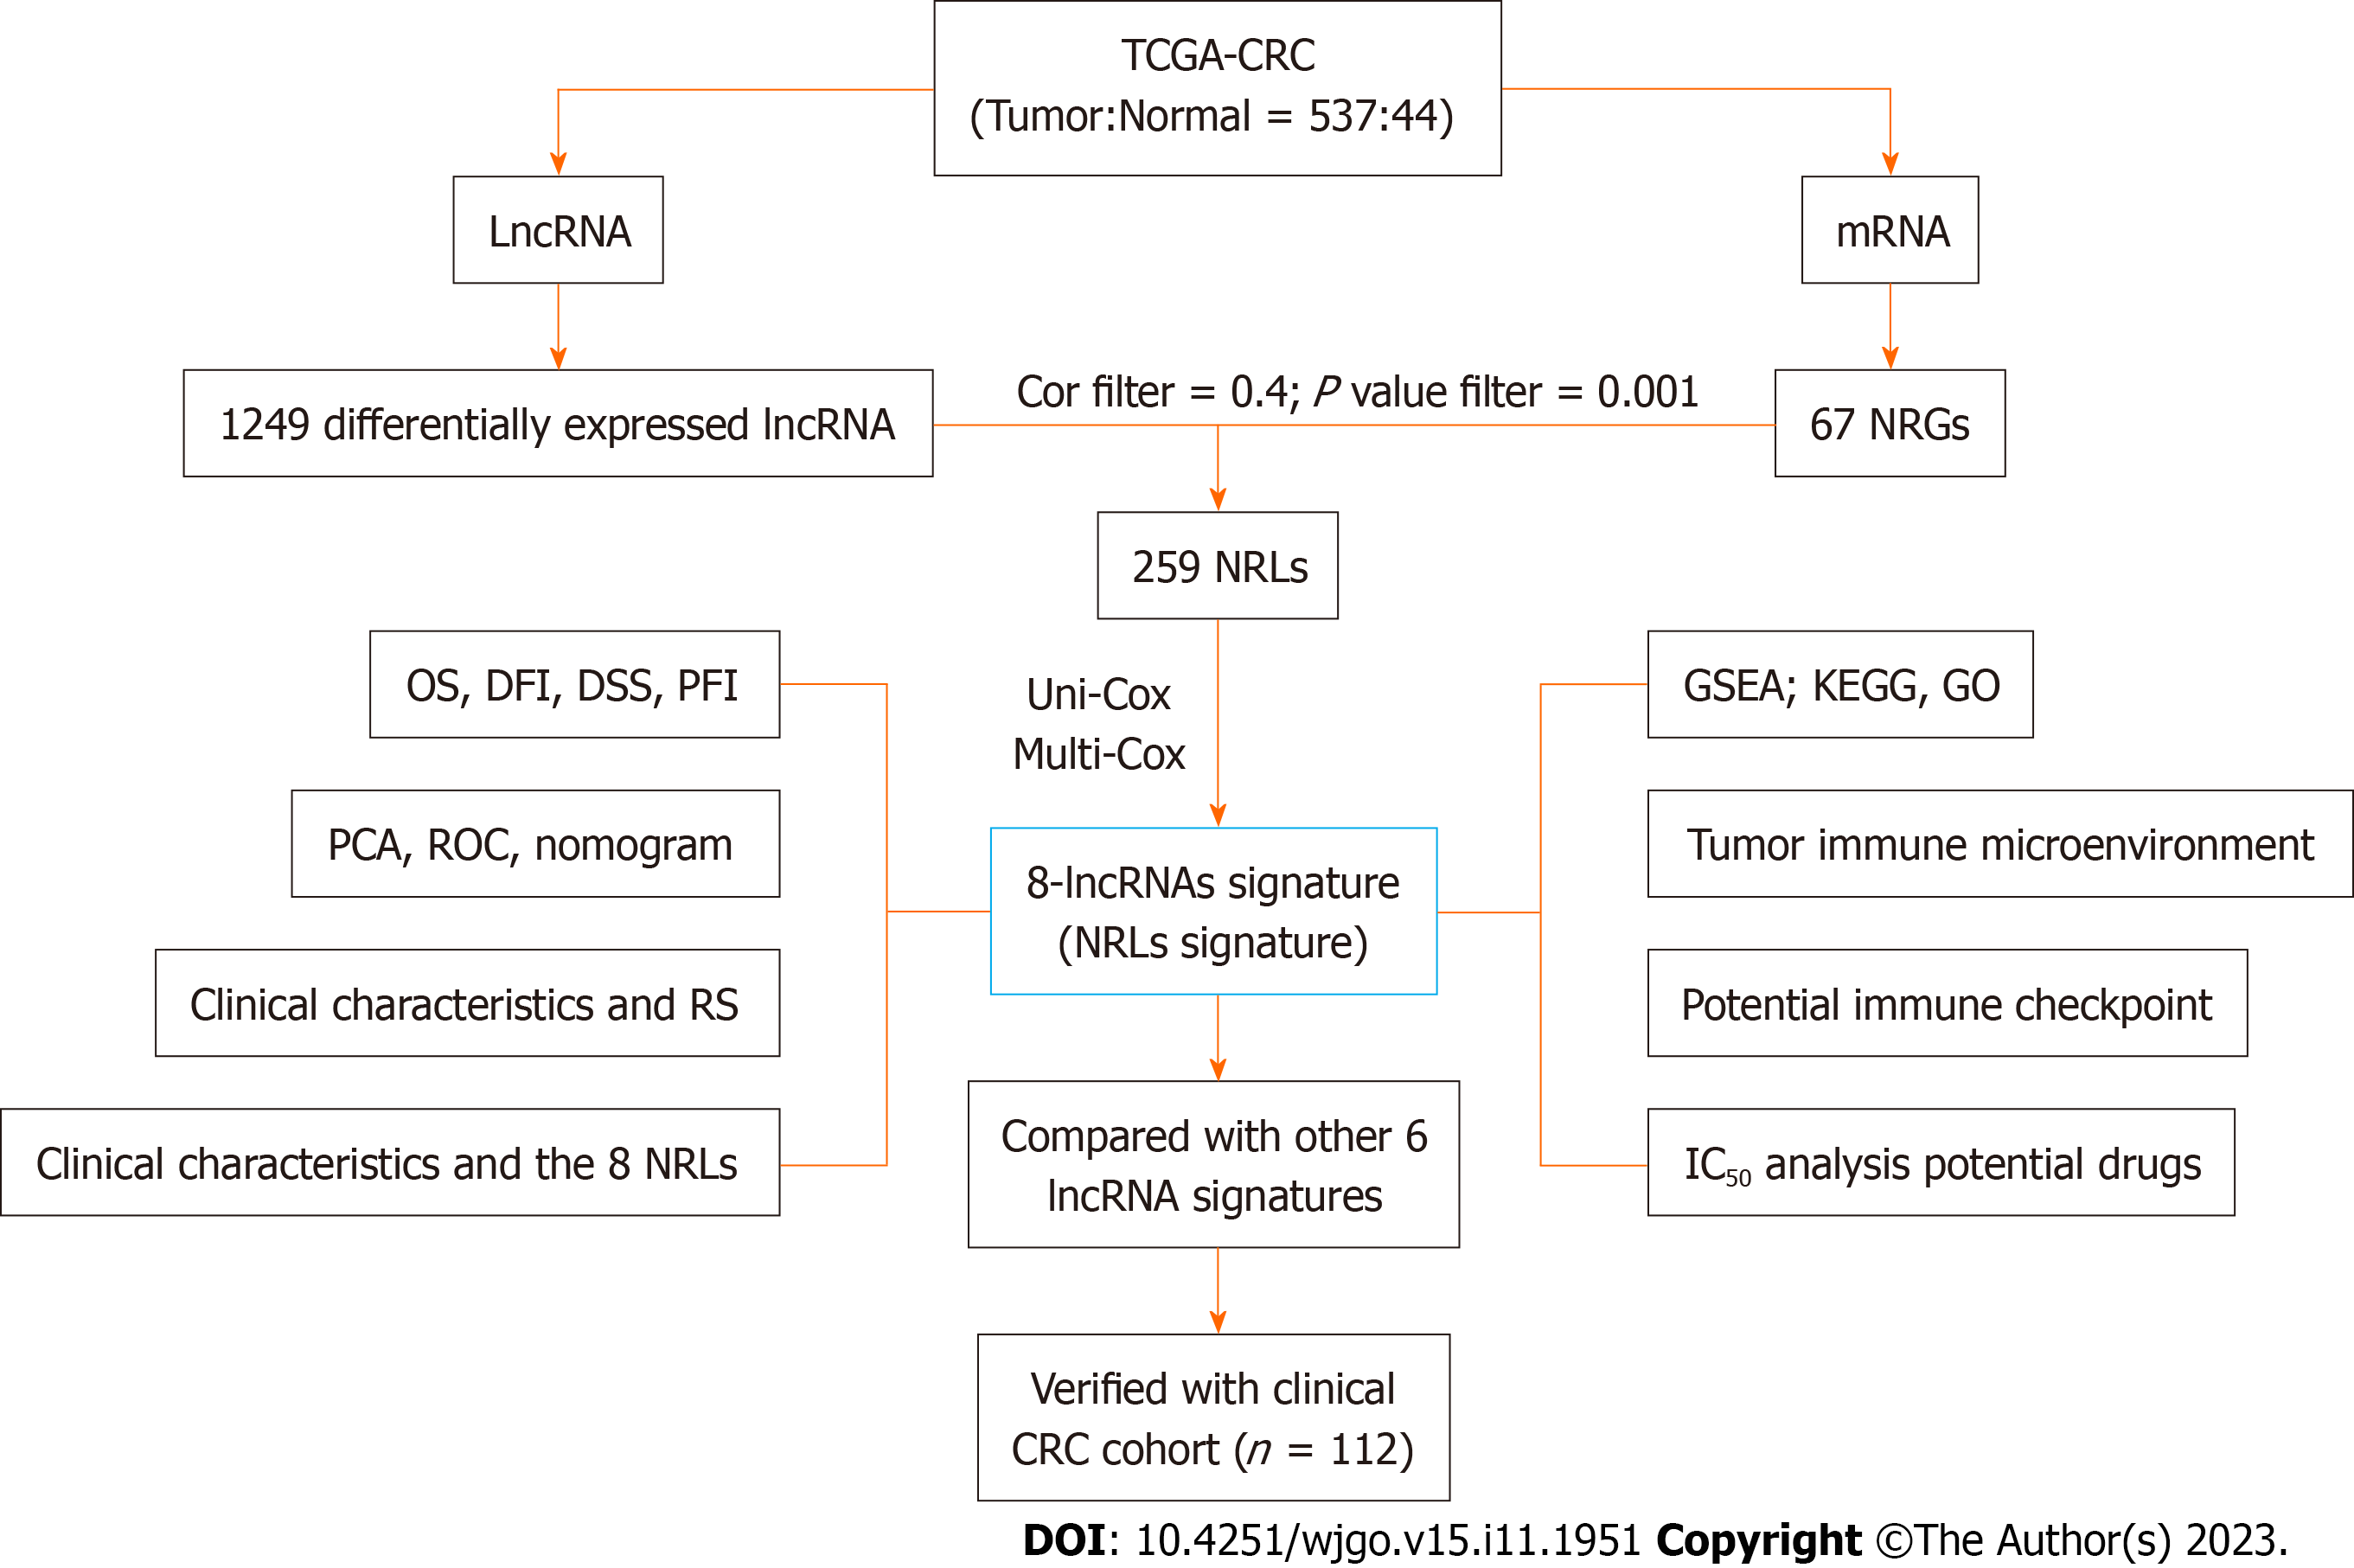
Figure 1 The entire analysis workflow for the study.
CRC: Colorectal cancer; DSS: Disease-specific survival; DFI: Disease-free interval; GO: Gene Ontology; GSEA: Gene Set Enrichment Analysis; IC50: Half-maximal inhibitory concentration; KEGG: Kyoto Encyclopedia of Genes and Genomes; LncRNA: Long noncoding RNA; multi-Cox: Multivariate Cox analysis; NRG: Necroptosis related gene; NRL: Necroptosis-related lncRNAs; OS: Overall survival; PCA: Principal component analysis; PFI: Progression-free interval; ROC: Receiver operating characteristic; RS: Risk score; TCGA: The Cancer Genome Atlas; uni-Cox: Univariate Cox analysis.
Figure 2 Prognostic value of the signature containing 8 necroptosis-related long noncoding RNAs for the Cancer Genome Atlas-colorectal cancer cohort.
A: Display of the necroptosis-related long noncoding RNA (lncRNA) signature based on the risk score; B: Survival time and survival status comparisons between the high- and low-risk groups; C: Heatmap of the expression of 8 lncRNAs in the different groups and the relationships between clinicopathological characteristics and the RS. aP < 0.05, bP < 0.01, cP < 0.001.
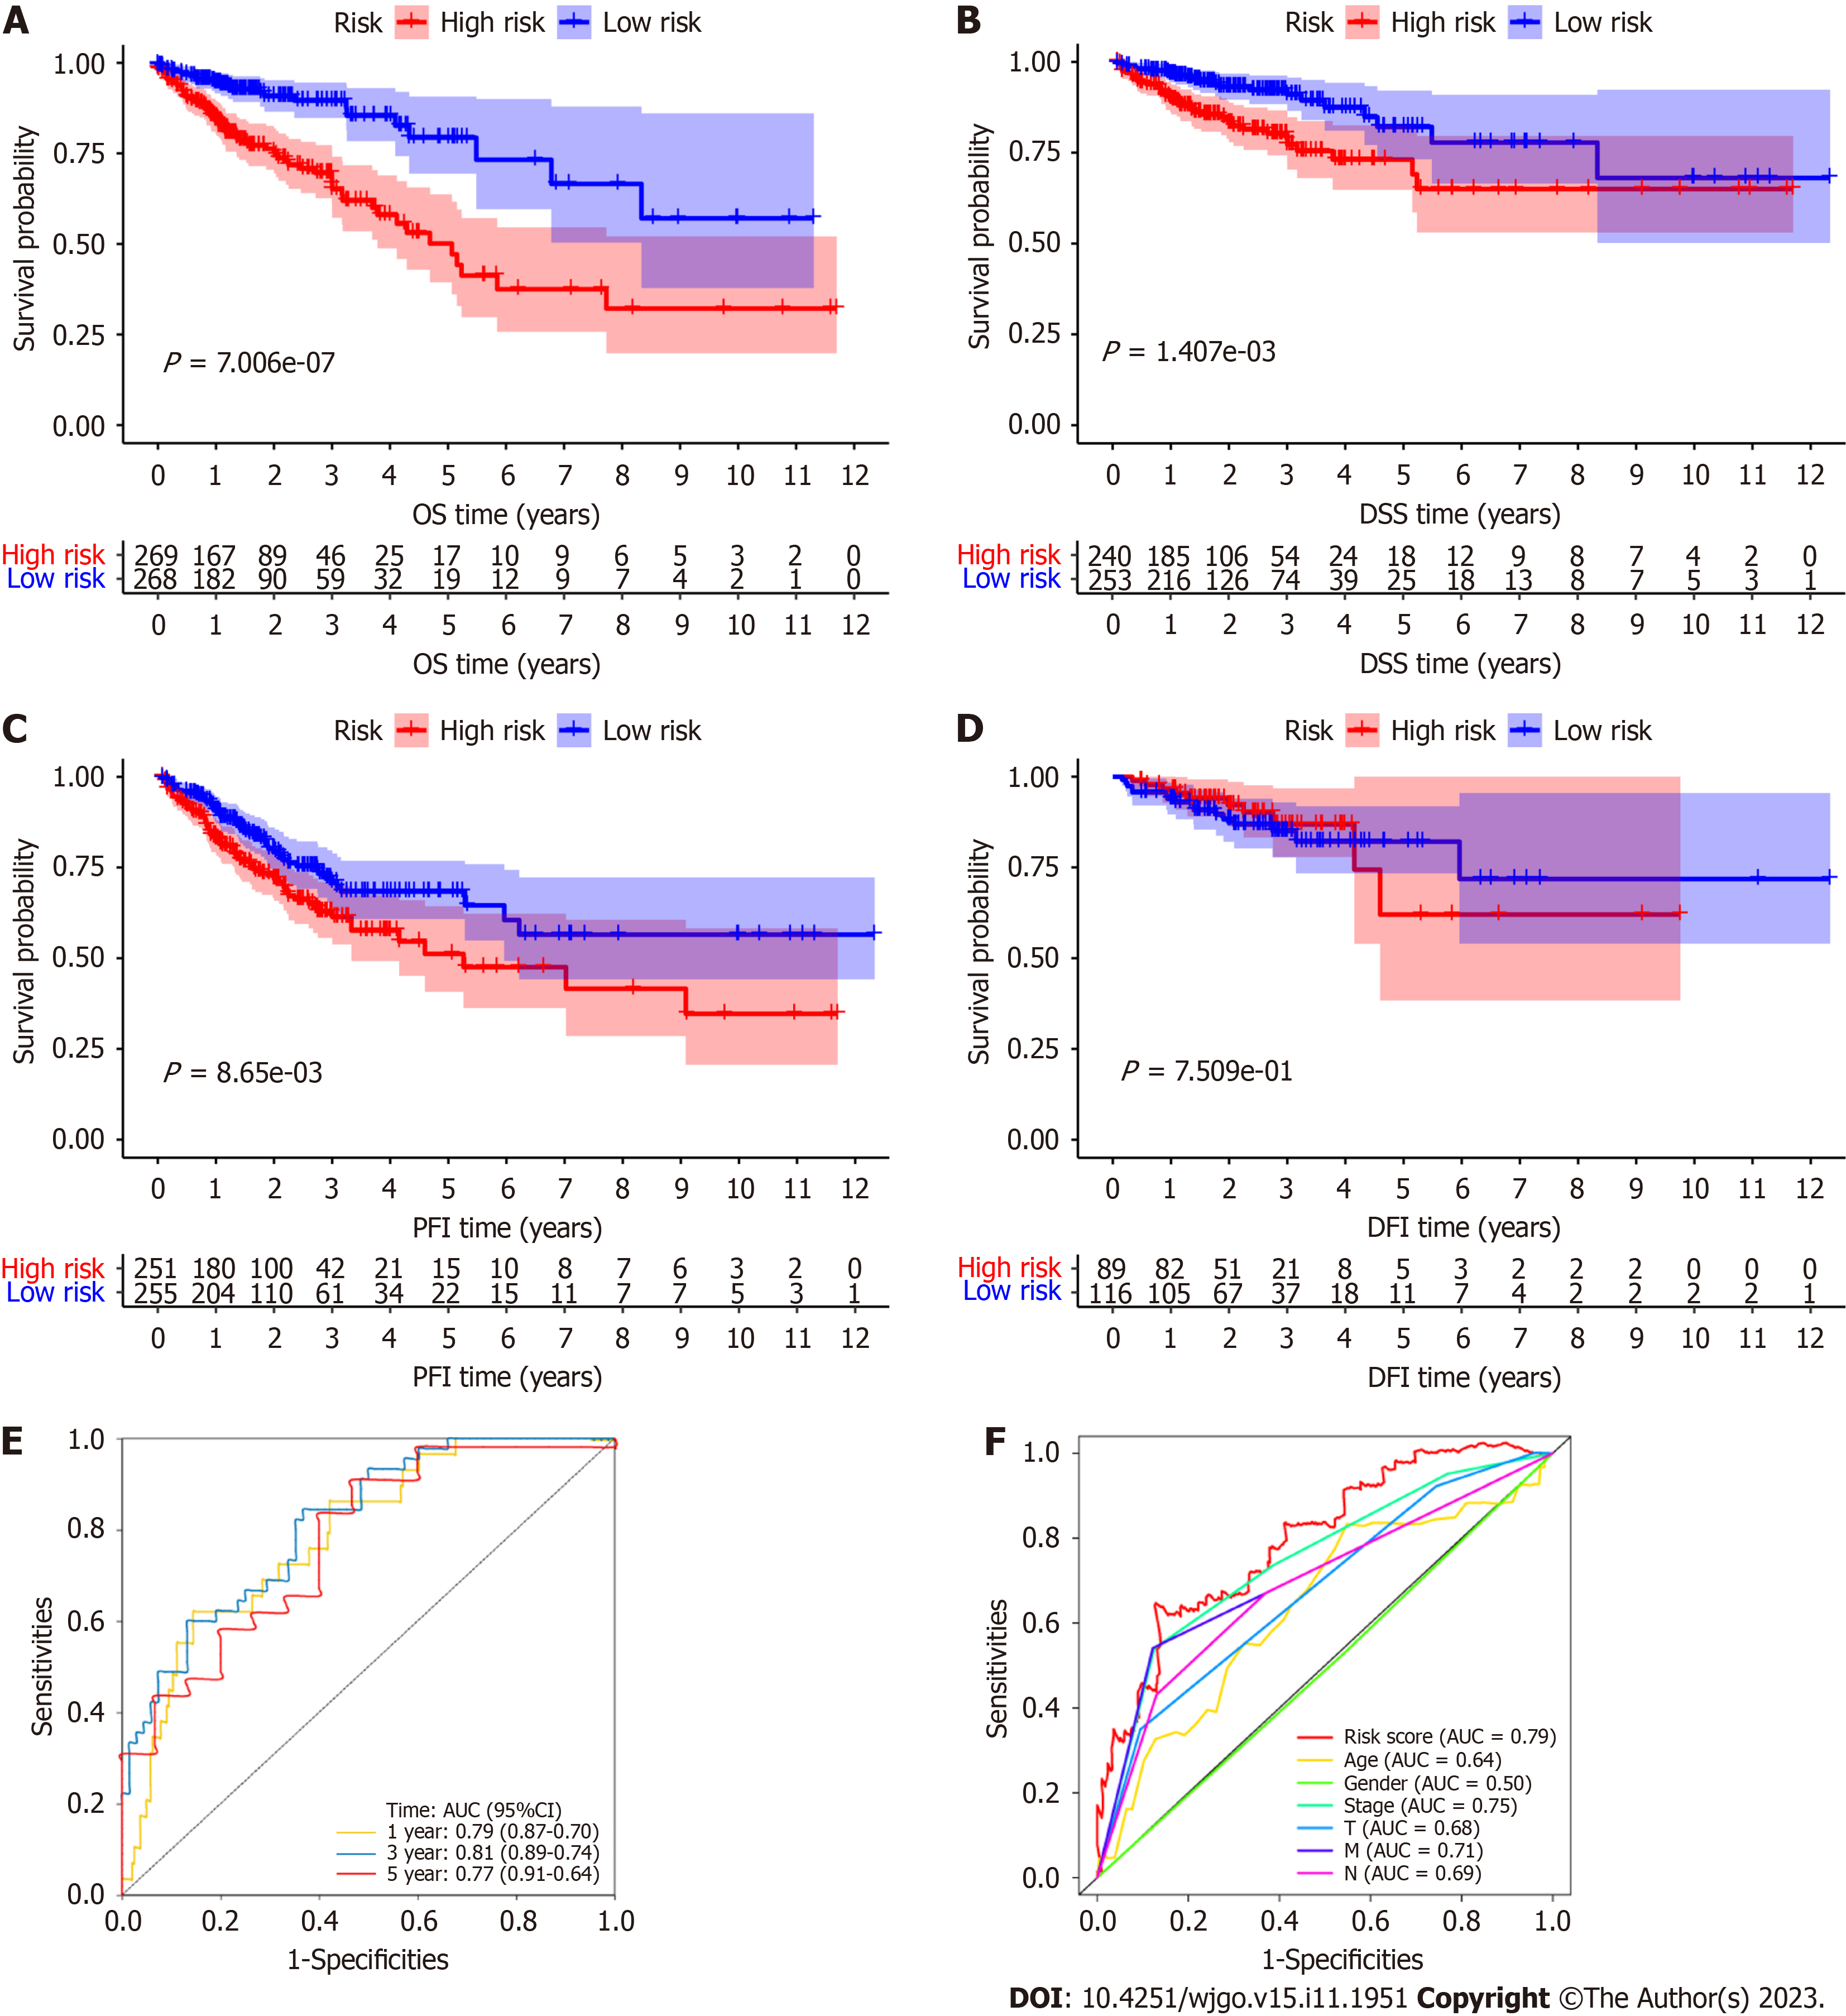
Figure 3 Prognostic value of the signature including 8 necroptosis-related long noncoding RNAs evaluated with Kaplan-Meier survival curves and receiver operating characteristic curves.
A: The Kaplan-Meier (K-M) survival curves for the overall survival (OS) of patients in the high- and low-risk groups; B: The K-M survival curves for the disease-specific survival of patients in the high- and low-risk groups; C: The K-M survival curves for the progression-free interval of patients in the high- and low-risk groups; D: The K-M survival curves for the disease-free interval of patients in the high- and low-risk groups; E: The areas under the receiver operating characteristic curve (AUCs) of the RSs for 1-, 3- and 5-year OS; F: The AUCs of the RS for 1-year OS and for clinicopathological characteristics. 95%CI: 95% confidence interval; AUC: Areas under the receiver operating characteristic curve; DFI: Disease-free interval; DSS: Disease-specific survival; OS: Overall survival; PFI: Progression-free interval.
Figure 4 Construction of the predictive nomogram and assessment of the signature.
A: Univariate Cox regression analyses of clinical factors and the risk score (RS) for overall survival (OS); B: Multivariate Cox regression analyses of clinical factors and the RS for OS; C: The nomogram that integrated age, RS and T stage predicted the probabilities of 1-, 3-, and 5-year OS in colorectal cancer; D: The calibration curves for 1-, 3-, and 5-year OS; E: The Kaplan-Meier OS curves of patients stratified into the high- and low-risk groups with the cutoff for the nomogram total score; F: The 1-, 3-, and 5-year receiver operating characteristic curves for the nomogram total score. aP < 0.01, bP < 0.05, cP < 0.001. 95%CI: 95% confidence interval; AUC: Areas under the receiver operating characteristic curve; OS: Overall survival; RS: Risk score.
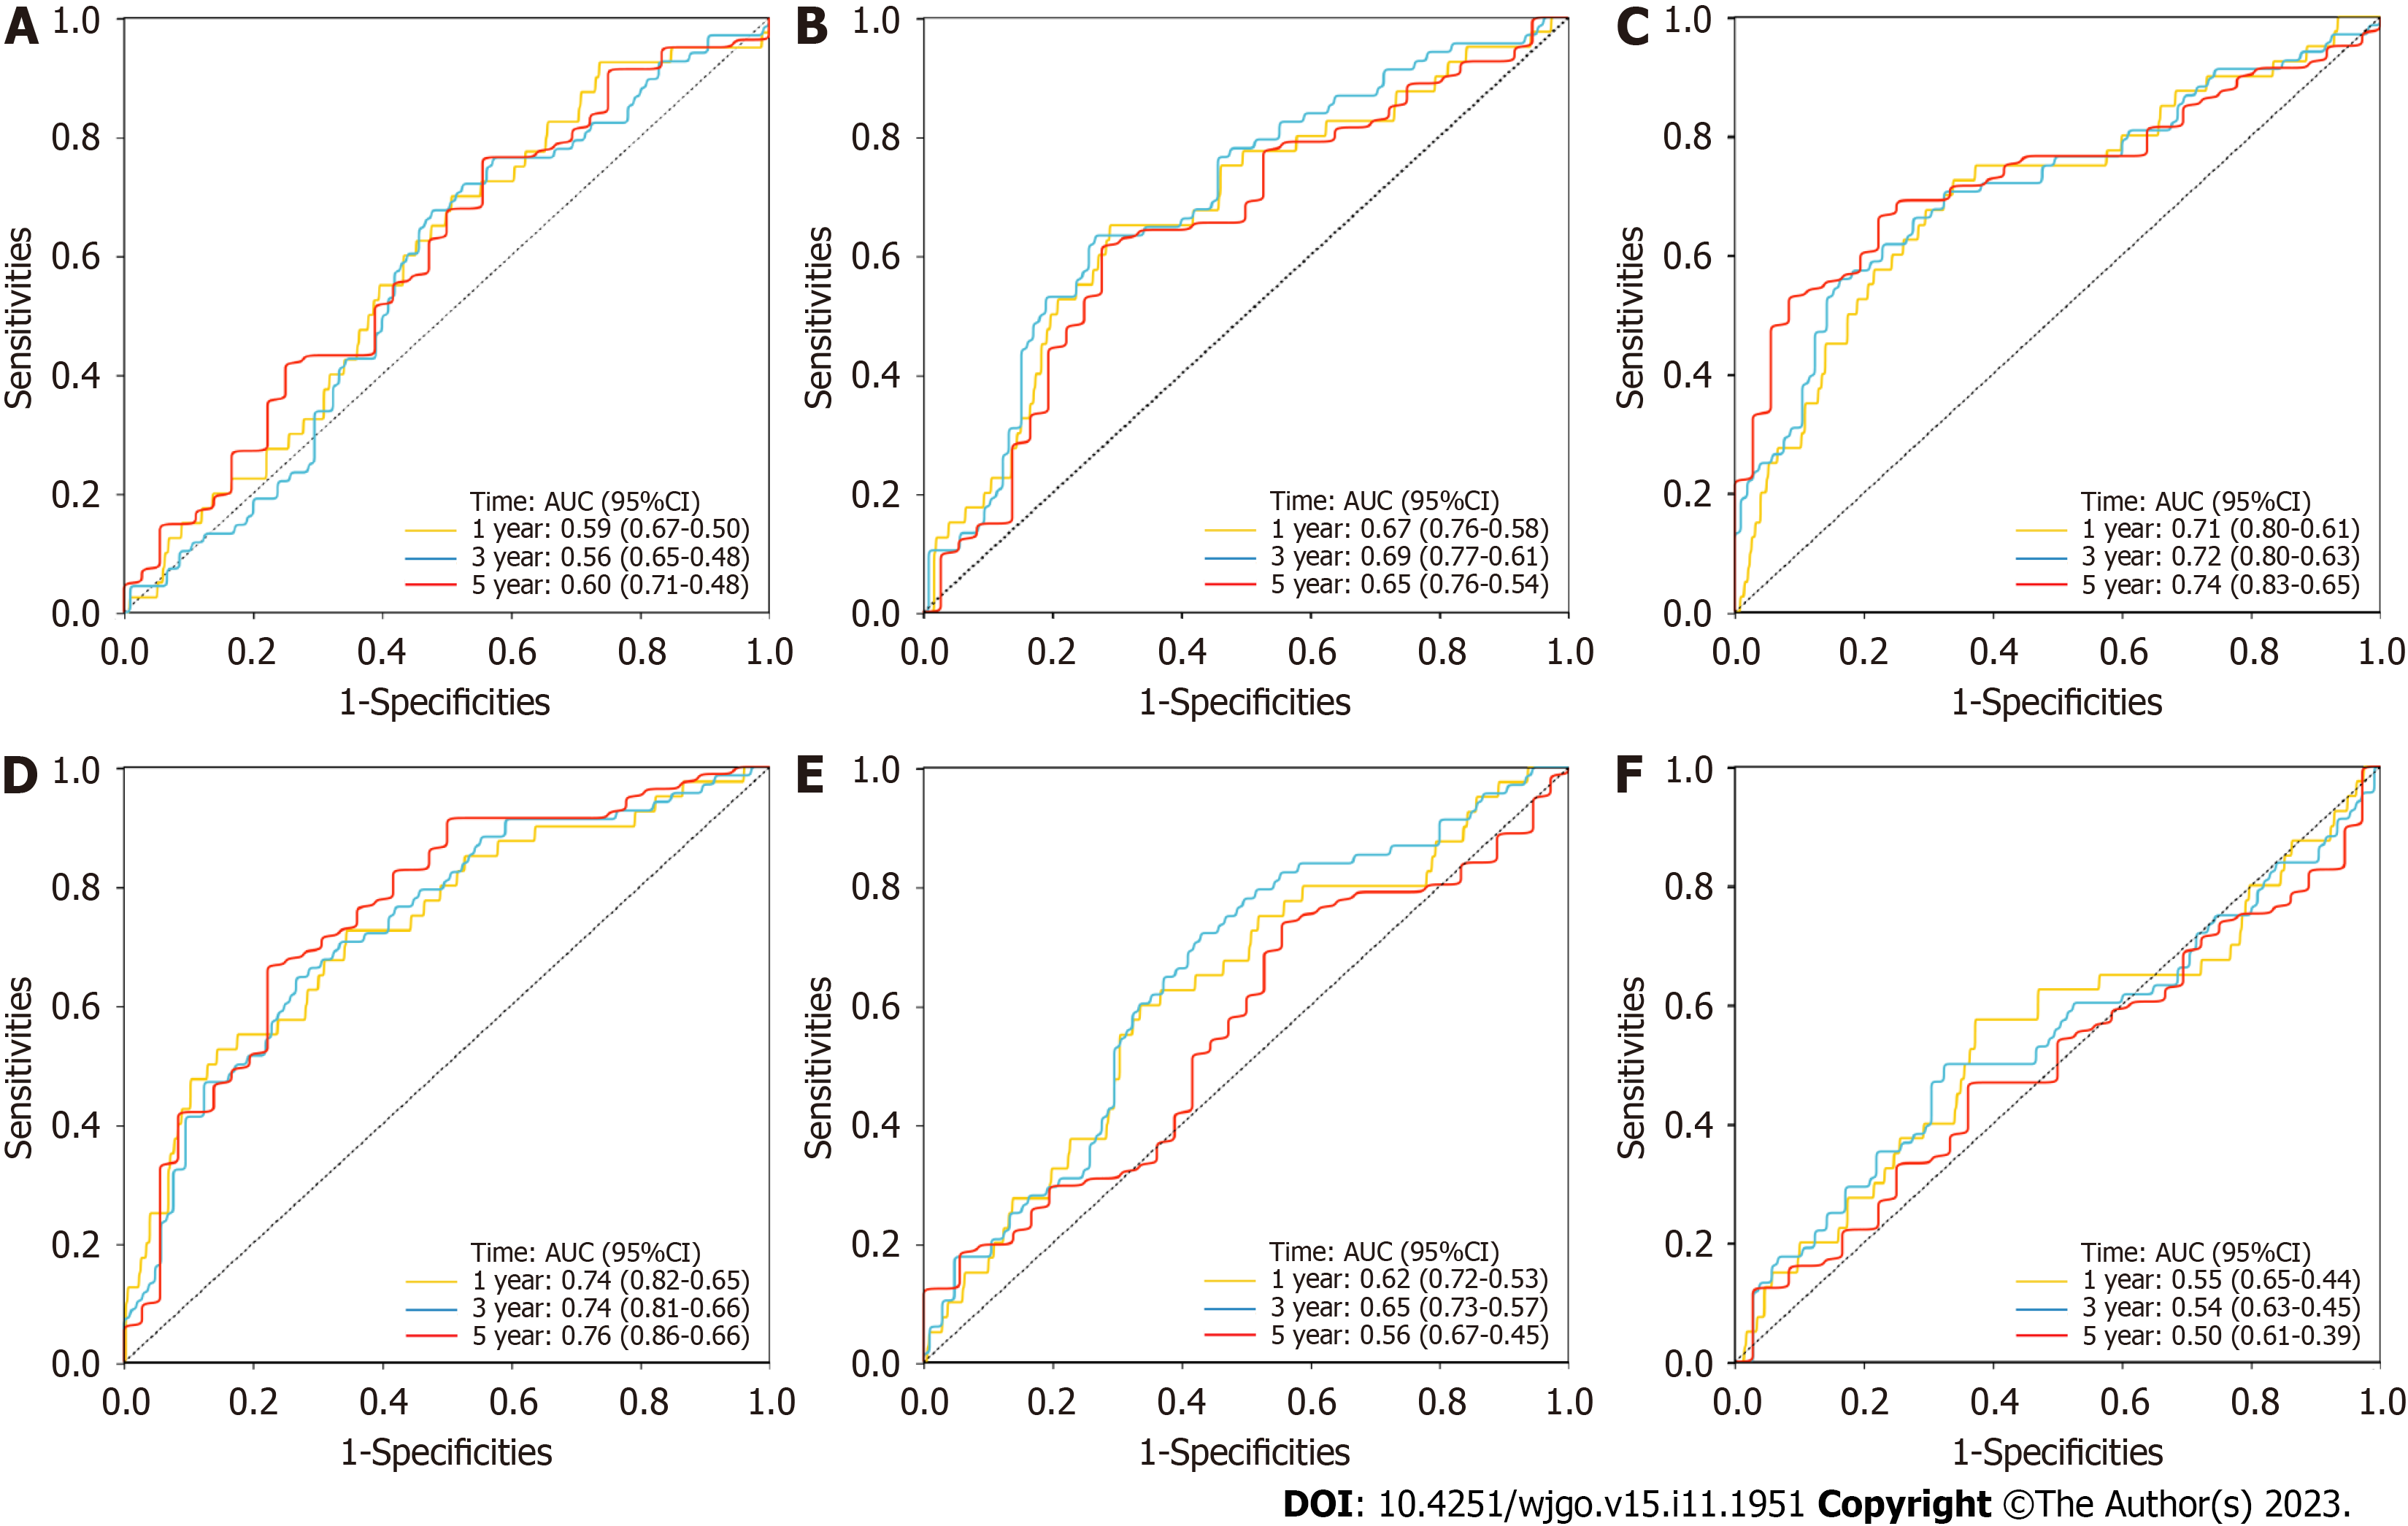
Figure 5 Comparison of the signature with other prognostic long noncoding RNAs signatures for colorectal cancer.
A: The areas under the receiver operating characteristic curve (AUCs) for 1-, 3- and 5-year overall survival for the immune-related long noncoding RNA (lncRNA) signature; B: The AUCs for the N6-methyladenosine-related lncRNA signature; C: The AUCs for the autophagy-related lncRNA signature; D: The AUCs for the fatty acid metabolism-related lncRNA signature; E: The AUCs for the epithelial-mesenchymal transition-related lncRNA signature; F: The AUCs for the tumor mutational burden-related lncRNA signature. 95%CI: 95% confidence interval; AUC: Areas under the receiver operating characteristic curve.
Figure 6 Assessment of the signature in the clinical colorectal cancer cohort and the relationships between the 8 long noncoding RNAs and clinicopathological characteristics.
A: The areas under the receiver operating characteristic curve (AUCs) for 1-, 2- and 3-year overall survival (OS) determined with the clinical data of colorectal cancer (CRC) patients; B: The AUCs for the risk score (RS) of 1-year OS and for clinicopathologic characteristics; C: The Kaplan-Meier survival curves for the OS of the high- and low-risk groups, which were defined by the median RS as the cutoff; D to G The relationships between the 8 long noncoding RNAs (lncRNAs) and clinicopathological characteristics in the The Cancer Genome Atlas-CRC cohort. H to K: The relationships between the 8 lncRNAs and clinicopathological characteristics in the clinical CRC cohort. AUC: Areas under the receiver operating characteristic curve; LncRNA: Long noncoding RNA.
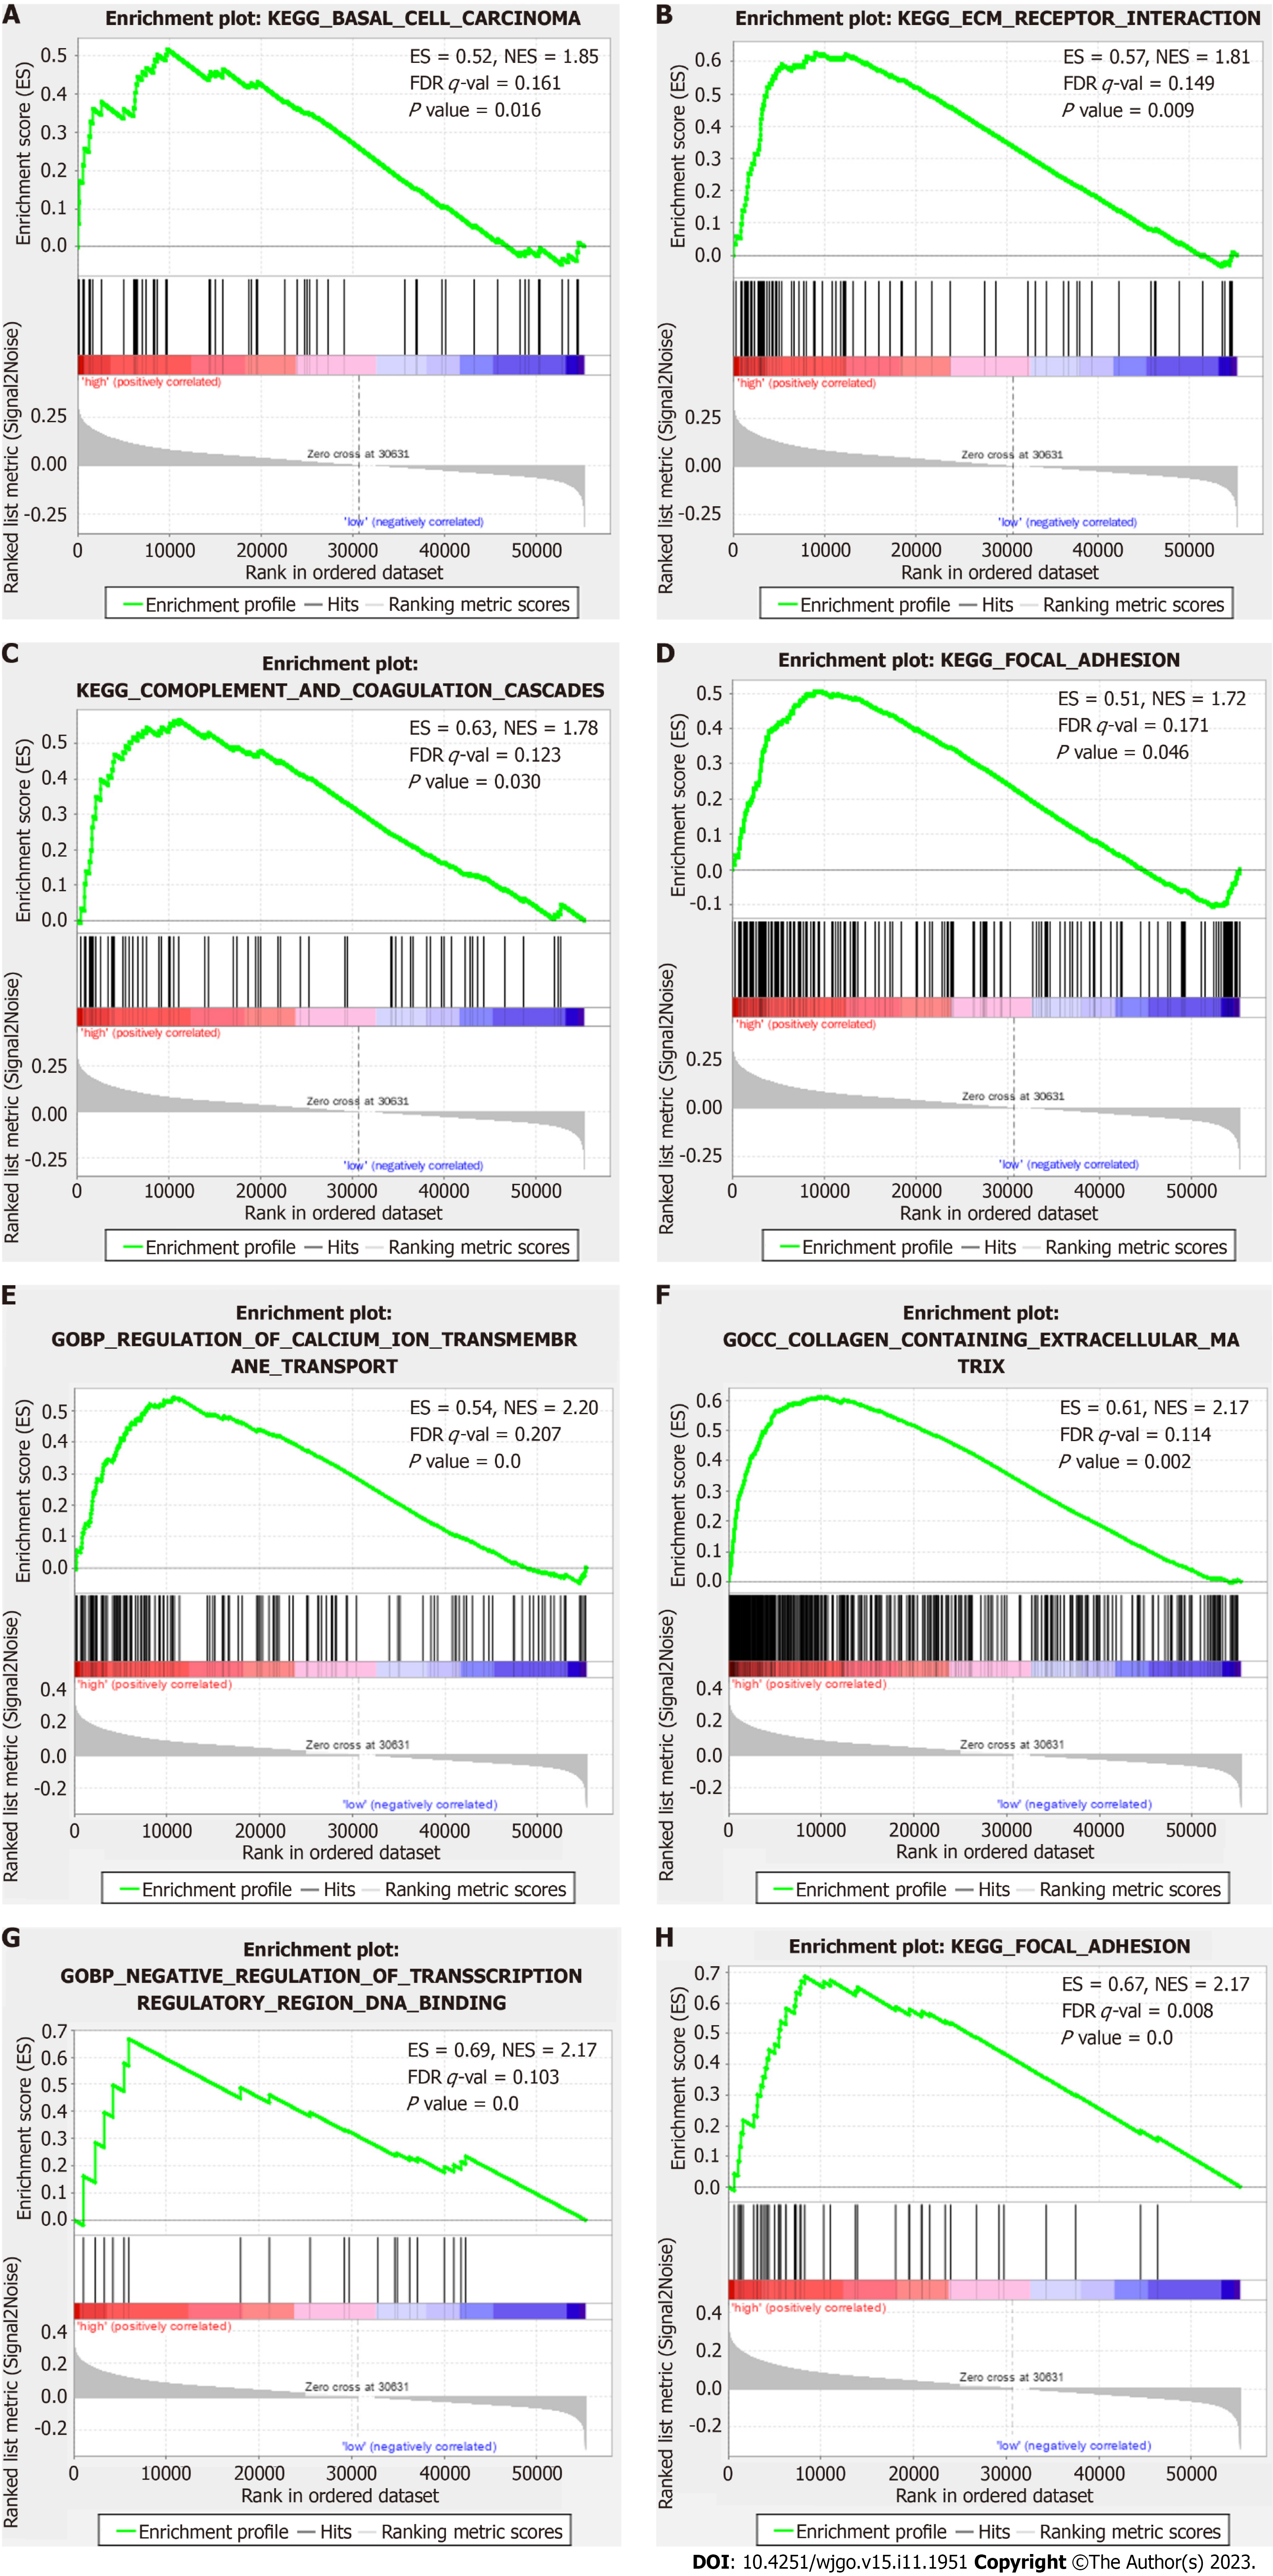
Figure 7 Gene Set Enrichment Analysis results.
A to D: The main enriched Kyoto Encyclopedia of Genes and Genome (KEGG) terms in the high-risk group included “basal cell carcinoma” (A), “complement and coagulation cascades” (B), “extracellular matrix (ECM) receptor interaction” (C), and “focal adhesion” (D); E to H: The main enriched KEGG terms in the low-risk group included “regulation of calcium ion transmembrane transport” (E), “collagen containing ECM” (F), “ciliarytip” (G), and “negative regulation of transcription regulatory region DNA binding” (H). FDR: False discovery rate; ES: Enrichment score; KEGG: Kyoto Encyclopedia of Genes and Genome; NES: Normalized enrichment score.
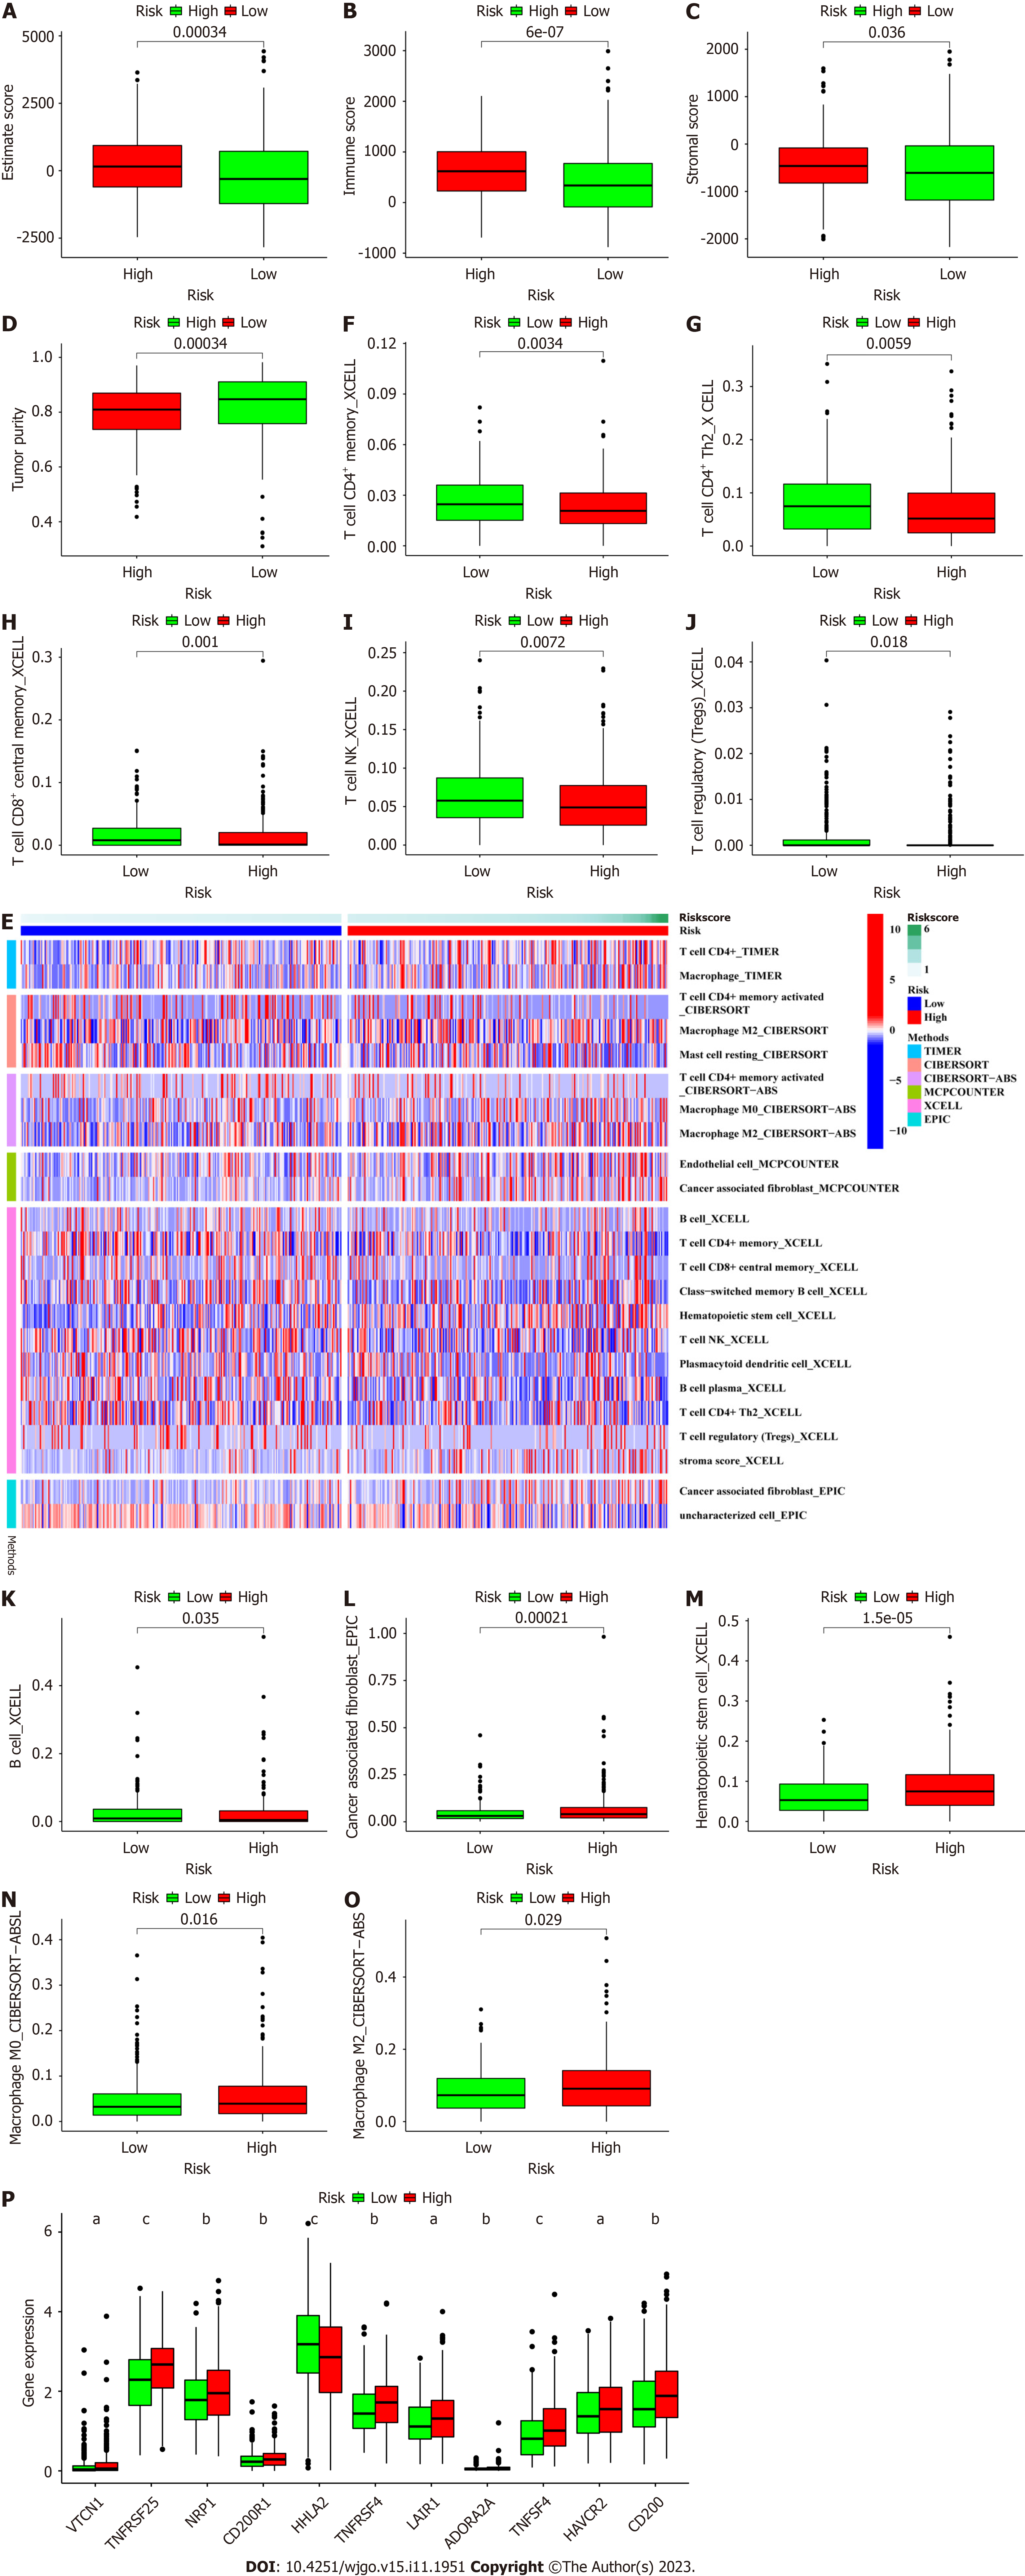
Figure 8 Investigation of the tumor microenvironment.
A: Comparison of ESTIMATE scores between the low- and high-risk groups; B: Comparison of immune scores between the low- and high-risk groups; C: Comparison of stomal scores between the low- and high-risk groups; D: Comparison of tumor purity between the low- and high-risk groups; E: Heatmap of immune cell infiltration showing that more immune cells were associated with the high-risk group on different platforms; F to K: More significantly reduced numbers of antitumor immune cells in the tumor microenvironment (TME) in the high-risk group; L to O: More significantly increased numbers of protumor immune cells in the TME in the high-risk group; P: Differences in the expression of 11 checkpoint molecules between the high- and low-risk groups. aP < 0.01, bP < 0.05, cP < 0.001. CD: Cluster of differentiation.
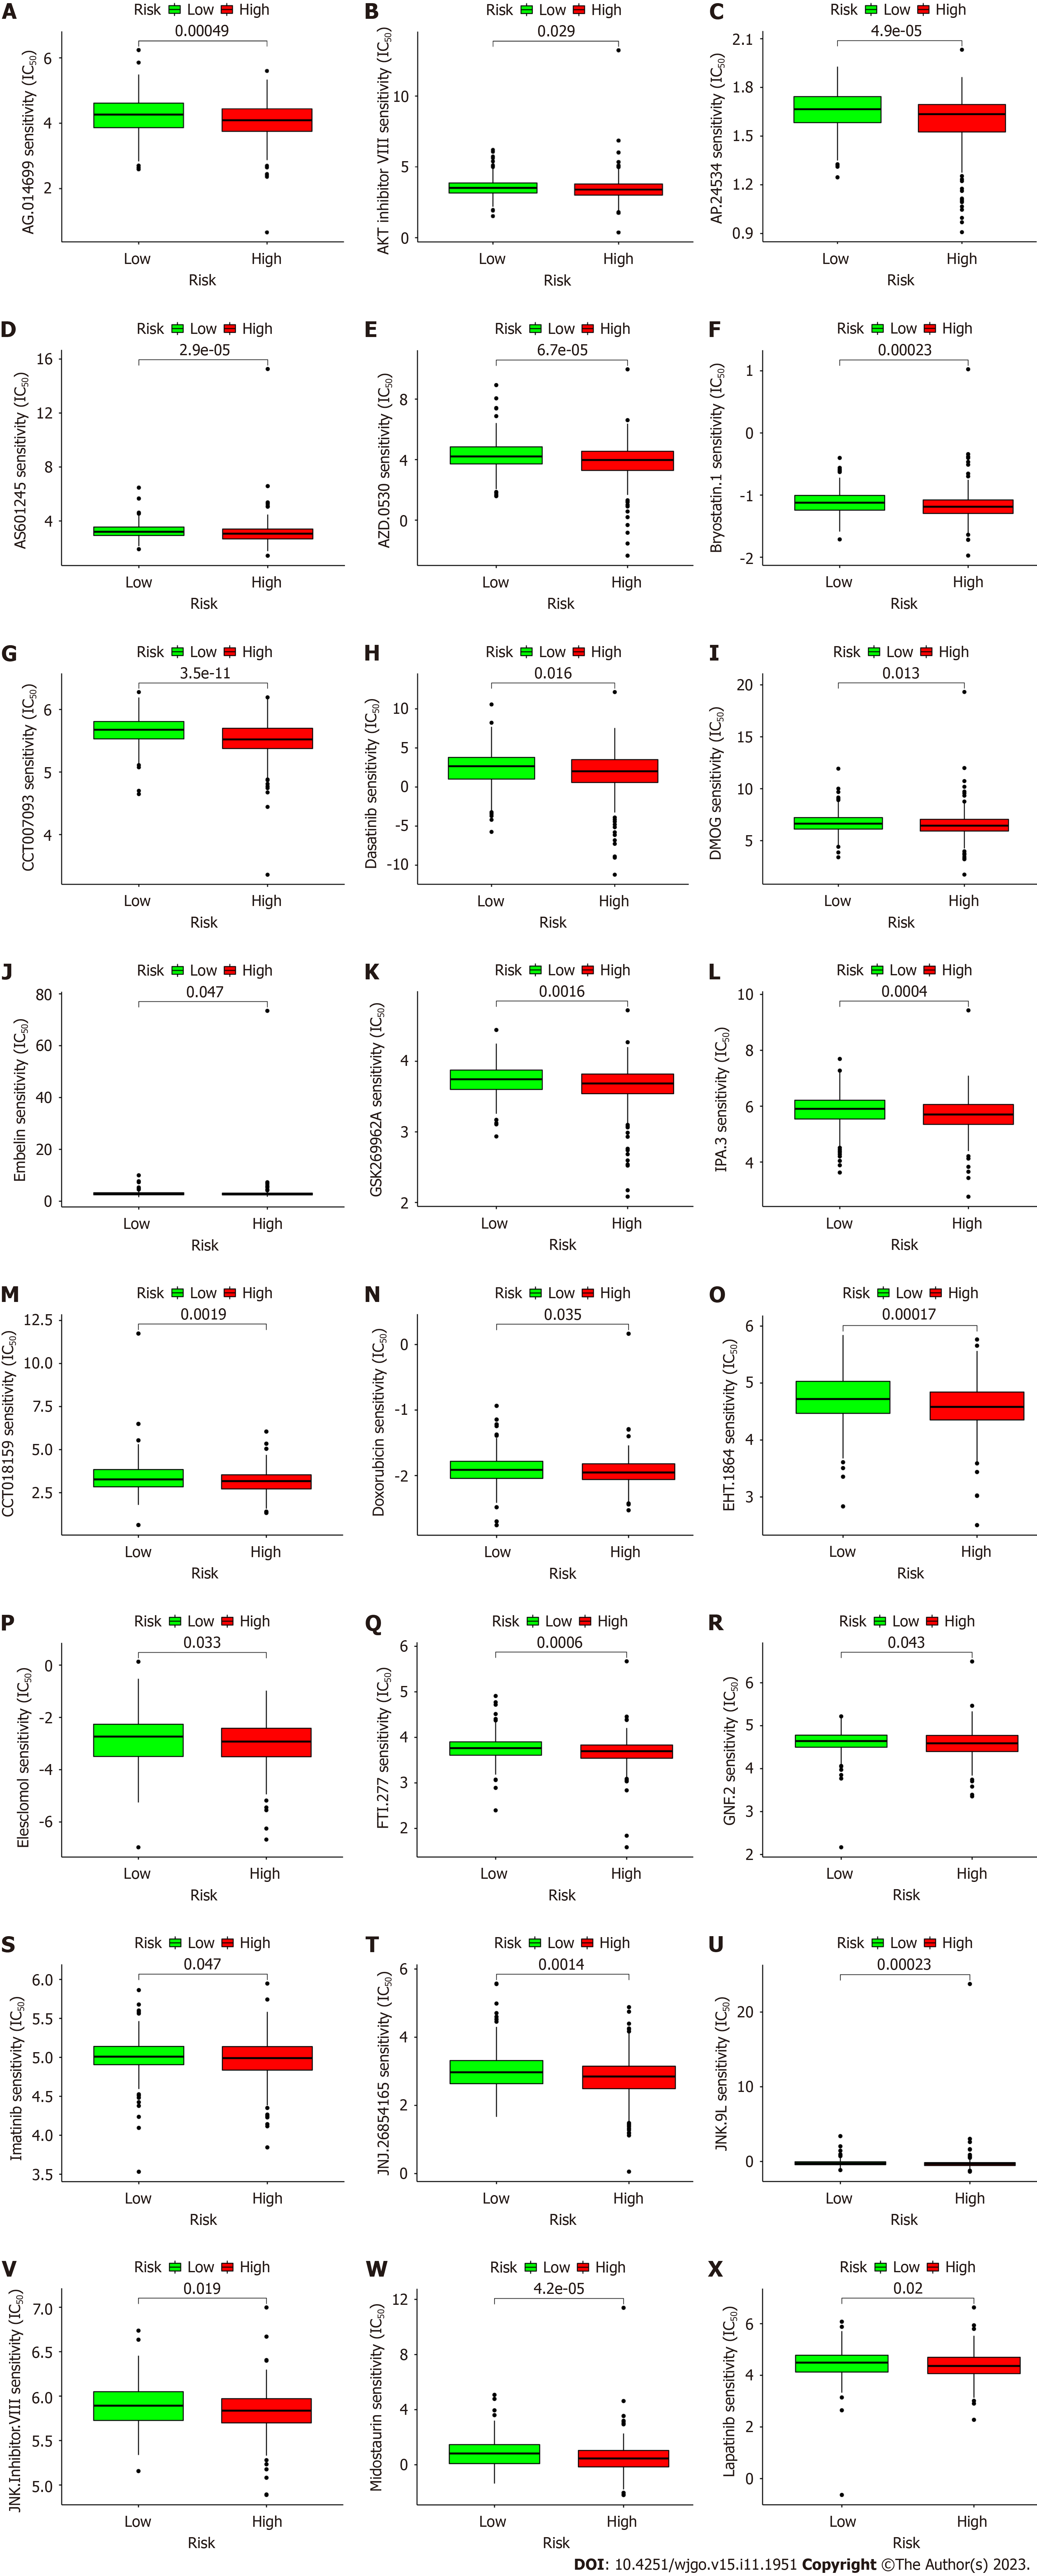
Figure 9 Anticancer drug prediction for the risk groups.
A to L: Potential drugs for effective antitumor immunotherapy in the high-risk group; M to X: Potential drugs for effective antitumor chemotherapy in the high-risk group. IC50: Half-maximal inhibitory concentration.
- Citation: Chen ZH, Lin YL, Chen SQ, Yang XY. Identification of necroptosis-related lncRNAs for prognosis prediction and screening of potential drugs in patients with colorectal cancer. World J Gastrointest Oncol 2023; 15(11): 1951-1973
- URL: https://www.wjgnet.com/1948-5204/full/v15/i11/1951.htm
- DOI: https://dx.doi.org/10.4251/wjgo.v15.i11.1951


