Copyright
©The Author(s) 2023.
World J Gastrointest Oncol. Nov 15, 2023; 15(11): 1951-1973
Published online Nov 15, 2023. doi: 10.4251/wjgo.v15.i11.1951
Published online Nov 15, 2023. doi: 10.4251/wjgo.v15.i11.1951
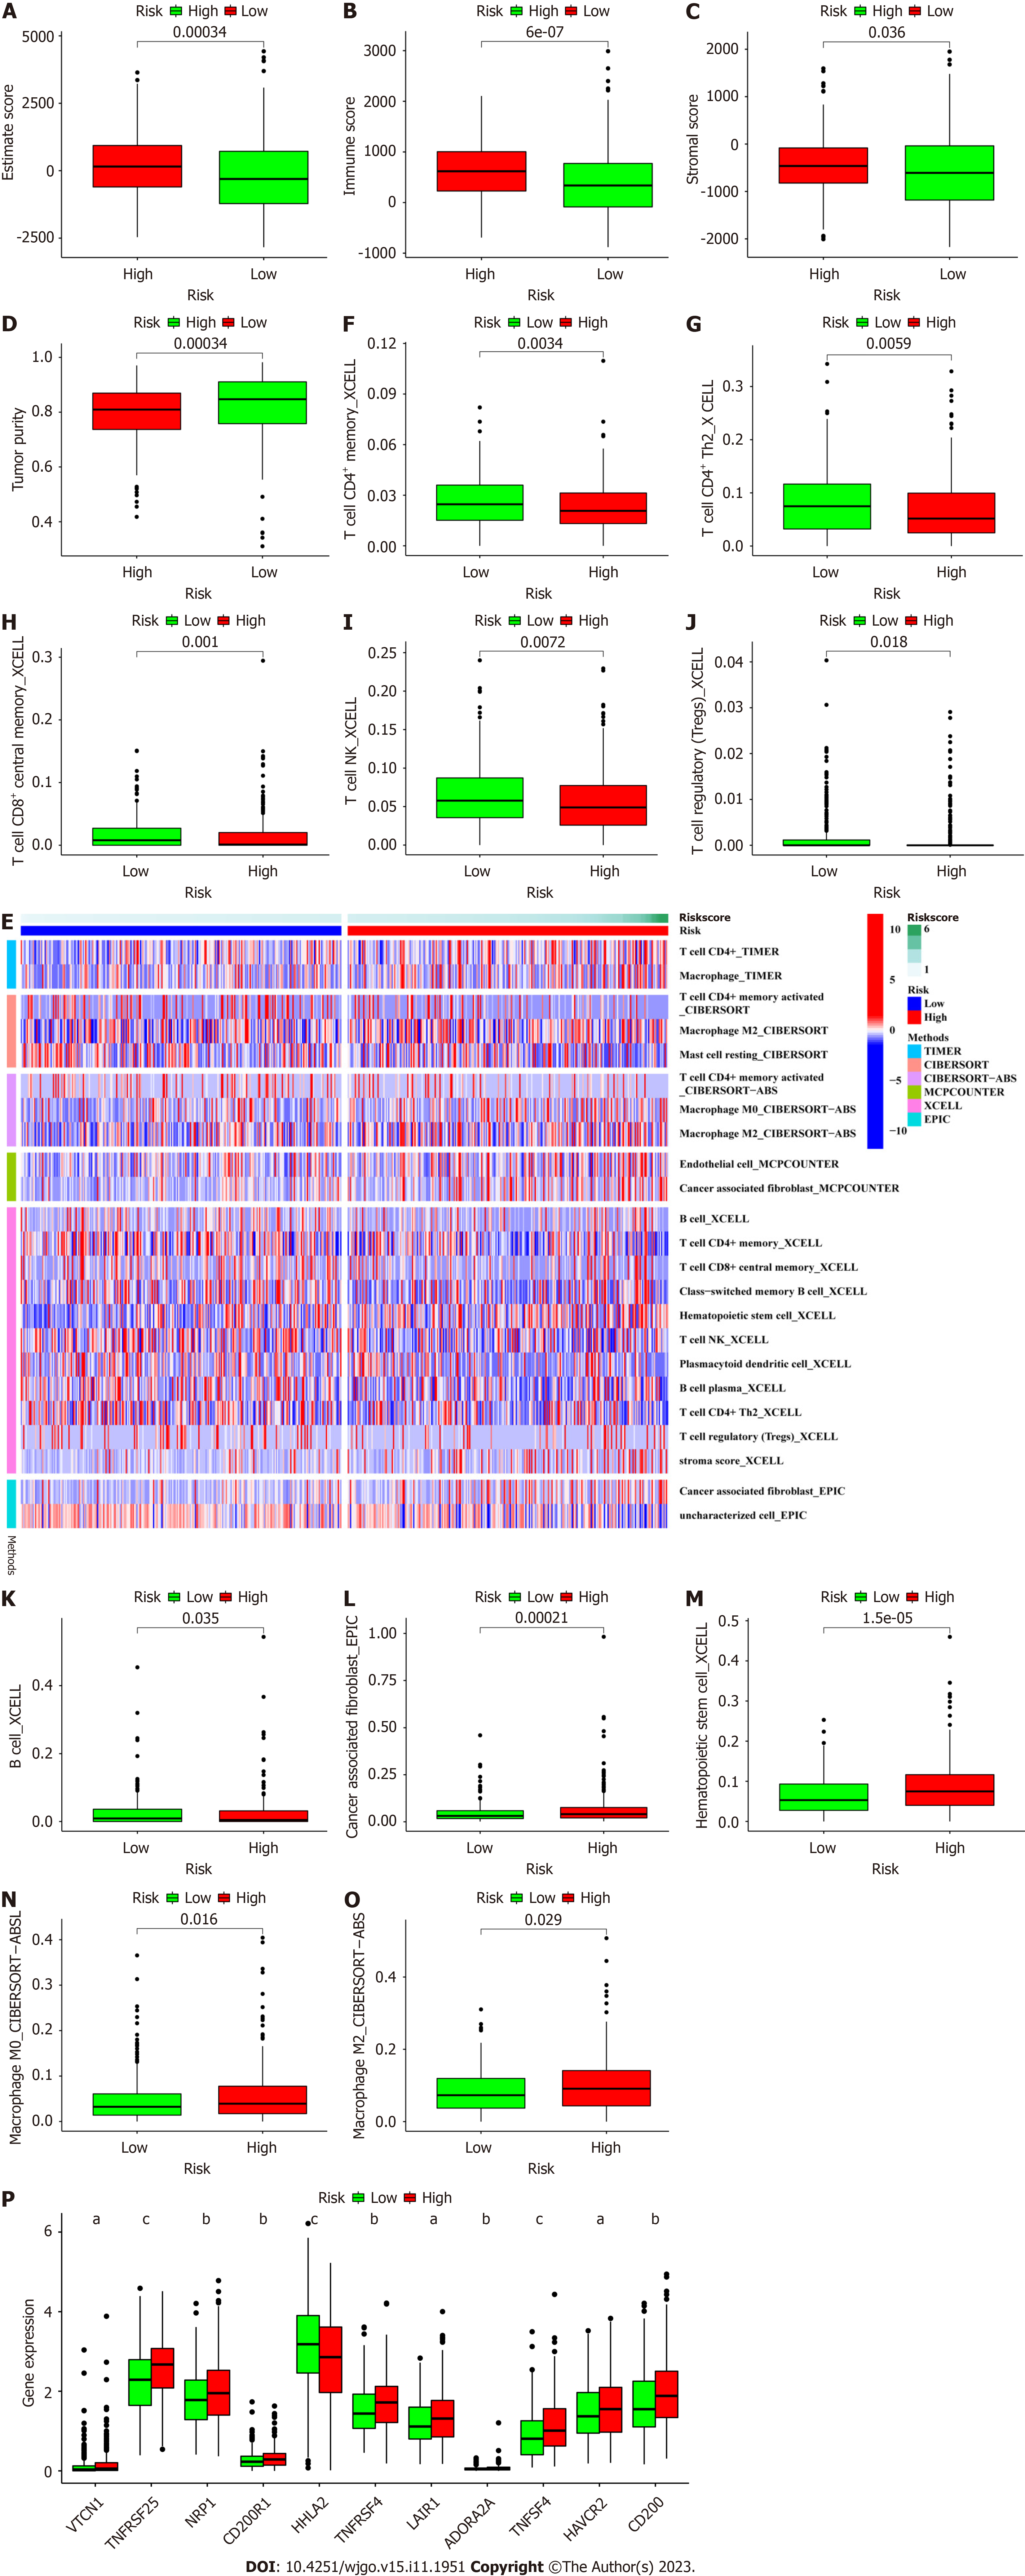
Figure 8 Investigation of the tumor microenvironment.
A: Comparison of ESTIMATE scores between the low- and high-risk groups; B: Comparison of immune scores between the low- and high-risk groups; C: Comparison of stomal scores between the low- and high-risk groups; D: Comparison of tumor purity between the low- and high-risk groups; E: Heatmap of immune cell infiltration showing that more immune cells were associated with the high-risk group on different platforms; F to K: More significantly reduced numbers of antitumor immune cells in the tumor microenvironment (TME) in the high-risk group; L to O: More significantly increased numbers of protumor immune cells in the TME in the high-risk group; P: Differences in the expression of 11 checkpoint molecules between the high- and low-risk groups. aP < 0.01, bP < 0.05, cP < 0.001. CD: Cluster of differentiation.
- Citation: Chen ZH, Lin YL, Chen SQ, Yang XY. Identification of necroptosis-related lncRNAs for prognosis prediction and screening of potential drugs in patients with colorectal cancer. World J Gastrointest Oncol 2023; 15(11): 1951-1973
- URL: https://www.wjgnet.com/1948-5204/full/v15/i11/1951.htm
- DOI: https://dx.doi.org/10.4251/wjgo.v15.i11.1951


