Copyright
©The Author(s) 2022.
World J Gastrointest Oncol. Jul 15, 2022; 14(7): 1252-1264
Published online Jul 15, 2022. doi: 10.4251/wjgo.v14.i7.1252
Published online Jul 15, 2022. doi: 10.4251/wjgo.v14.i7.1252
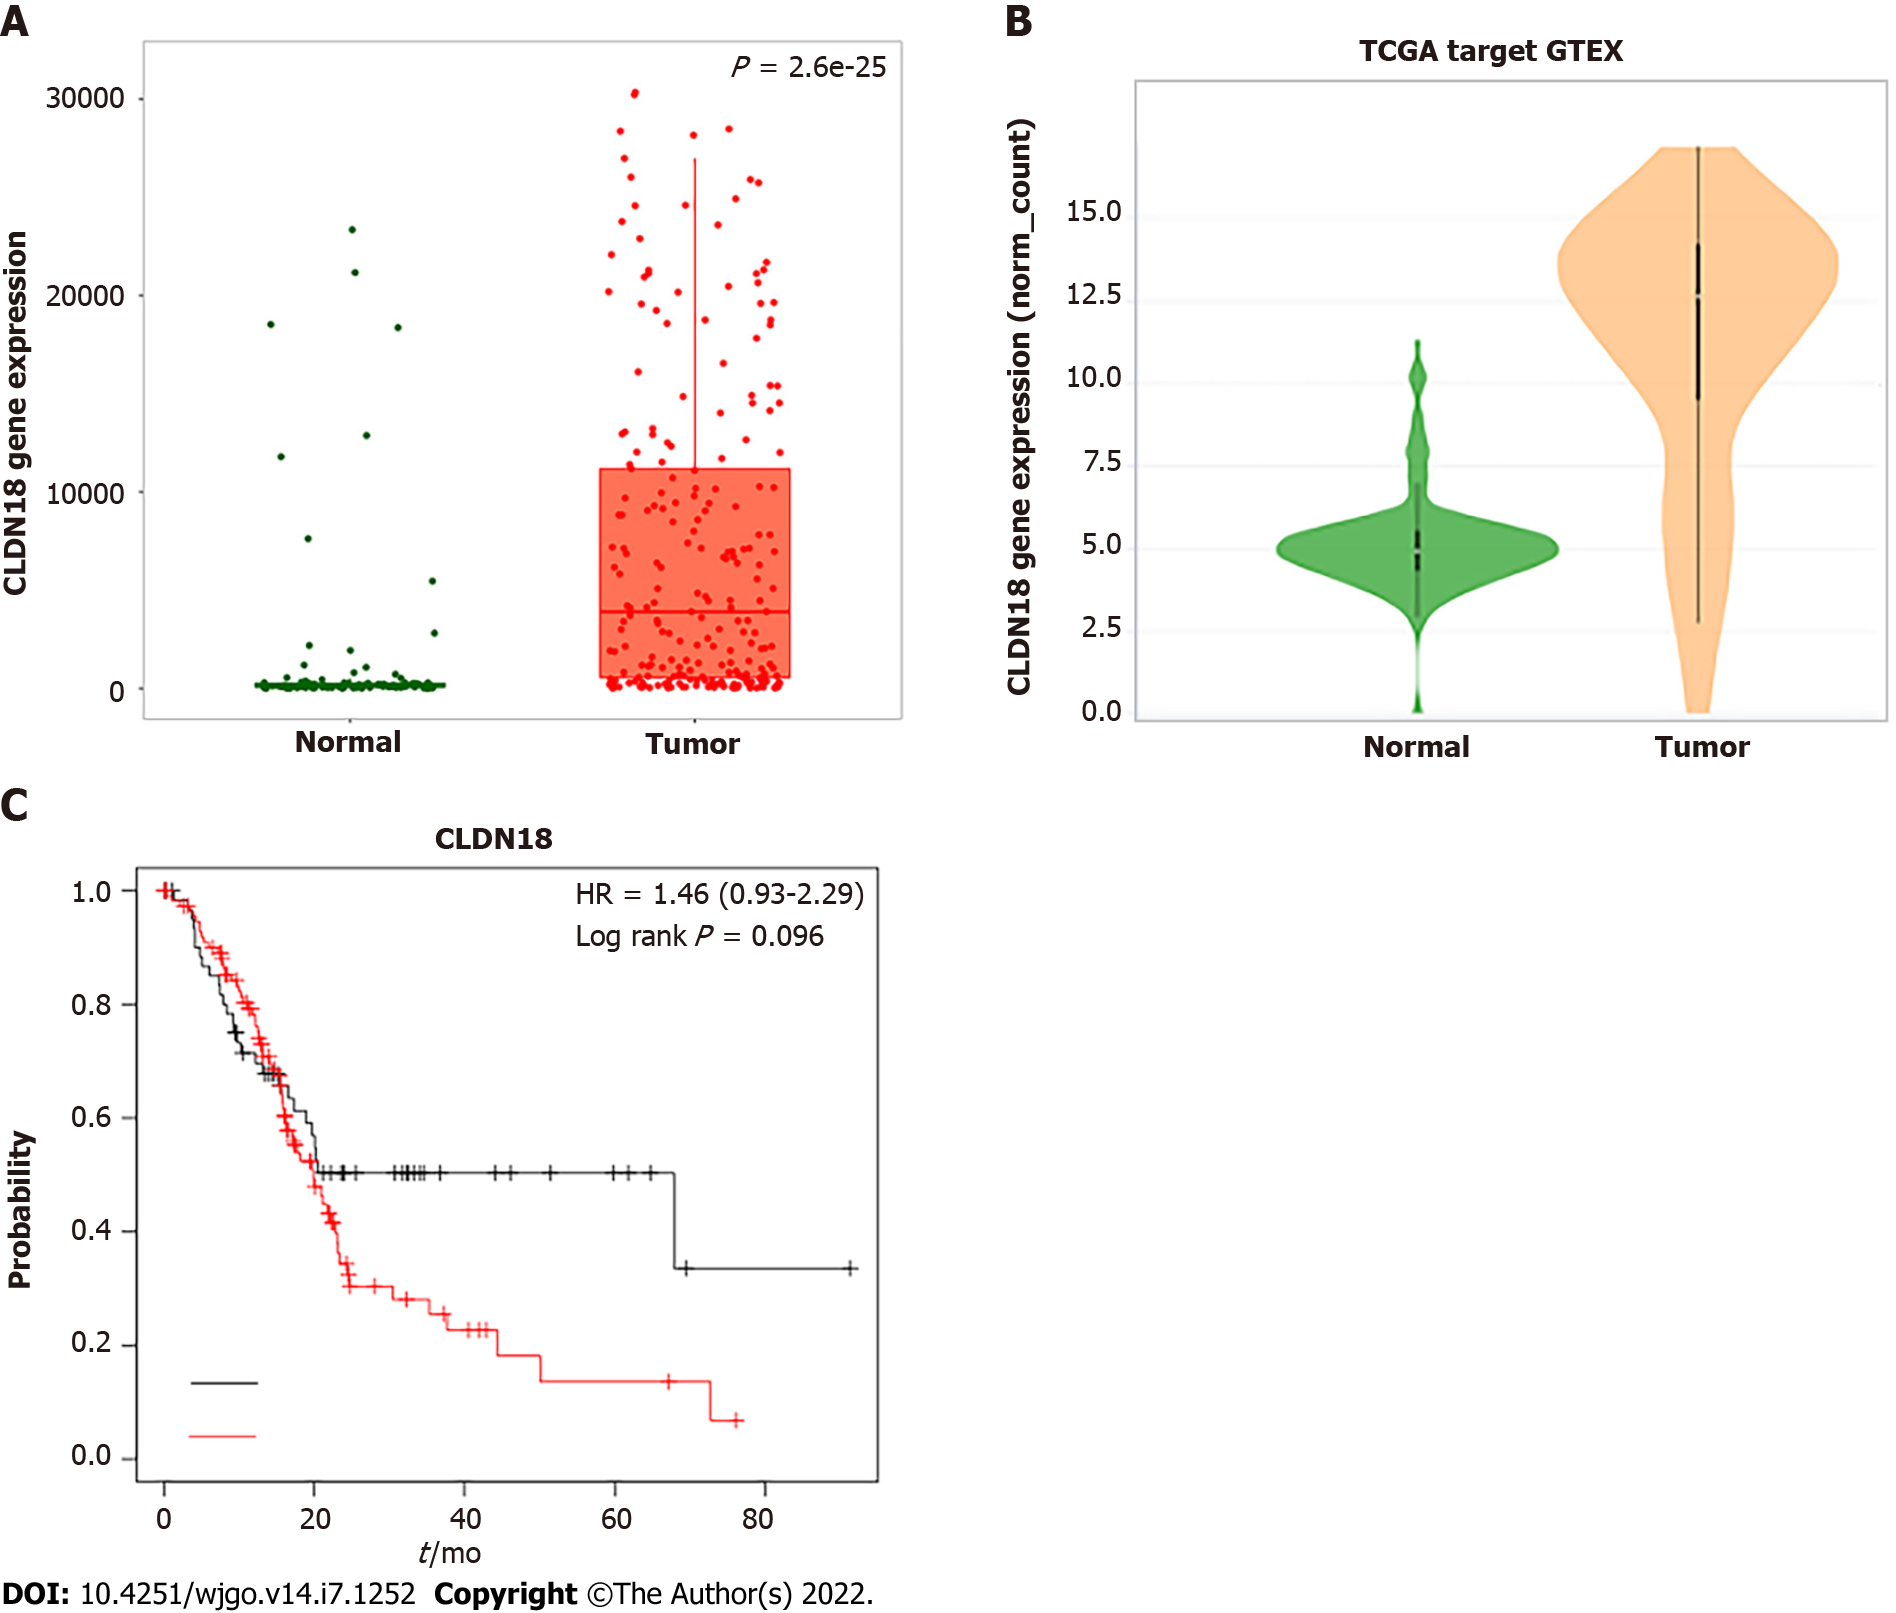
Figure 1 Online analysis of gene expression of claudin 18 and its effected survival in pancreatic cancer using the database.
A: Analysis of claudin18 expression in normal pancreatic tissue and pancreatic cancer using the TNMplot.com (https://tnmplot.com/analysis/) based on The Cancer Genome Atlas (TCGA), Genotype-Tissue Expression (GTEX), and Gene Expression Omnibus (GEO) databases; B: Analysis of claudin18 expression in normal pancreatic tissue and pancreatic cancer using Xena (http://xena.ucsc.edu/compare-tissue/) based on TCGA and GTEX databases; C: Assessment of the claudin18 effect on survival in pancreatic cancer using KM plotter (https://kmplot.com/analysis/) based on GEO, European Genome-phenome Archive, and TCGA databases. HR: Hazard ratio.
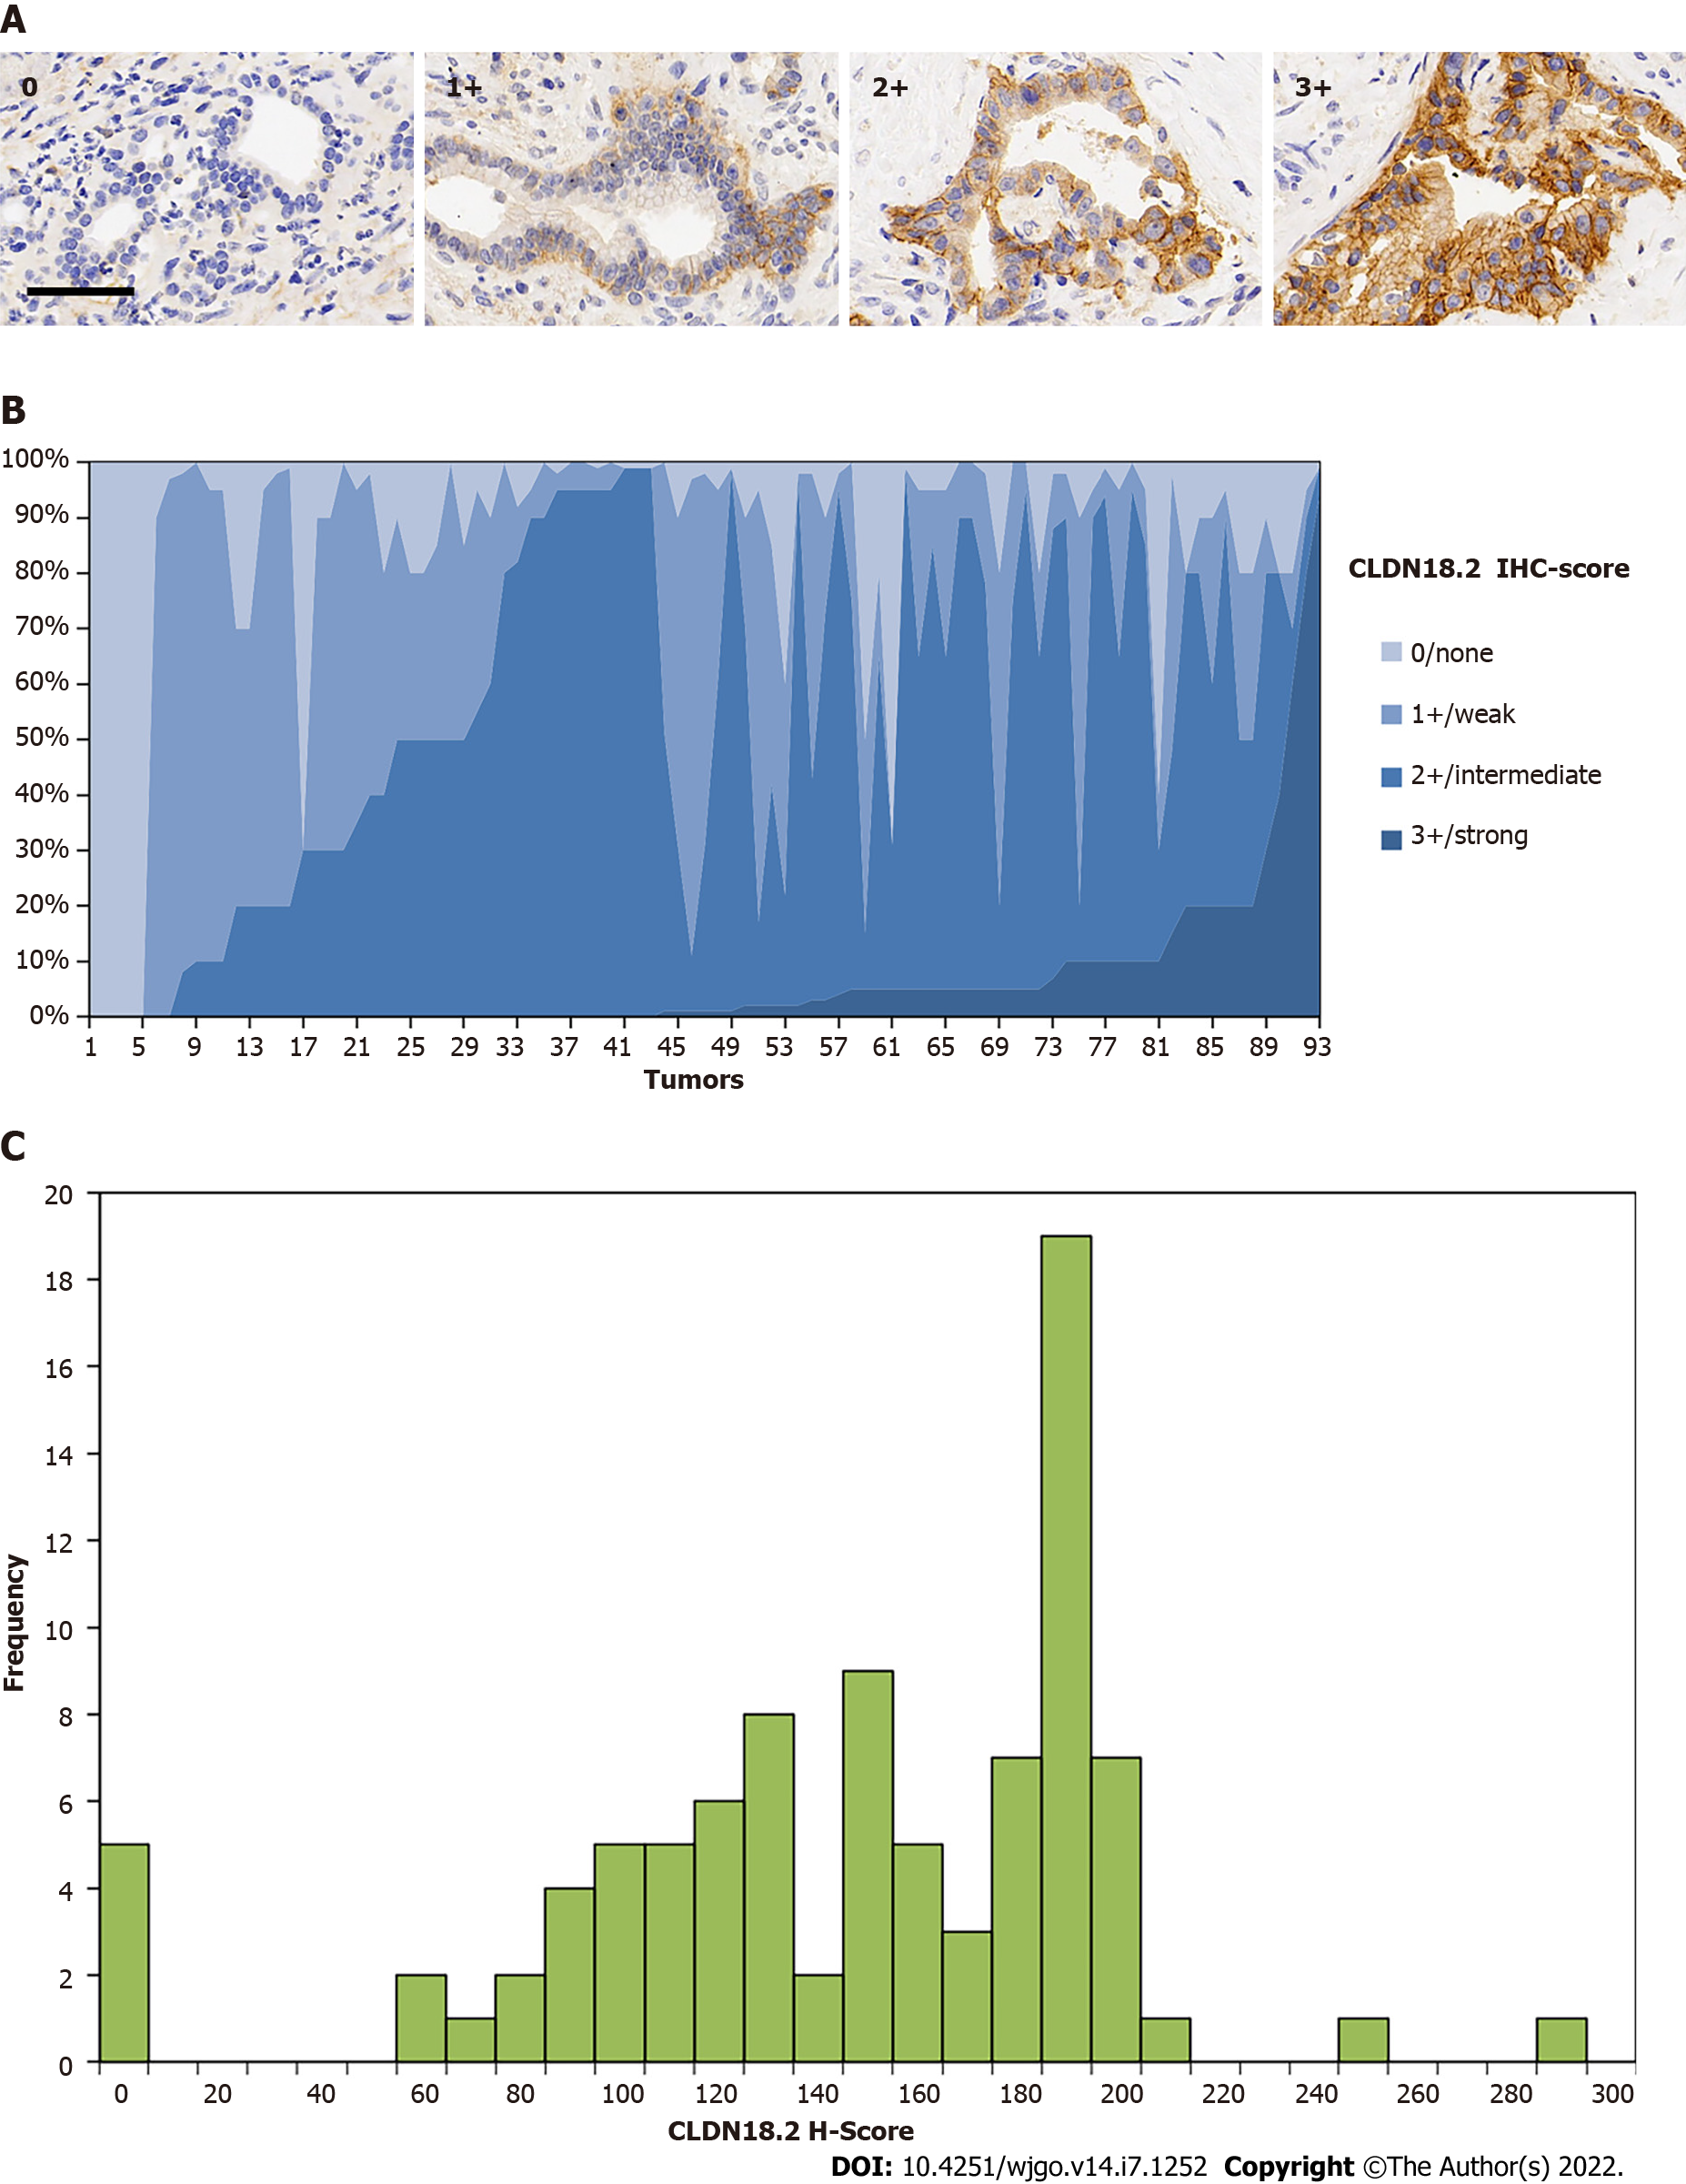
Figure 2 Expression of claudin 18.
2 in primary pancreatic ductal adenocarcinoma. A: Examples of claudin 18.2 (CLDN18.2)-positive pancreatic ductal adenocarcinoma tissues with 0/none, 1+/weak, 2+/intermediate, and 3+/ strong staining intensity. Scale bar 100 μm; B: Overall expression intensity of claudin 18.2. Eighty-eight (94.6%) primary pancreatic ductal adenocarcinoma tissues showed positivity for CLDN18.2 expression. In the positive cases, most showed compositive immunohistochemistry (IHC)-intensity. Fifty (56.8%) cases were scored up to IHC 3+, 86 (97.7%) cases were scored up to but no higher than IHC 2+, and 77 (87.5%) cases were no higher than IHC 1+; C: Histoscore (H-Score) distribution in the study. Minimum H-Score was 0; Maximum H-score was 292. Median H-score of positive tumors was 150.
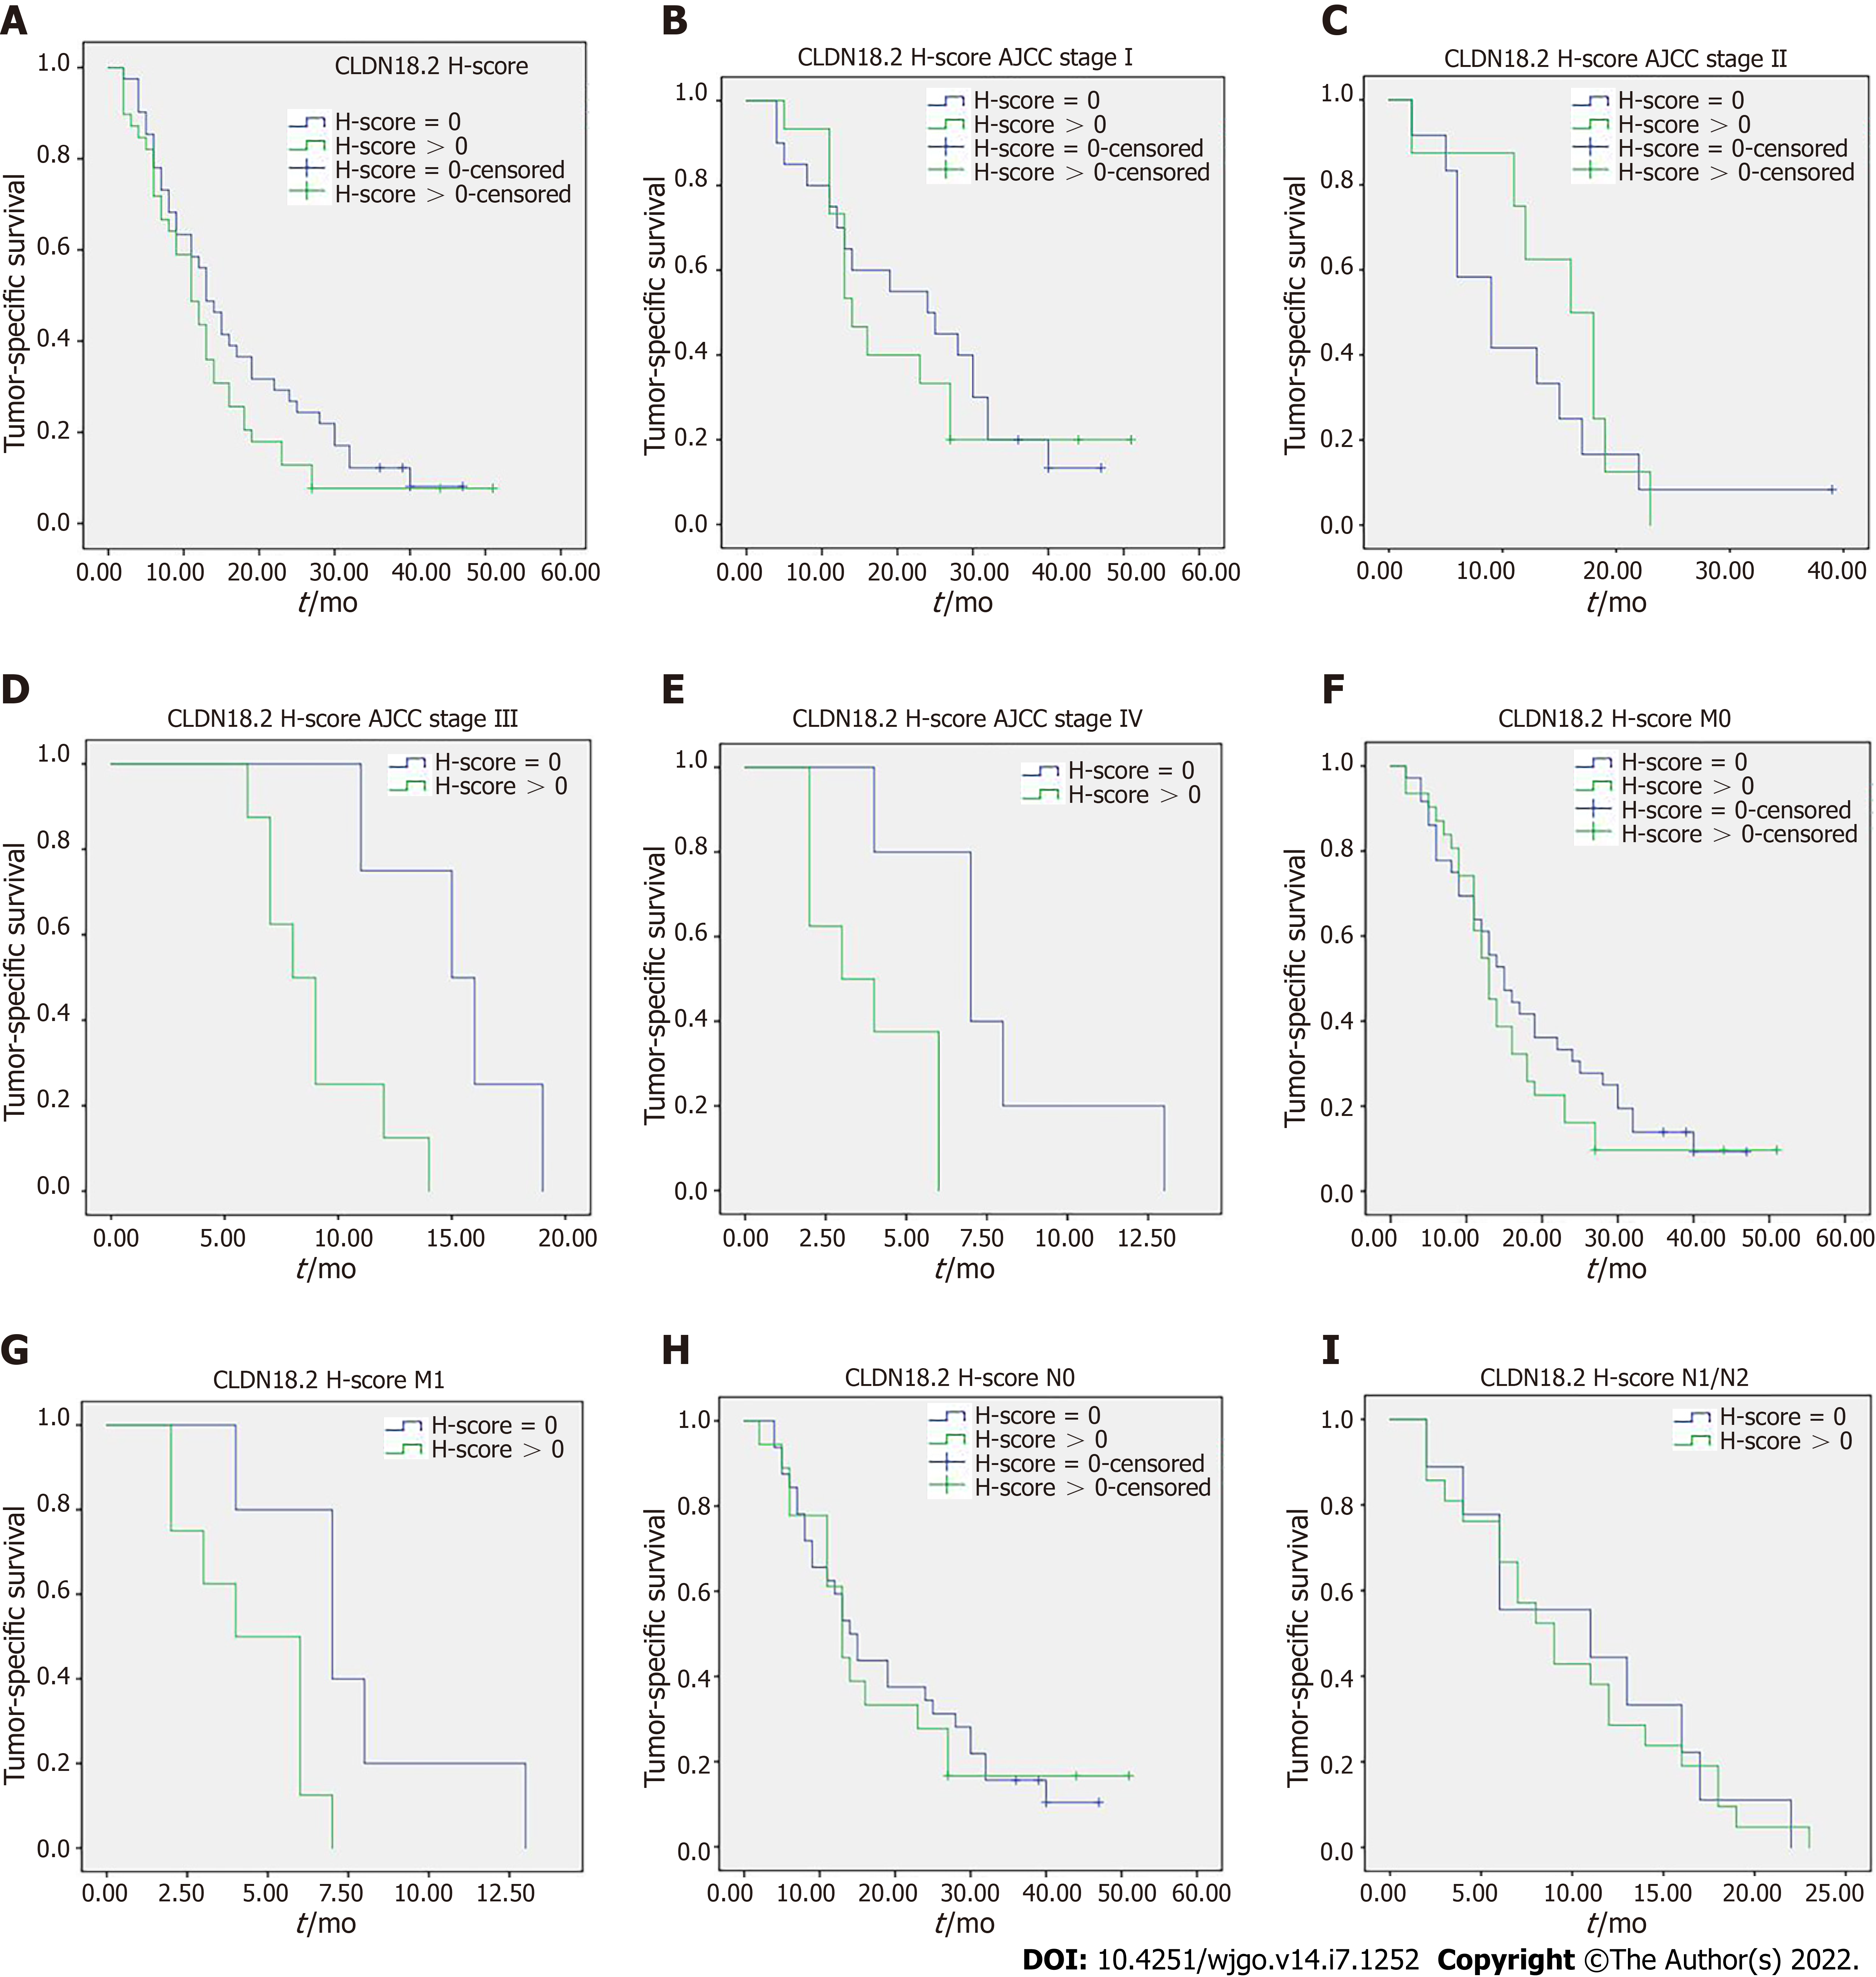
Figure 3 Claudin 18.
2 and survival. A: There was no significant correlation between tumor-specific survival and claudin 18.2 expression in tumor cells (41 vs 39 patients; median survival 13 mo vs 11 mo; P = 0.176); B: 20 vs 15 patients in stage I disease with median survival 24 mo vs 14 mo (P = 0.666); C: 12 vs 8 patients in stage II disease with median survival 9 mo vs 16 mo (P = 0.480); D: 4 vs 8 patients in stage III disease with median survival 15 mo vs 8 mo (P = 0.012); E: 5 vs 8 patients in stage IV disease with median survival 7 mo vs 3 mo (P = 0.009); F: 36 vs 31 patients in M0 disease with median survival 15 mo vs 13 mo (P = 0.351); G: 5 vs 8 patients in M1 disease with median survival 7 mo vs 4 mo (P = 0.024); H: 32 vs 18 patients in N0 disease with median survival 14 mo vs 13 mo (P = 0.825); I: 9 vs 21 patients in N1/N2 disease with median survival 11 mo vs 9 mo (P = 0.920). P values were obtained via log-rank-test. AJCC: American Joint Committee on Cancer; H-score: Histoscore.
- Citation: Wang X, Zhang CS, Dong XY, Hu Y, Duan BJ, Bai J, Wu YY, Fan L, Liao XH, Kang Y, Zhang P, Li MY, Xu J, Mao ZJ, Liu HT, Zhang XL, Tian LF, Li EX. Claudin 18.2 is a potential therapeutic target for zolbetuximab in pancreatic ductal adenocarcinoma. World J Gastrointest Oncol 2022; 14(7): 1252-1264
- URL: https://www.wjgnet.com/1948-5204/full/v14/i7/1252.htm
- DOI: https://dx.doi.org/10.4251/wjgo.v14.i7.1252


