Copyright
©The Author(s) 2021.
World J Gastrointest Oncol. Sep 15, 2021; 13(9): 1164-1183
Published online Sep 15, 2021. doi: 10.4251/wjgo.v13.i9.1164
Published online Sep 15, 2021. doi: 10.4251/wjgo.v13.i9.1164
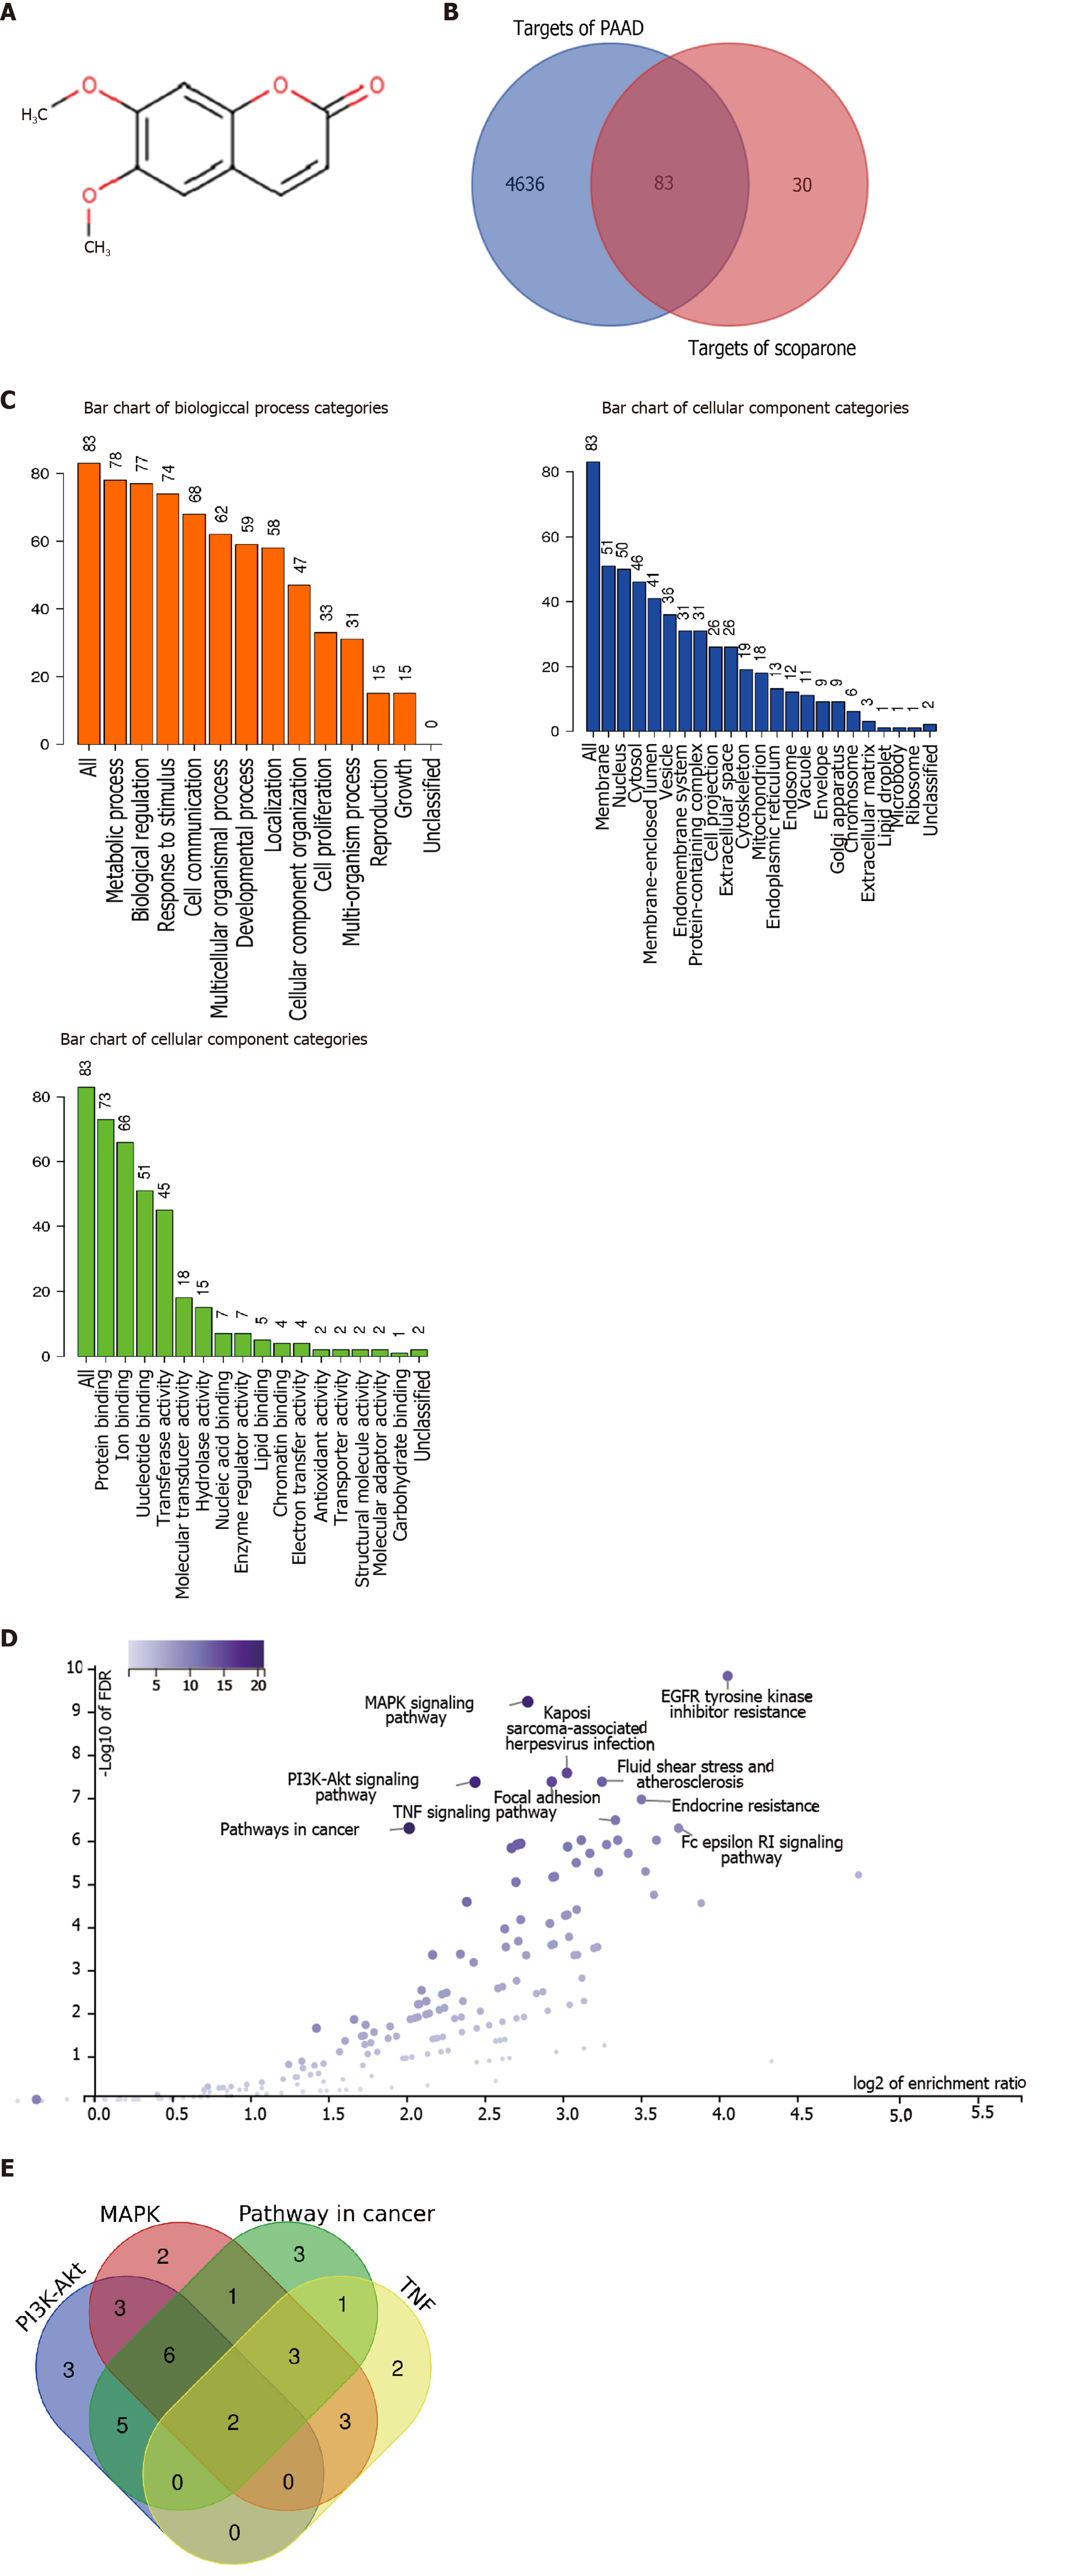
Figure 1 Target genes of scoparone in pancreatic cancer obtained by network bioinformatics analyses.
A: The two-dimensional structure of scoparone; B: A total of 83 overlapping therapeutic pancreatic cancer targets of scoparone; C: GO analysis of 83 predicted pancreatic cancer targets of scoparone through the WebGastalt database; D: KEGG analysis of 83 predicted pancreatic cancer targets of scoparone through the WebGastalt database; E: Overlapping targets in four enriched pathways identified by KEGG analysis.
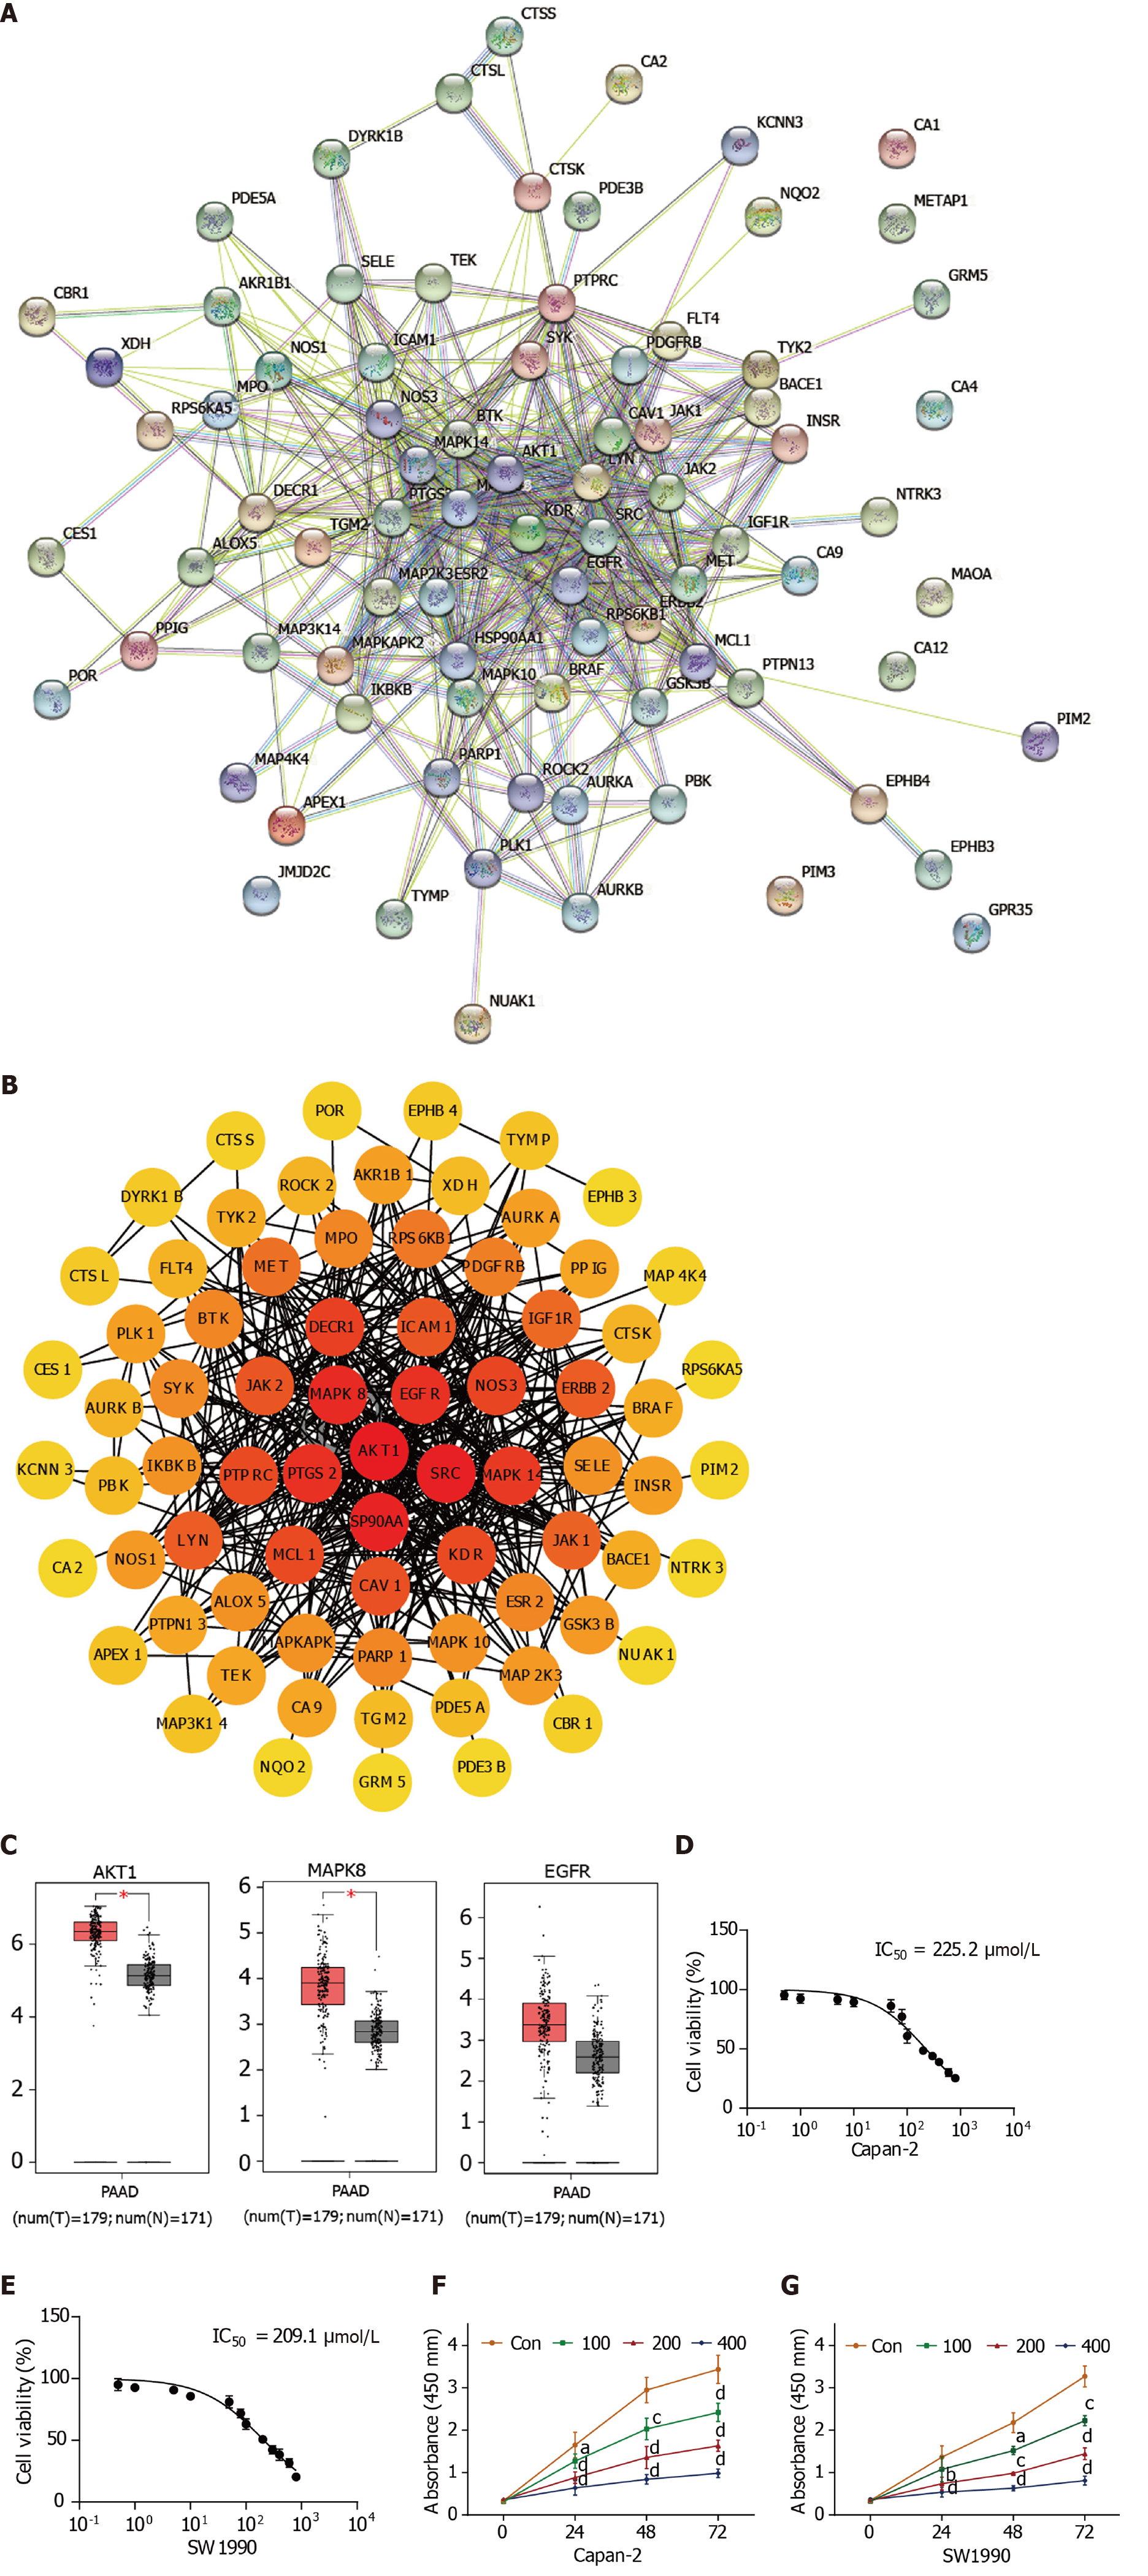
Figure 2 Protein-protein interaction network of the 83 predicted targets and scoparone inhibits proliferation.
A: Protein-protein interaction (PPI) network of the 83 predicted targets through STRING; B: Visualized PPI network of the 83 predicted targets through Cytoscape 3.7.2. Darker nodes indicate higher degree value; C: Expression patterns of the following candidate hub genes: AKT1, MAPK8, and EGFR; the red represents the tumor group and the gray represents the normal group; D and E: IC50 values of scoparone for Capan-2 and SW1990 cells shown by CCK-8 assay; F and G: Scoparone inhibits the proliferation of Capan-2 and SW1990 cells. aP < 0.05, bP < 0.01, cP < 0.001, dP < 0.0001 vs the control group.
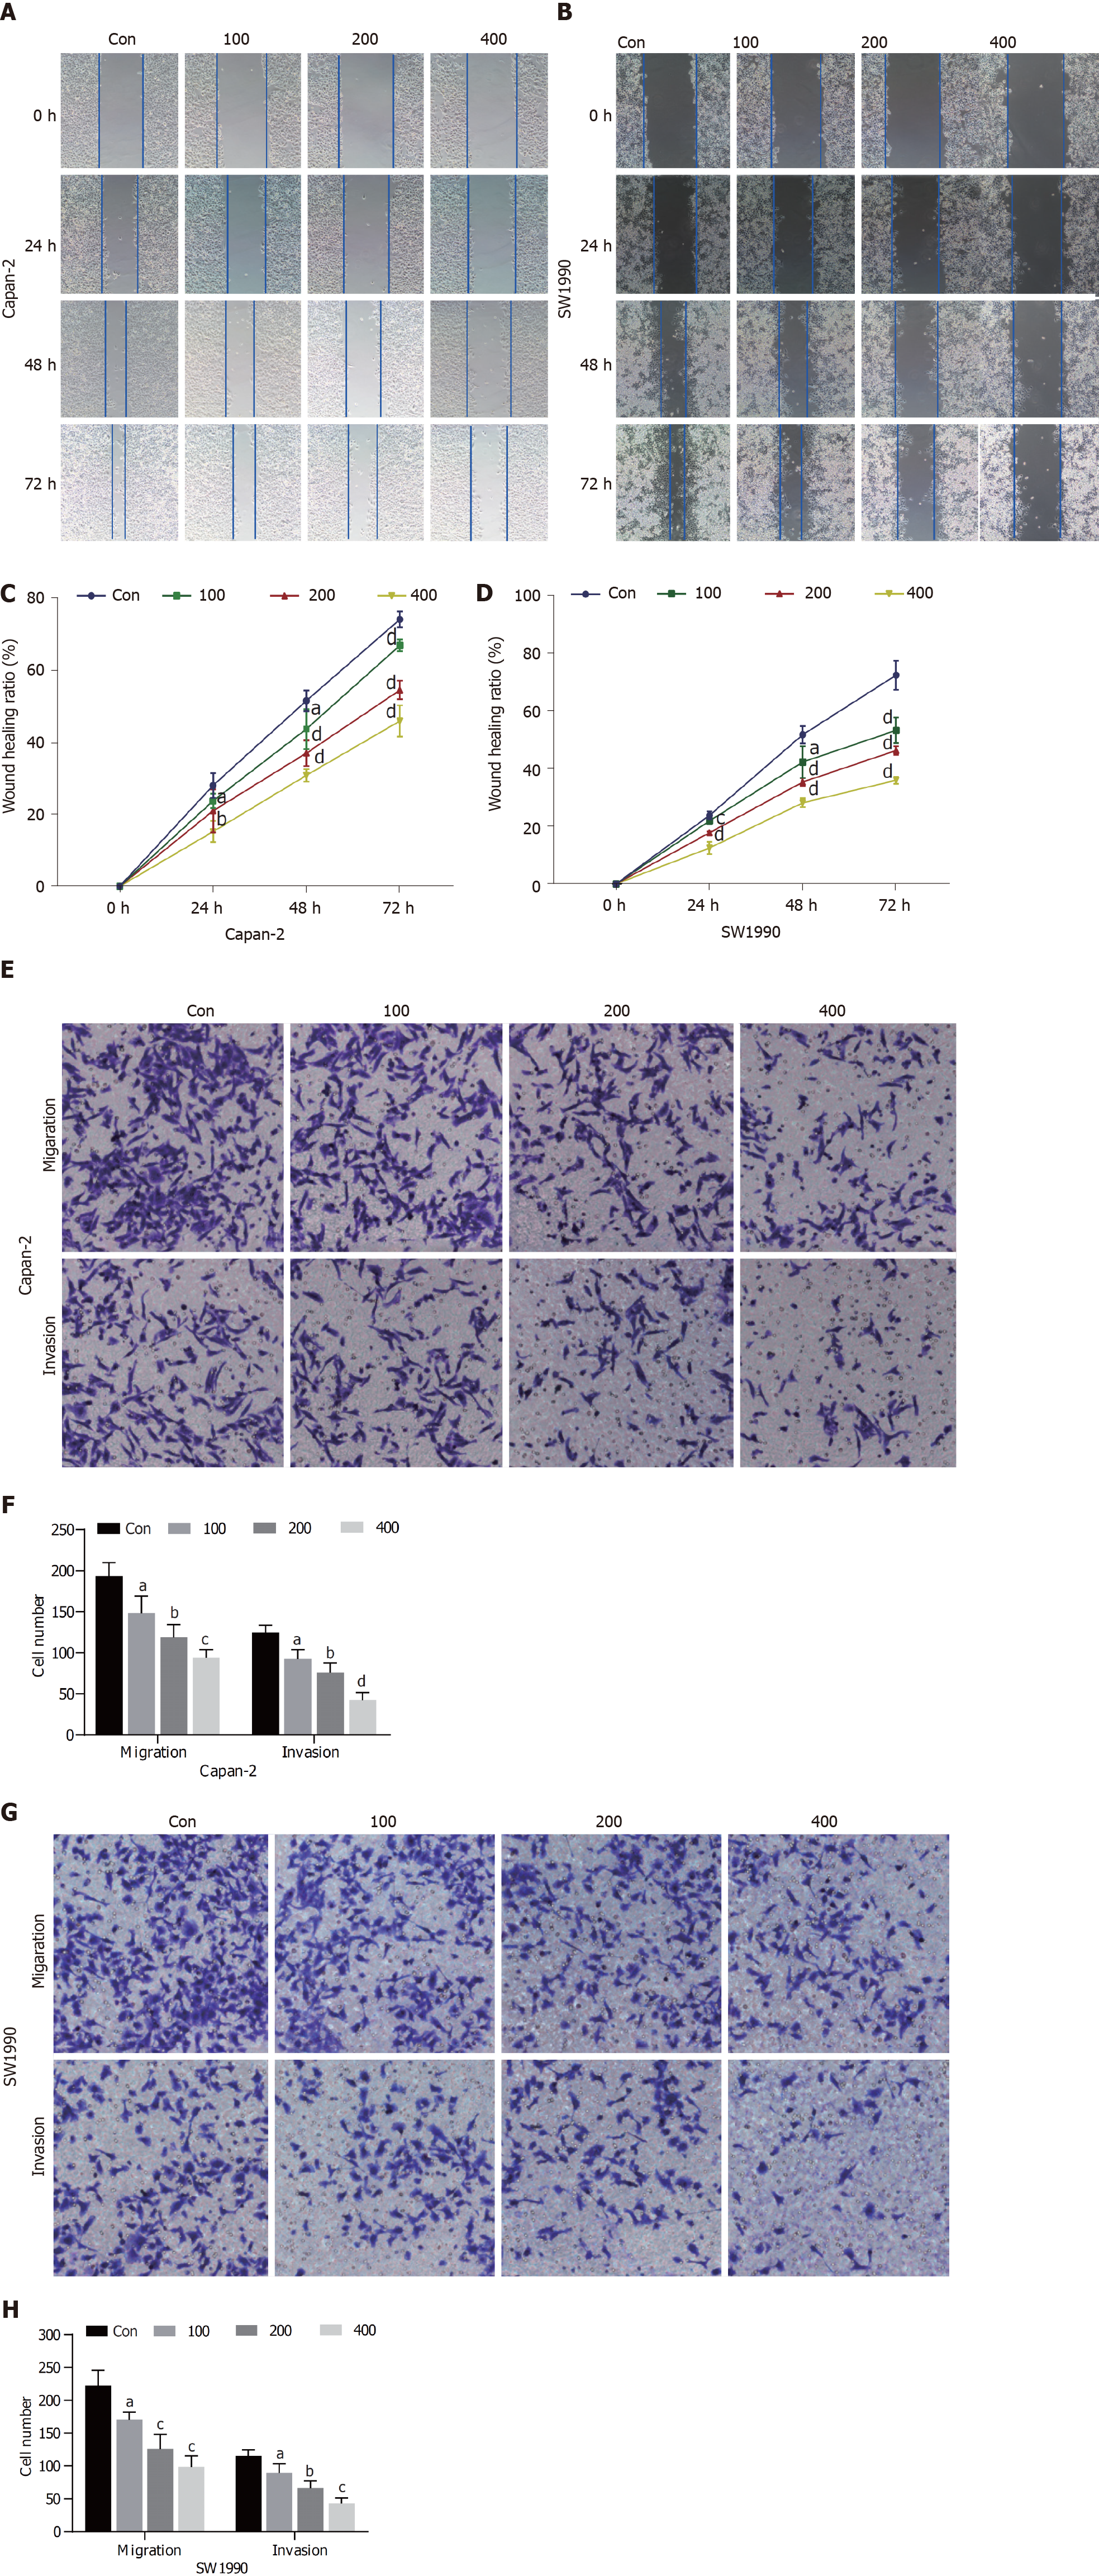
Figure 3 Scoparone inhibits pancreatic cancer cell migration and invasion.
A-D: Scoparone inhibits migration of Capan-2 (A and C) and SW1990 (B and D) cells by wound healing assay; E-H: Scoparone inhibits migration and invasion of Capan-2 (E and F) and SW1990 (G and H) cells by transwell assay. aP < 0.05, bP < 0.01, cP < 0.001, dP < 0.0001 vs the control group.
Figure 4 Scoparone causes cell cycle arrest and induces apoptosis.
A-C: Scoparone causes G0/G1 phase arrest of Capan-2 and SW1990 cells by flow cytometry. The abundance of Capan-2 (B) and SW1990 (C) cells increased in the G0/G1 phase and decreased in the S phase compared with the control group; D-F: Scoparone induces the apoptosis of Capan-2 (E) and SW1990 (F) cells. The 100, 200, and 400 μmol/L scoparone groups had significantly higher apoptosis rates than the control group; G-J: Protein levels of MMP9, Bcl-2, Bax, and cleaved caspase-3 compared with those of the internal control GAPDH in Capan-2 (G and H) and SW1990 (I and J) cells. Decreased MMP9 and Bcl-2 expression and increased Bax and cleaved caspase-3 expression were observed. aP < 0.05, bP < 0.01, cP < 0.001, dP < 0.0001 vs the control group.
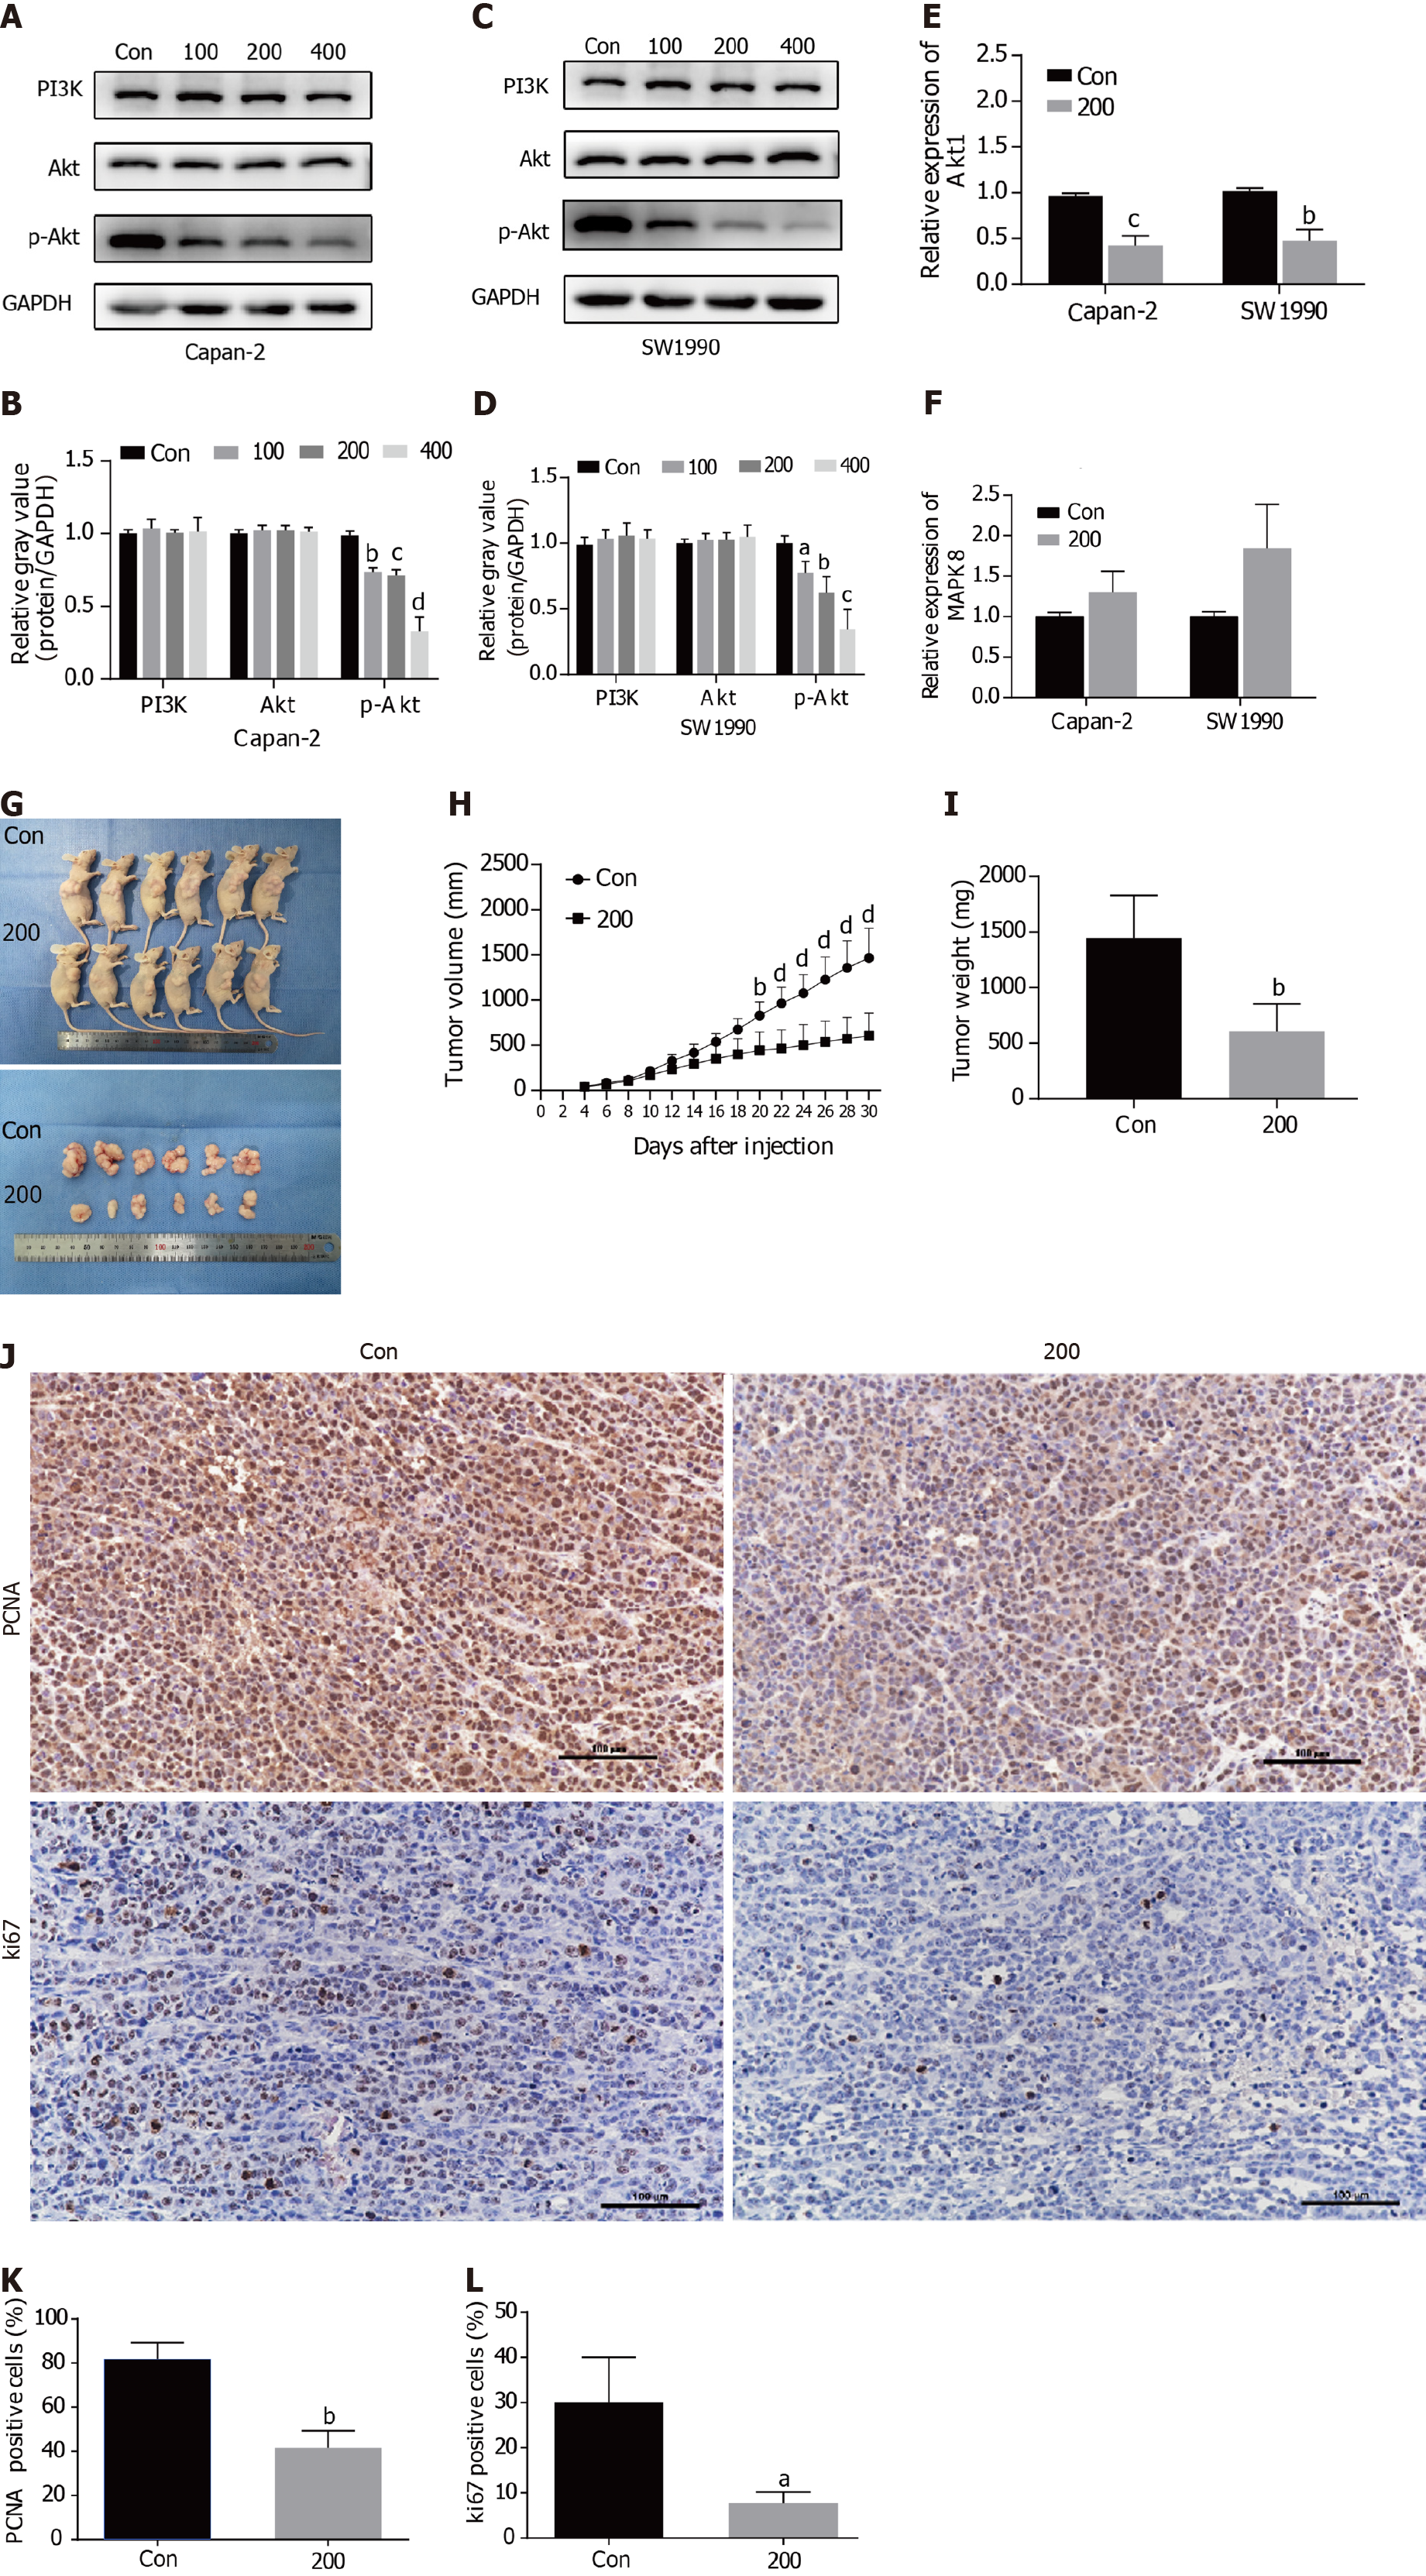
Figure 5 Scoparone inhibits the PI3K/Akt signaling pathway.
A-D: Scoparone inhibits the PI3K/Akt signaling pathway in Capan-2 (A and B) and SW1990 (C and D) cells. Scoparone treatment did not decrease the total expression of PI3K and Akt, but decreased p-Akt expression; E and F: Scoparone decreases the expression of AKT1 (E) and increases the expression of MAPK8 (F) as shown by quantitative reverse transcription polymerase chain reaction; G: Images of nude mice and xenograft tumors after treatment with 200 μmol/L scoparone compared with the control group; H: Tumor volume at different time points after treatment with 200 μmol/L scoparone compared with the control group; I: Tumor weight after treatment with 200 μmol/L scoparone compared with the control group; J: Immunohistochemistry (IHC) was performed on xenograft tumors to evaluate PCNA and Ki67 expression. Shown are representative images; K and L: The number of PCNA or Ki67 positive cells were counted from PCNA IHC (K) and Ki67 IHC (L), and decreased PCNA and Ki67 were observed after treatment with scoparone. aP < 0.05, bP < 0.01, cP < 0.001, dP < 0.0001 vs the control group.
- Citation: Li N, Yang F, Liu DY, Guo JT, Ge N, Sun SY. Scoparone inhibits pancreatic cancer through PI3K/Akt signaling pathway. World J Gastrointest Oncol 2021; 13(9): 1164-1183
- URL: https://www.wjgnet.com/1948-5204/full/v13/i9/1164.htm
- DOI: https://dx.doi.org/10.4251/wjgo.v13.i9.1164


