Copyright
©The Author(s) 2021.
World J Gastrointest Oncol. Dec 15, 2021; 13(12): 2114-2128
Published online Dec 15, 2021. doi: 10.4251/wjgo.v13.i12.2114
Published online Dec 15, 2021. doi: 10.4251/wjgo.v13.i12.2114
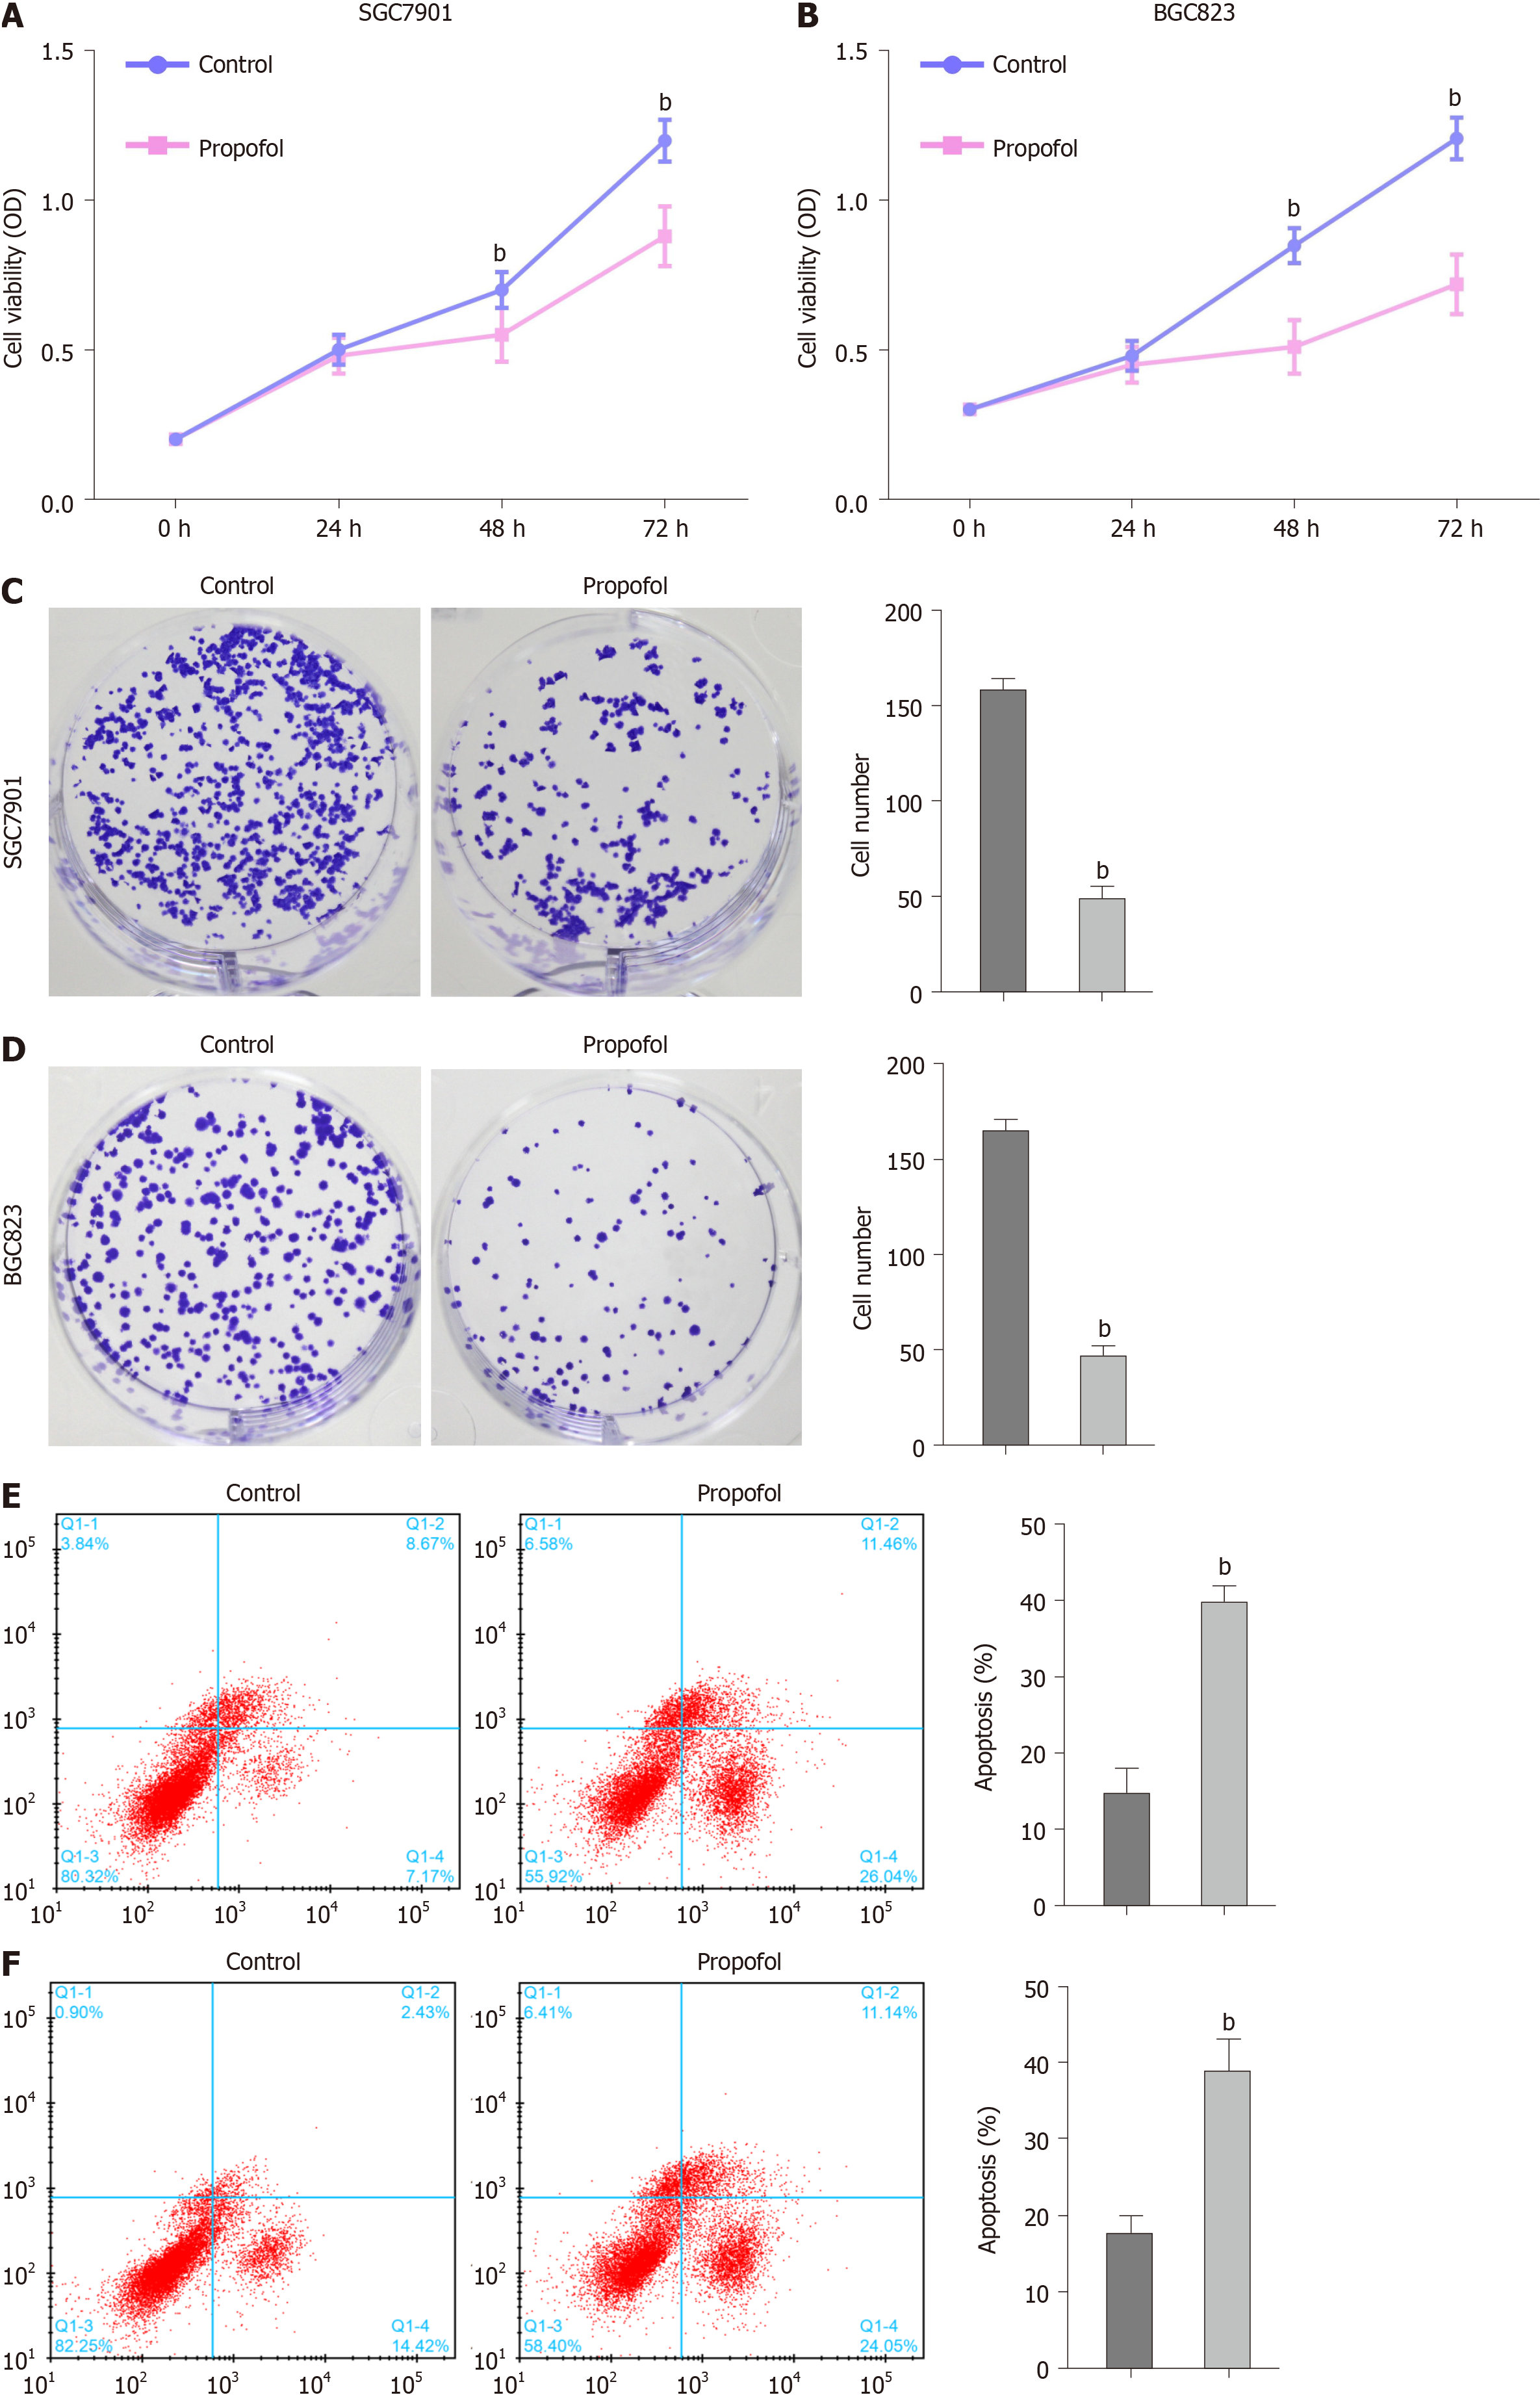
Figure 1 Propofol decreases proliferation and induces apoptosis of gastric cancer cells.
A–E: SGC7901 and BGC823 cells were treated with propofol (10 µmol/L). A and B: MTT assays analyzed cell viability; C and D: Colony formation assays measured cell proliferation; E and F: Flow cytometry analysis tested cell apoptosis. n = 3, mean ± SD, bP < 0.01.
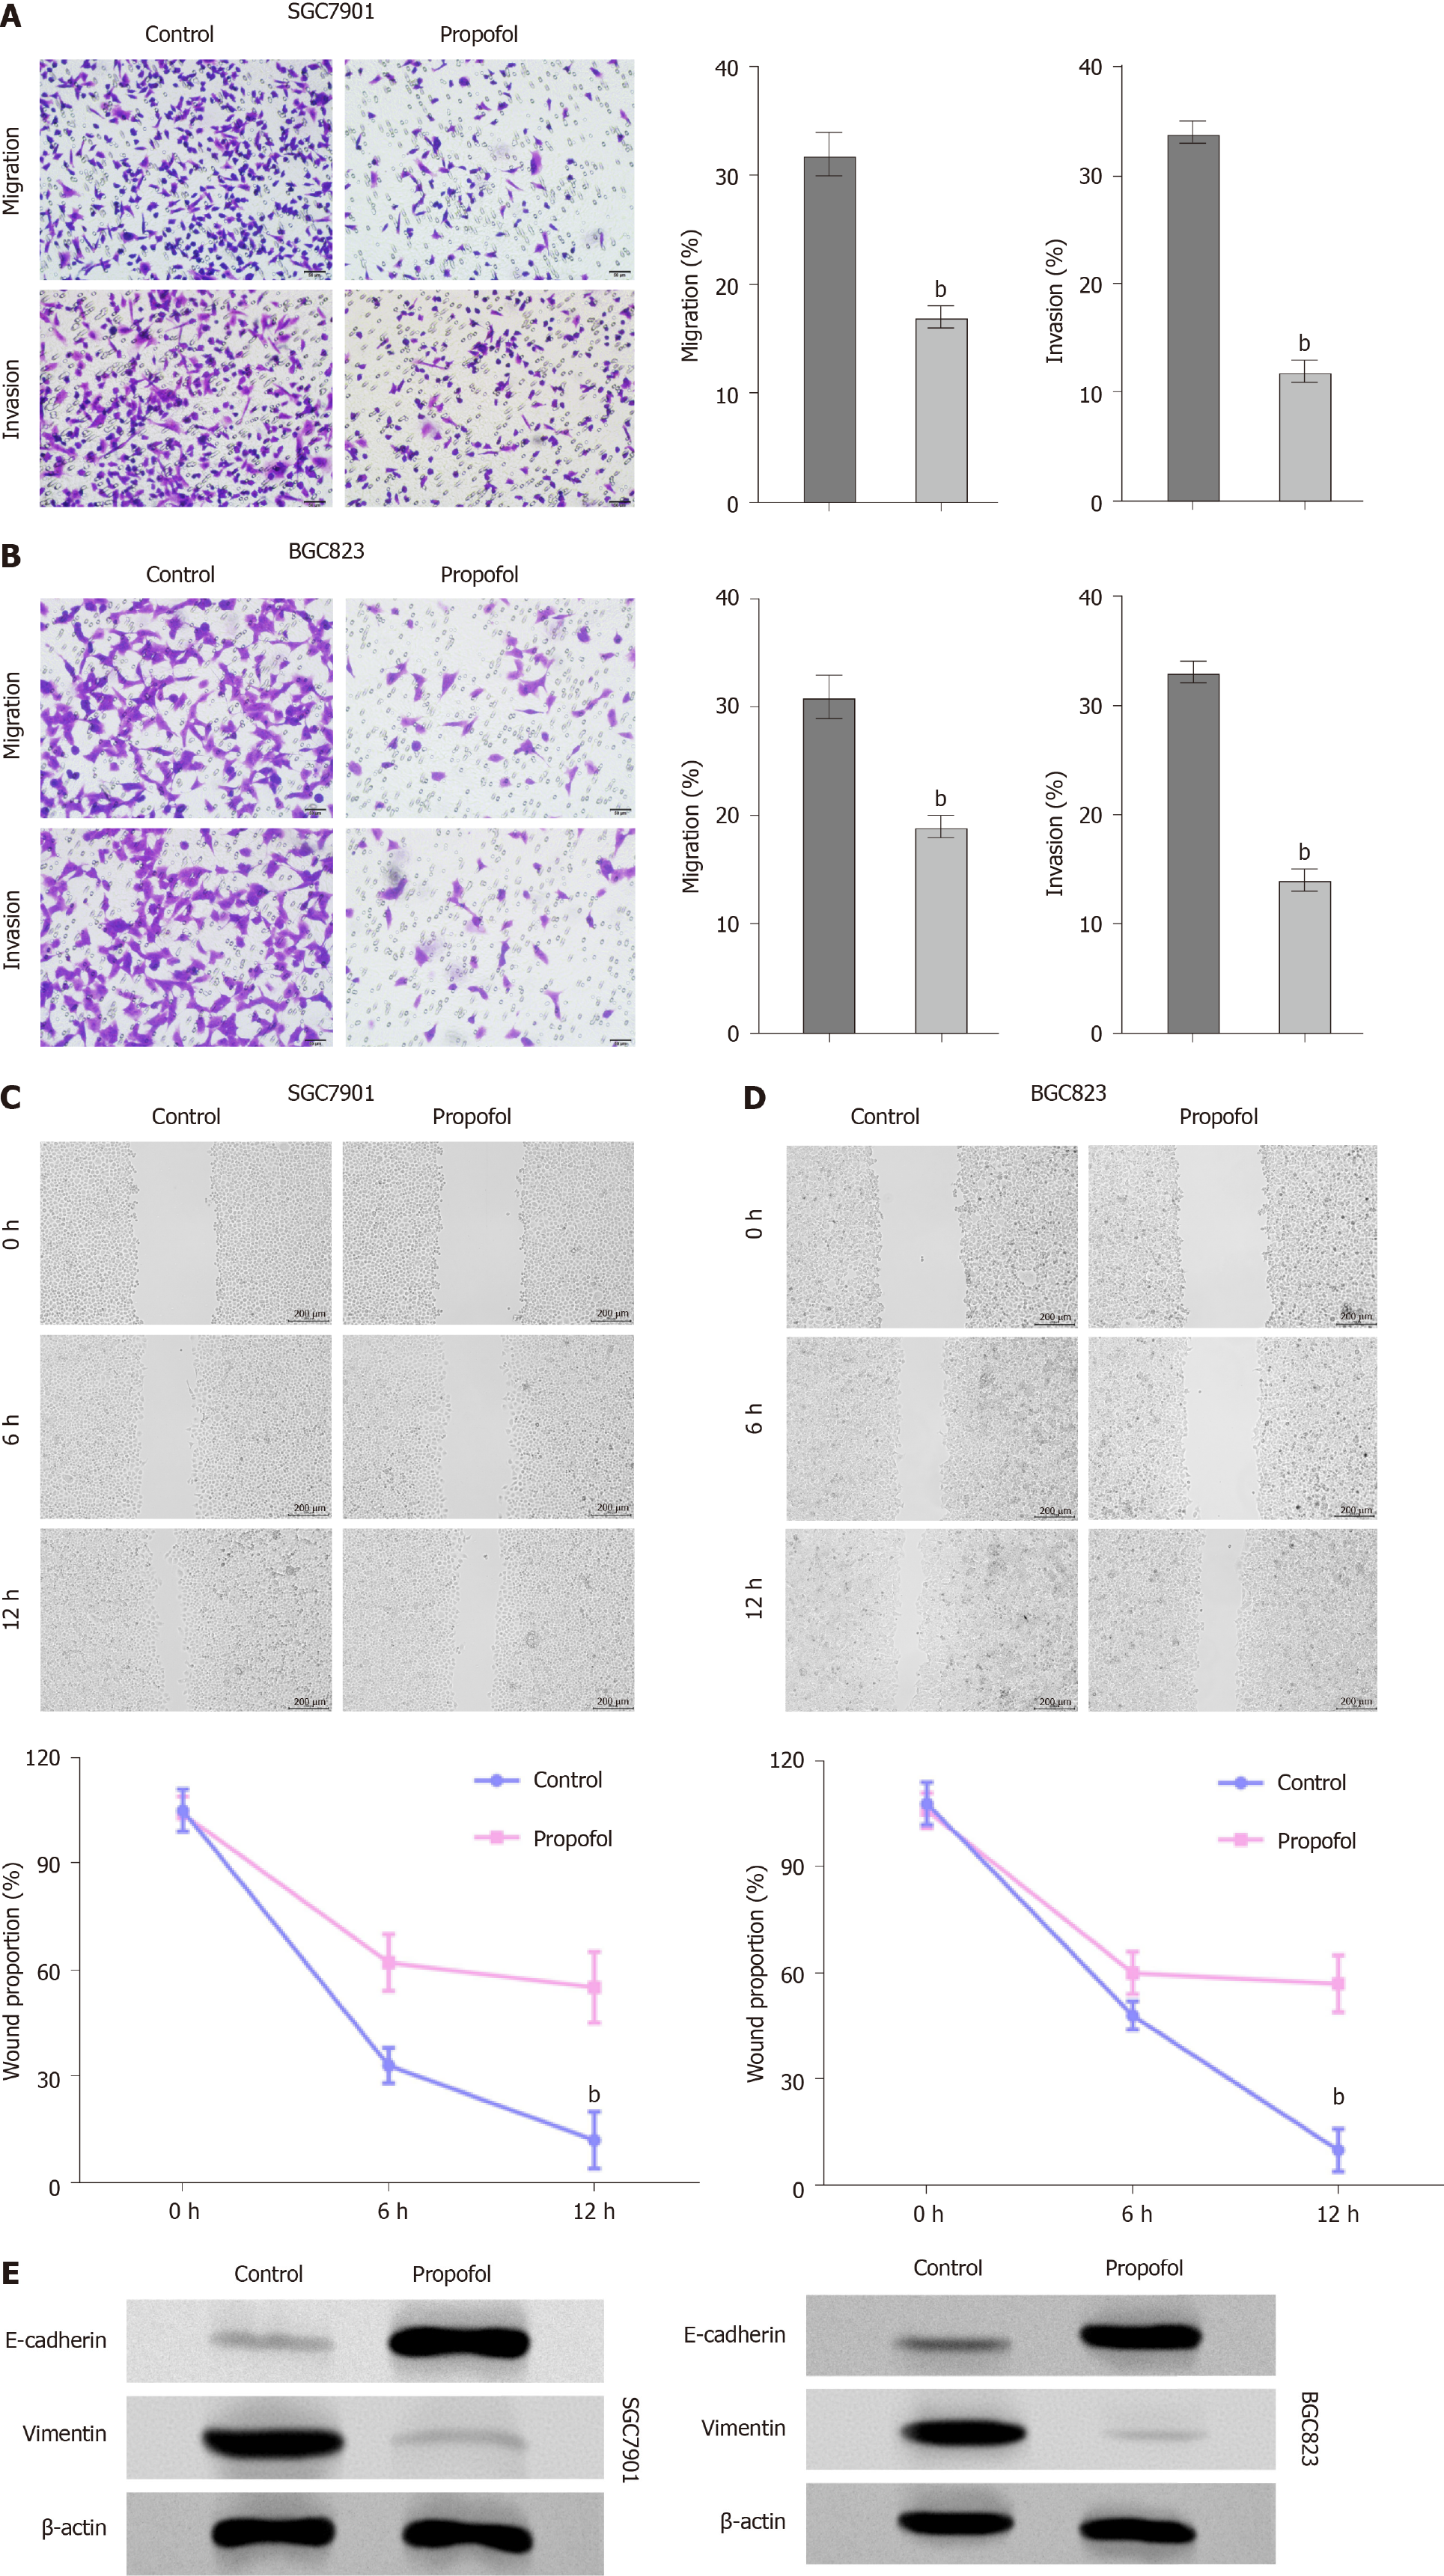
Figure 2 Propofol reduces invasion and migration of gastric cancer cells.
A-D: SGC7901 and BGC823 cells were treated with propofol (10 µmol/L). A and B: Transwell assays analyzed cell migration and invasion; C and D: Wound healing assays examined migration and invasion. The wound healing proportion is shown. E: Protein levels of E-cadherin and vimentin were measured by western blotting. n = 3, mean ± SD, bP < 0.01.
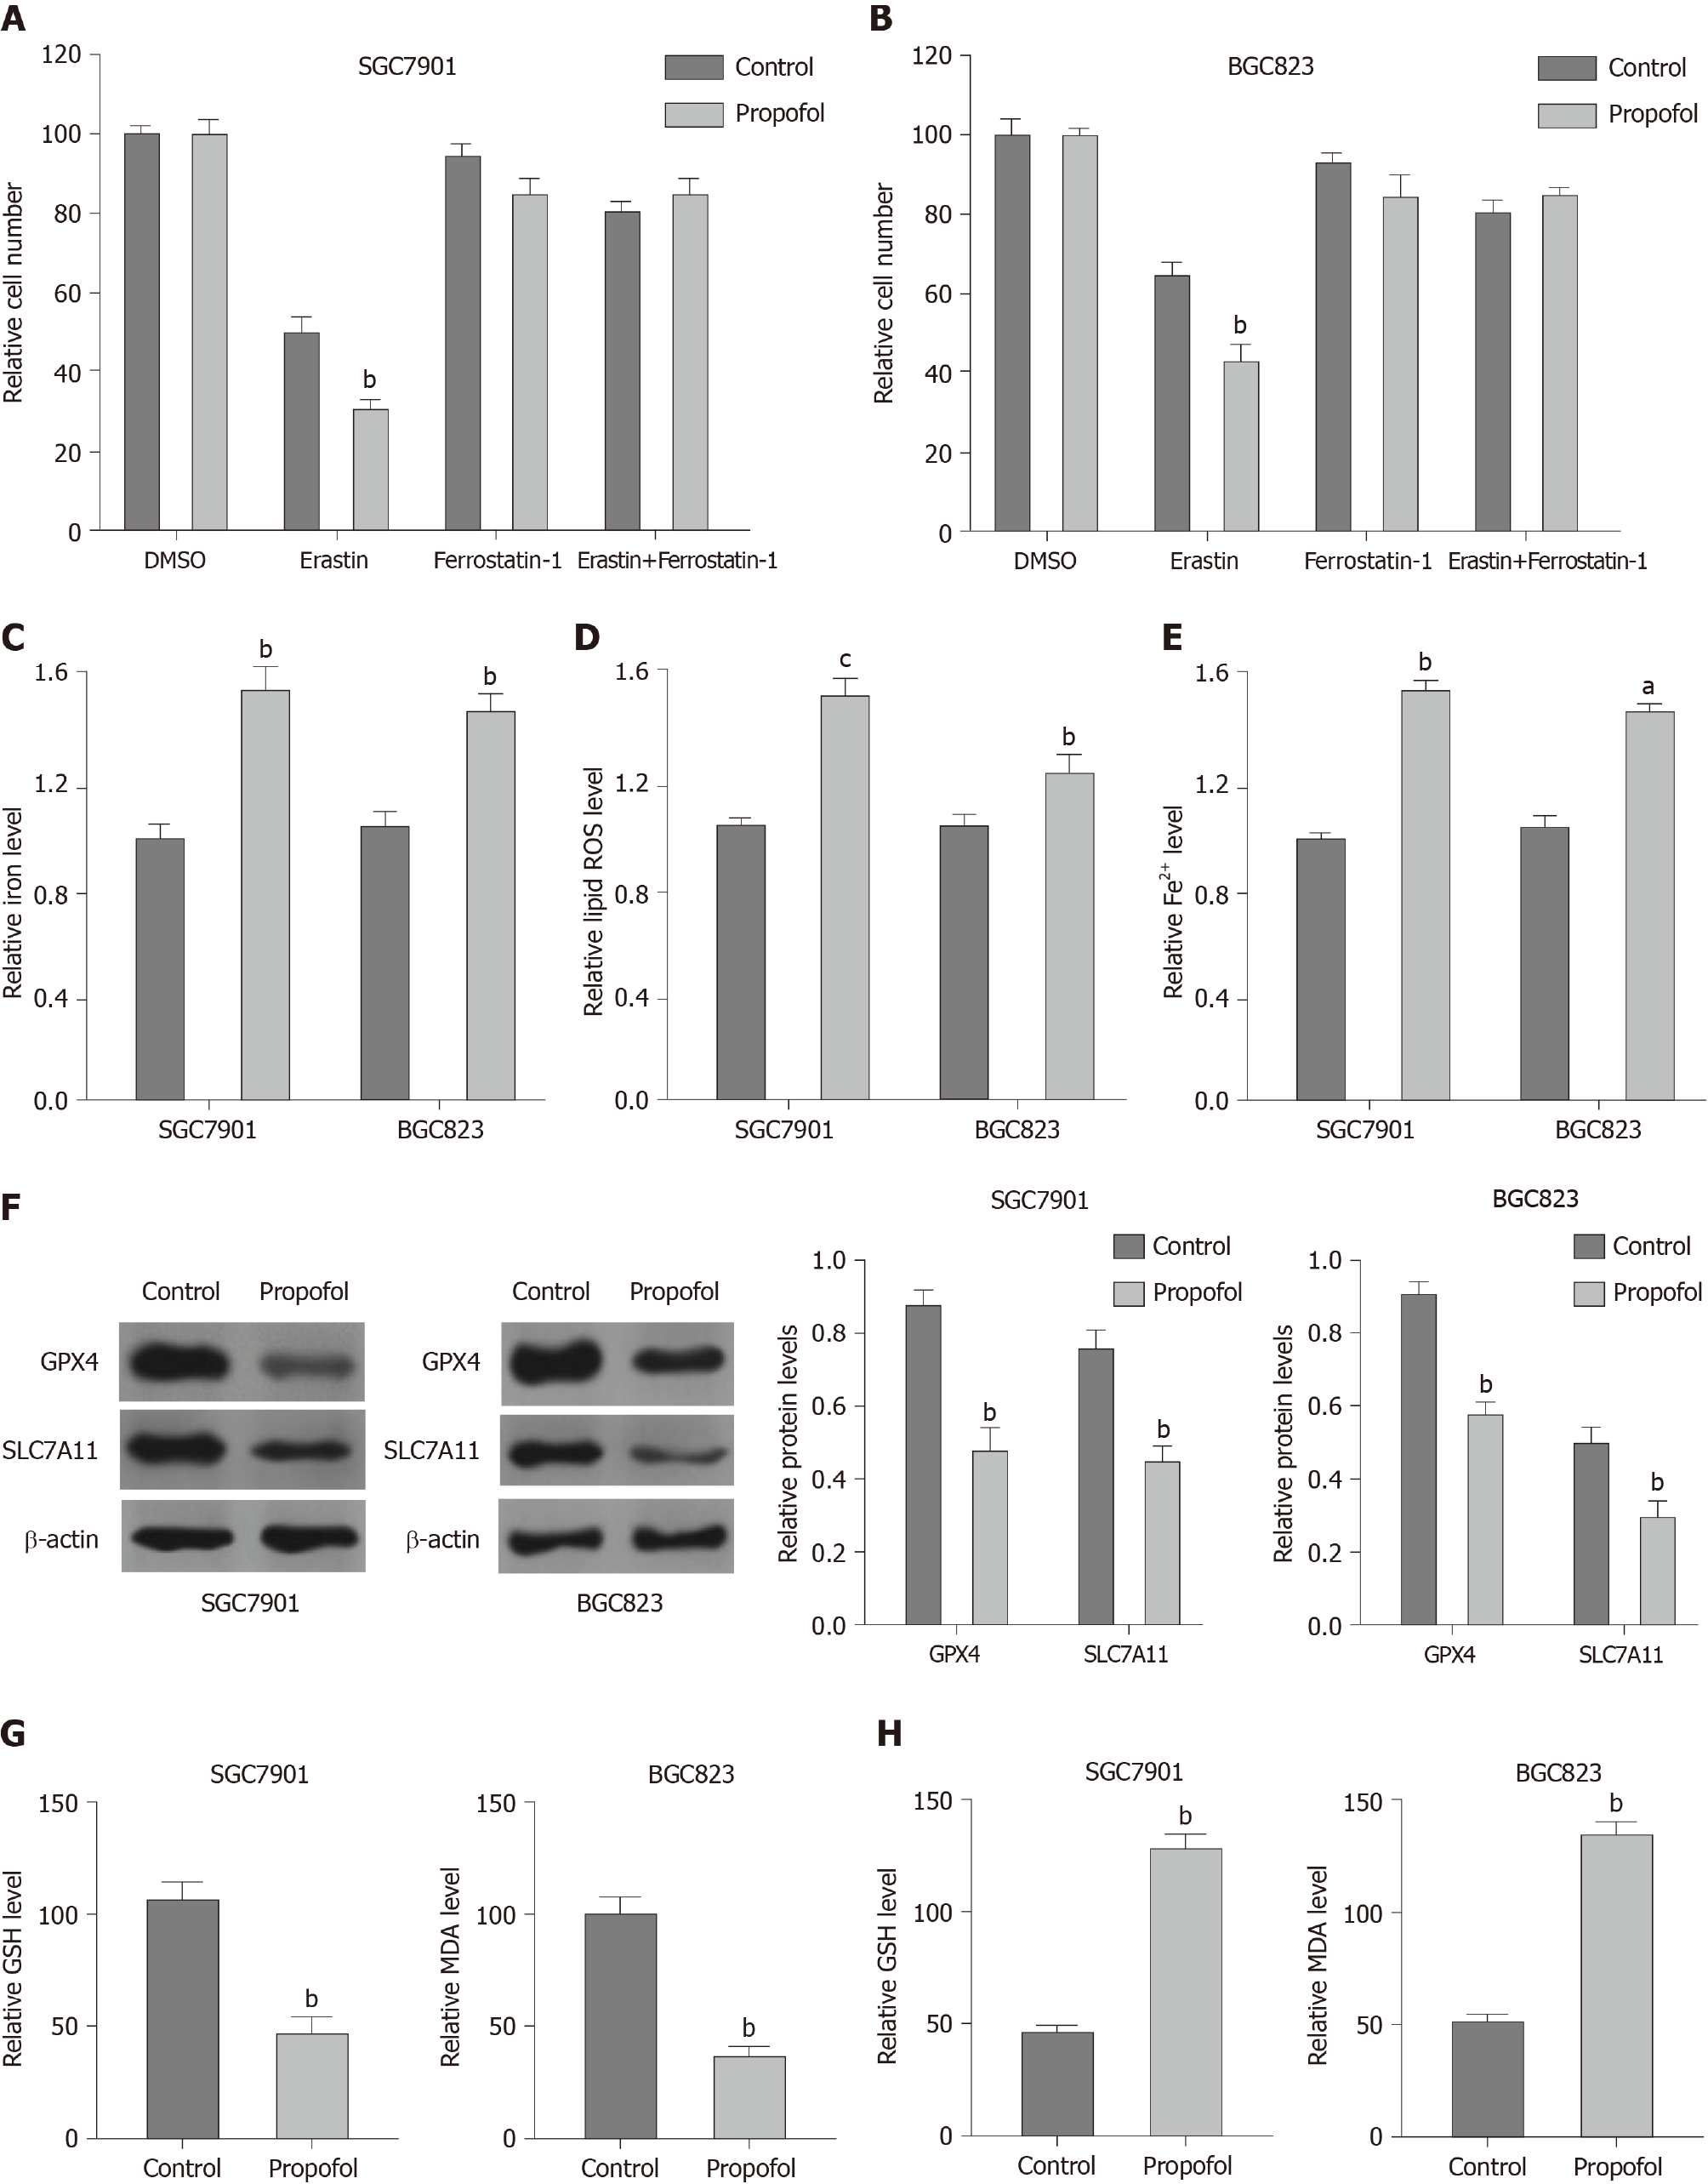
Figure 3 Propofol enhances ferroptosis in gastric cancer cells.
A and B: SGC7901 and BGC823 were cotreated with 5 mmol/L erastin or ferrostatin (1 mmol/L) and propofol (10 µmol/L). Cell growth was analyzed by MTT assays. C–F: SGC7901 and BGC823 cells were treated with propofol (10 µmol/L). C: Flow cytometry measured the levels of ROS. D and E: Iron Assay Kit analyzed the levels of iron and Fe2+. F: Western blotting analysis tested the expression of GPX4, SLC7A11 and β-actin. G and H: Levels of GSH and MDA were analyzed by the detection kit. n = 3, mean ± SD, aP < 0.05, bP < 0.01, cP < 0.001.
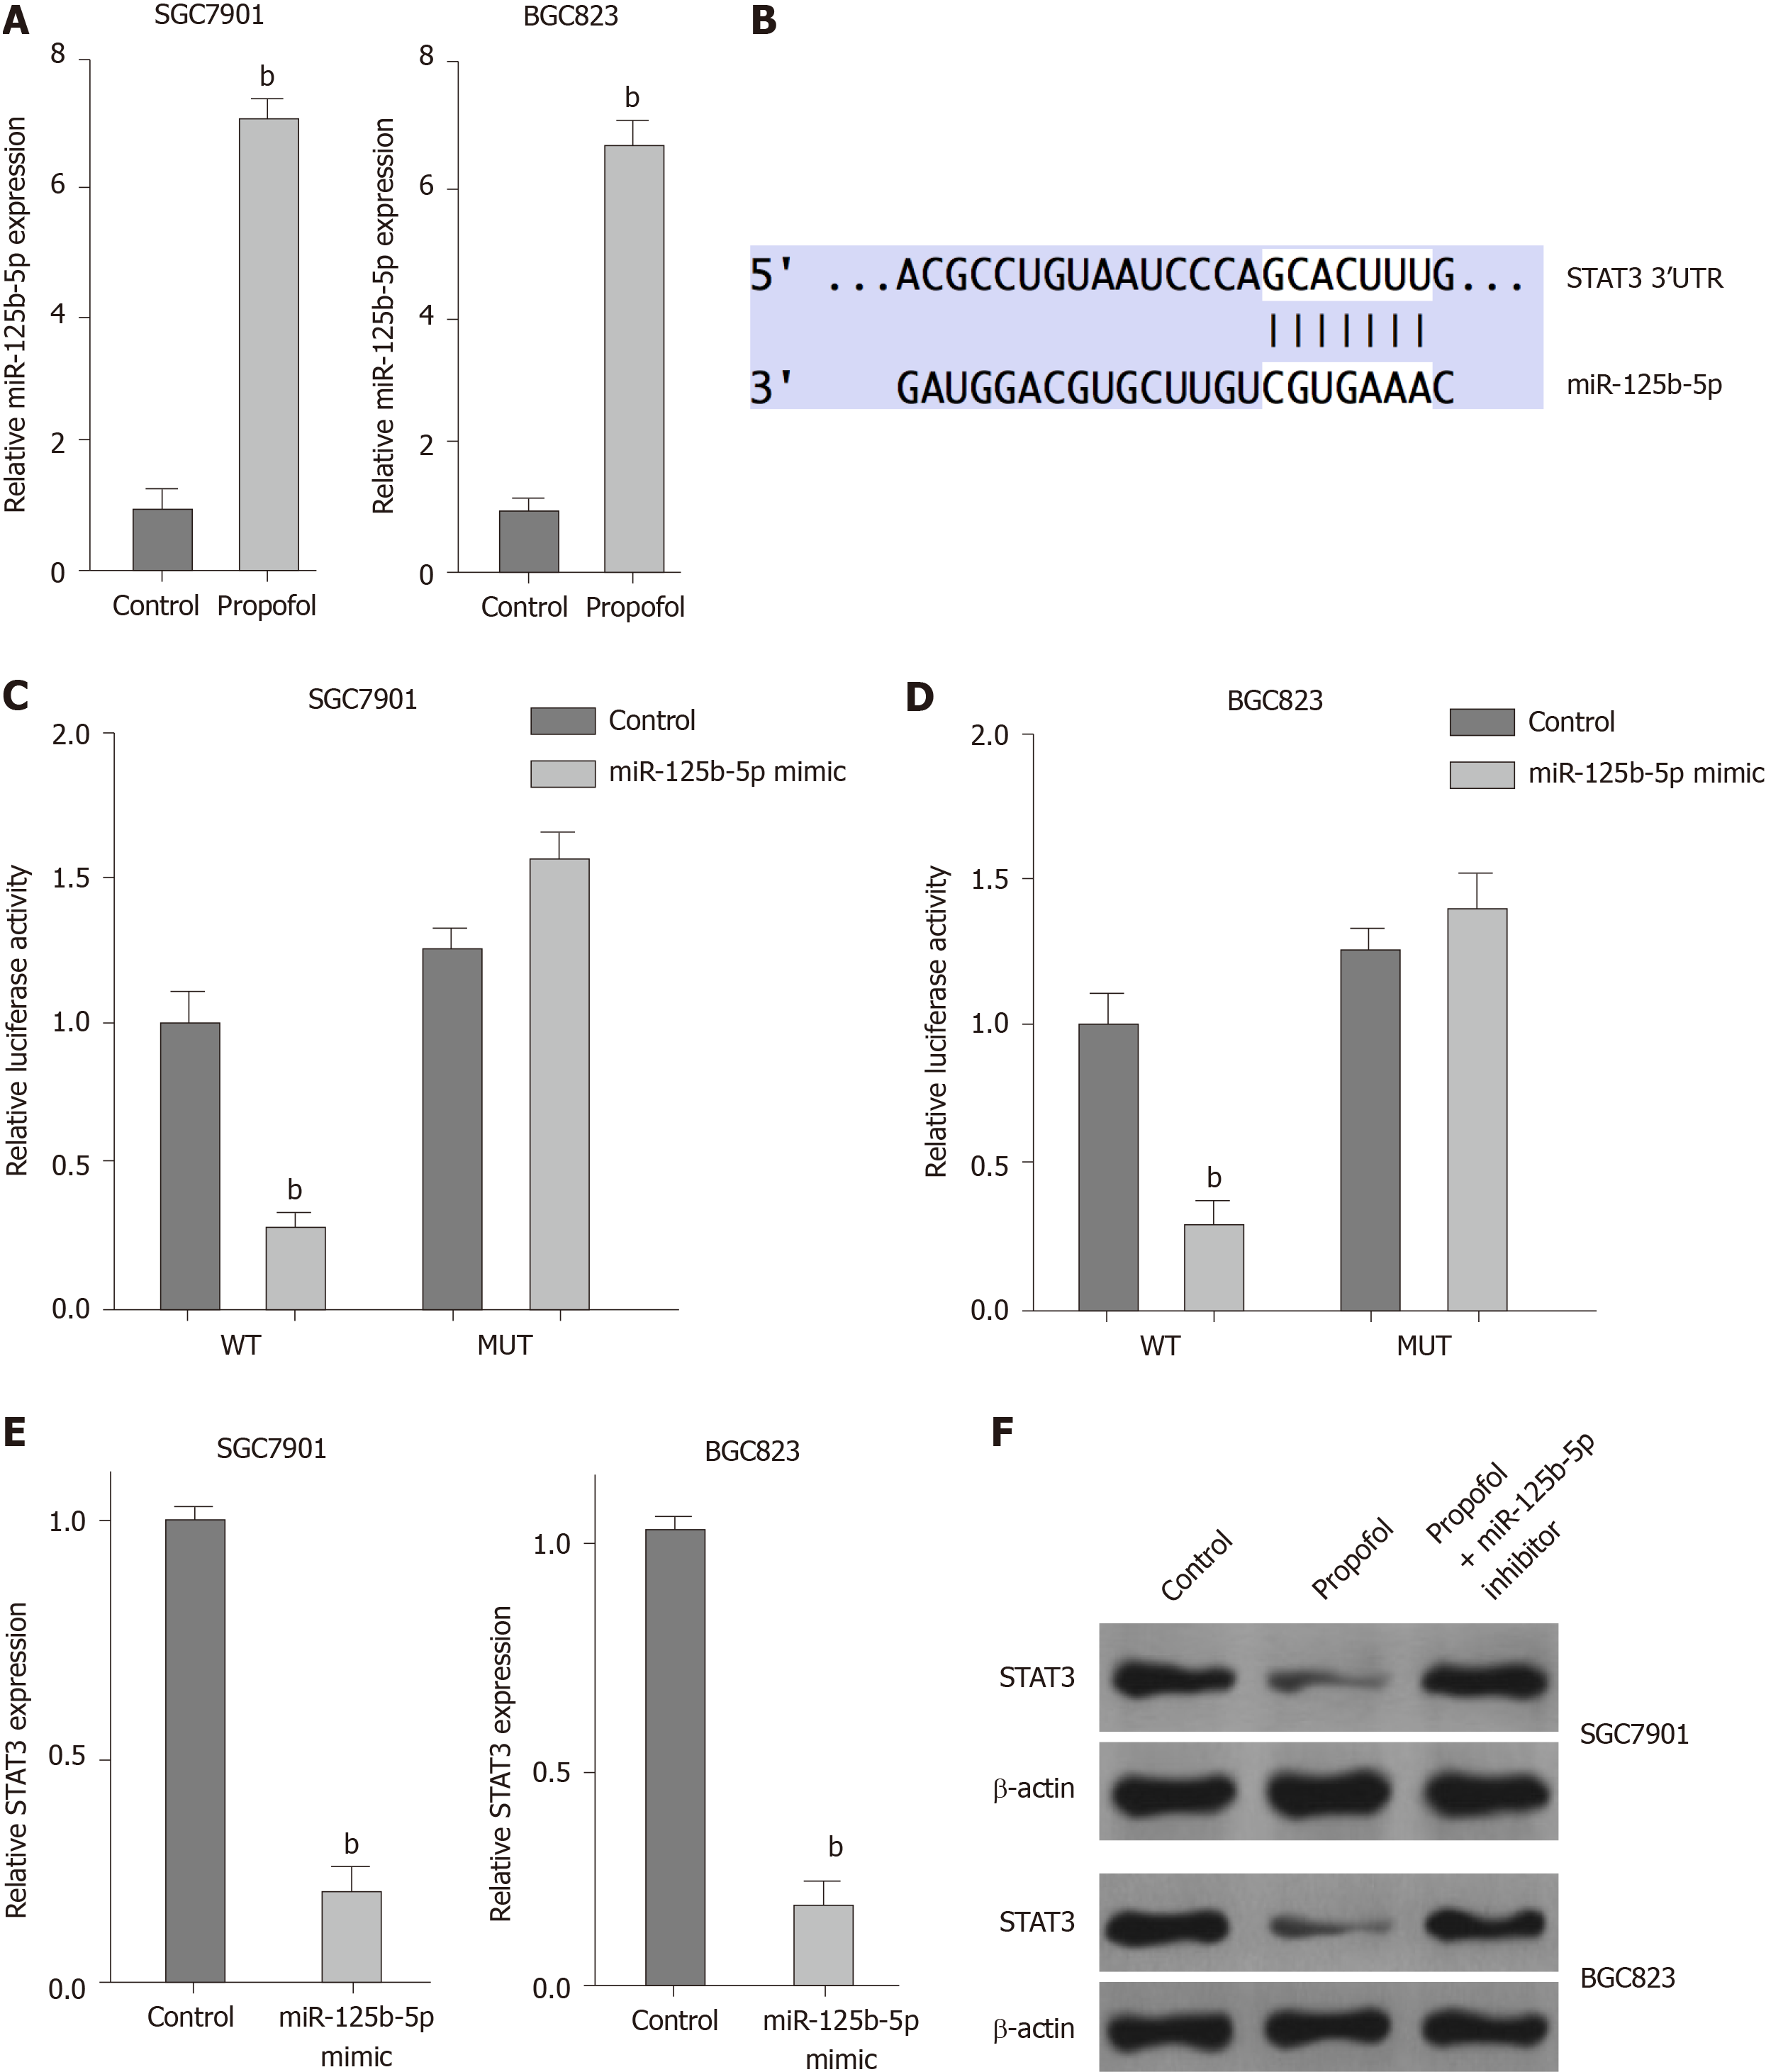
Figure 4 Propofol represses signal transducer and activator of transcription (STAT)3 expression by upregulating miR-125b-5p in gastric cancer cells.
A: SGC7901 and BGC823 cells were treated with propofol (10 µmol/L). Quantitative reverse transcription polymerase chain reaction (qRT-PCR) measured expression of miR-125b-5p. B: The binding site of miR-125b-5p and STAT3 3’ UTR was identified by bioinformatic analysis using Targetscan (http://www.targetscan.org/vert_72/). C–E: SGC7901 and BGC823 cells were treated with the miR-125b-5p mimic or control mimic. C and D: Luciferase reporter gene assays determined the luciferase activities. E: qRT-PCR analyzed mRNA expression of STAT3. F: SGC7901 and BGC823 cells were treated with propofol, or cotreated with propofol and miR-125b-5p inhibitor. Western blotting assessed protein expression of STAT3 and β-actin. n = 3, mean ± SD, bP < 0.01.
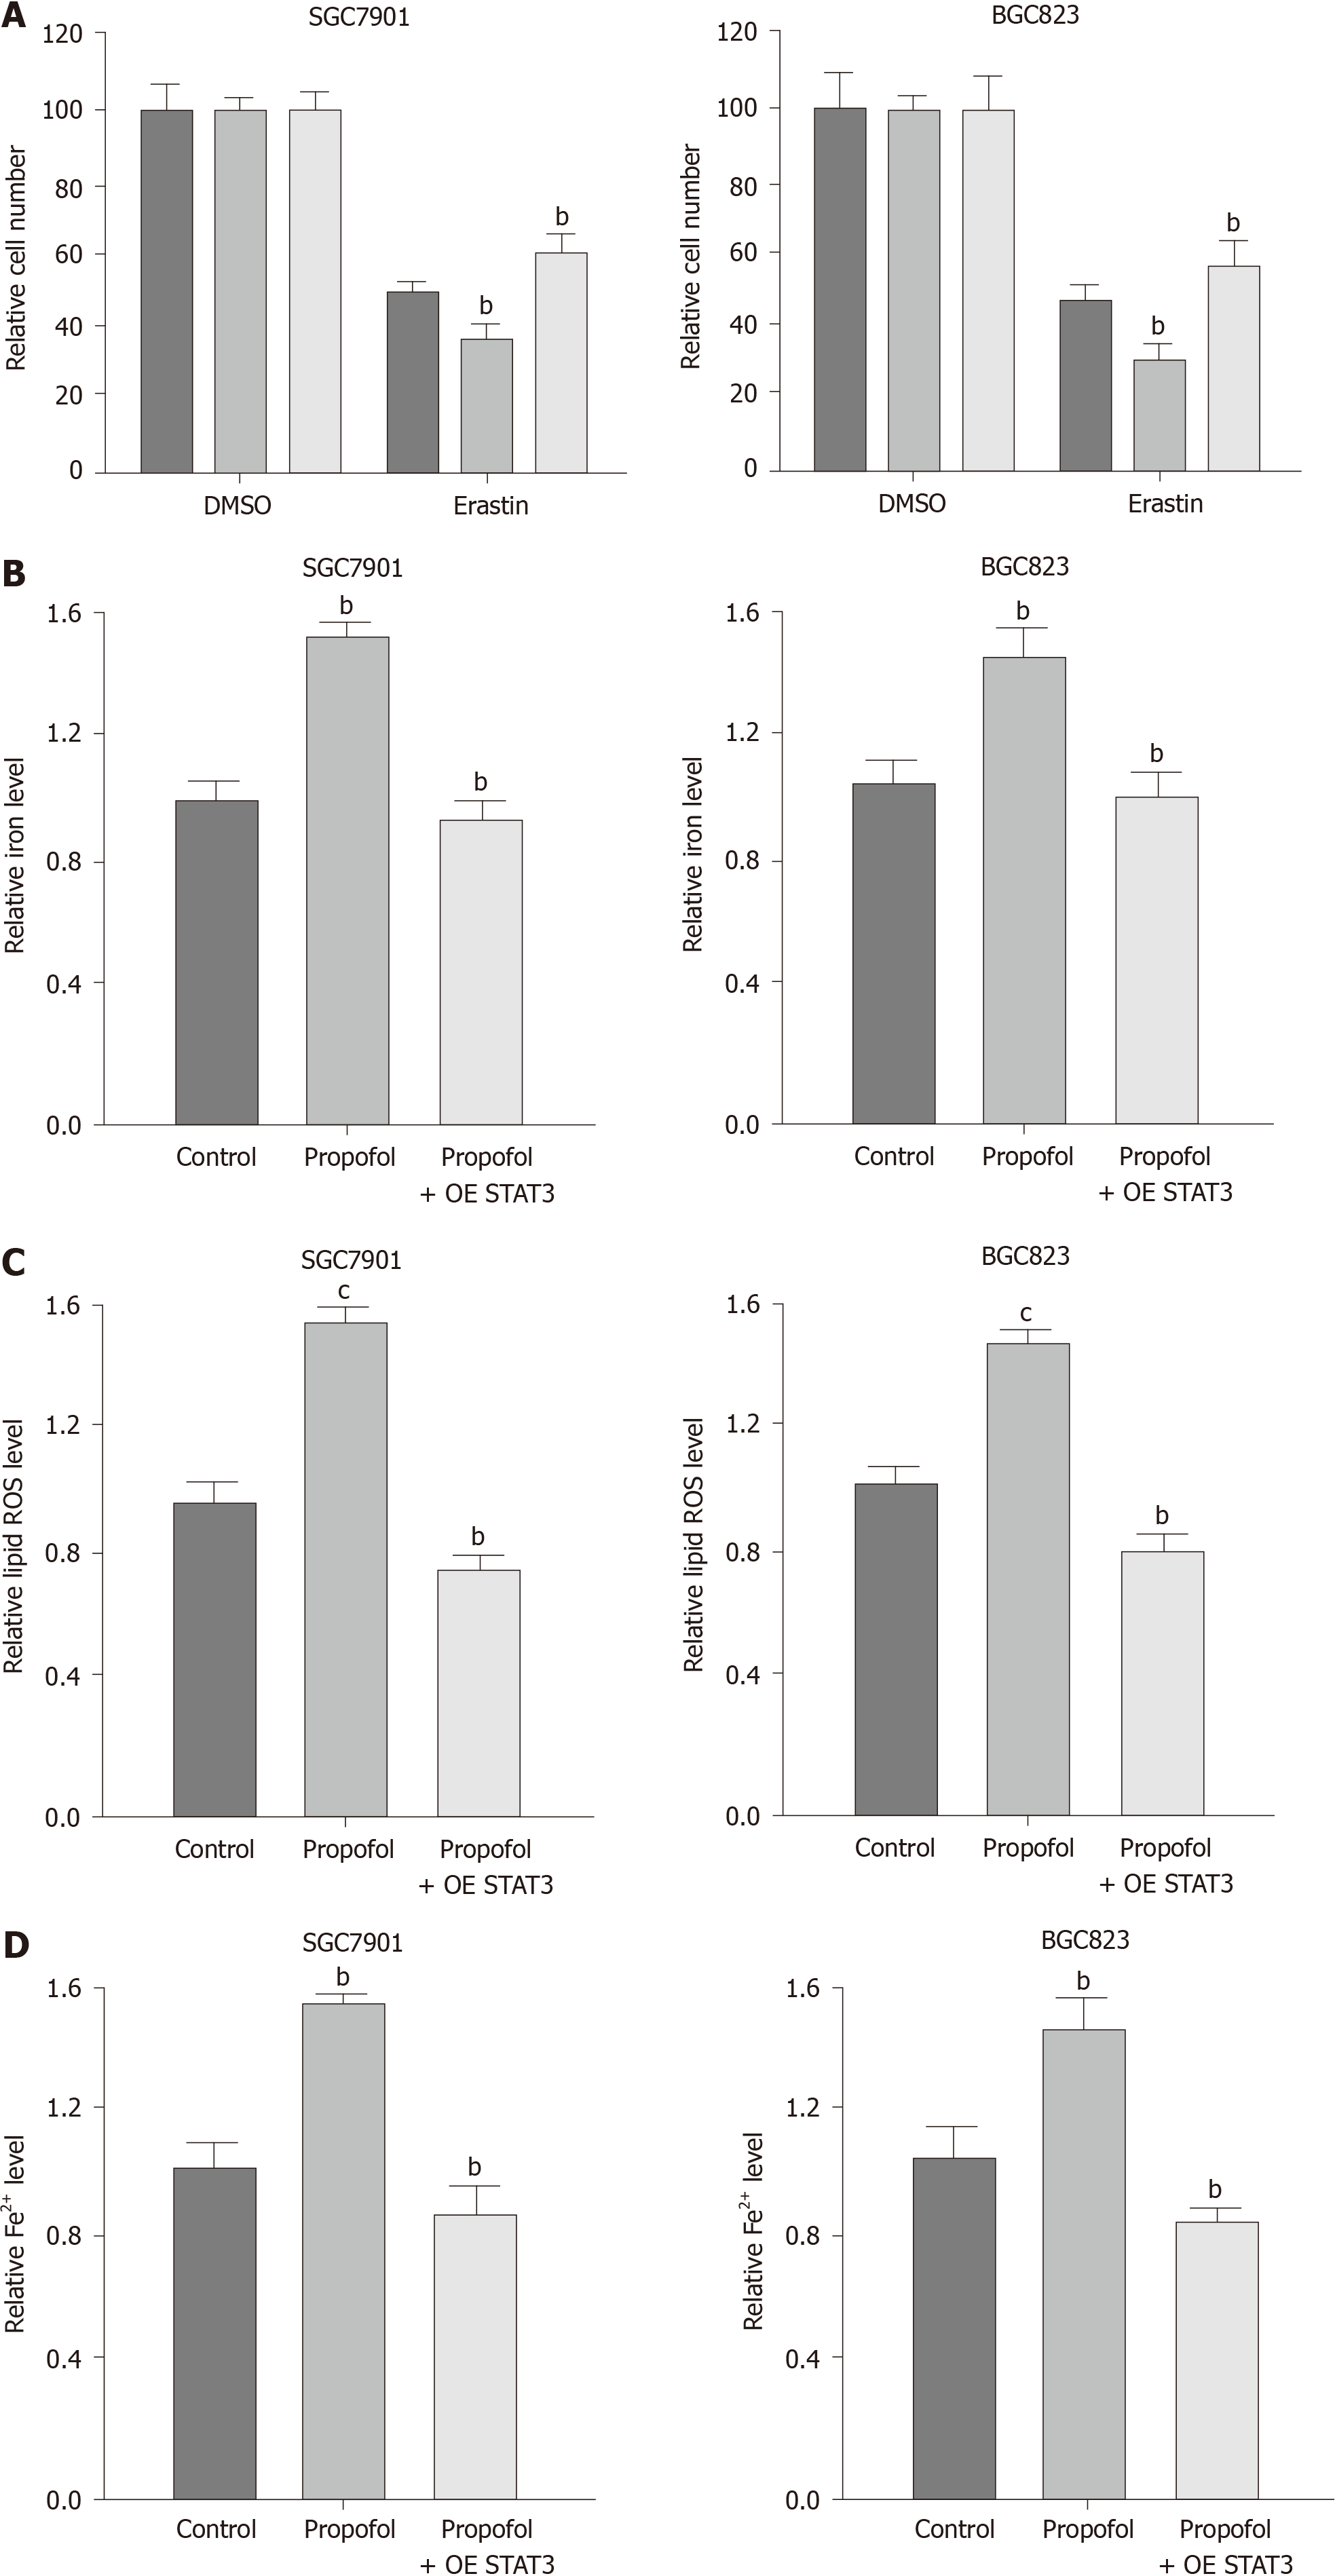
Figure 5 Propofol enhances ferroptosis by targeting signal transducer and activator of transcription (STAT)3 in gastric cancer cells.
A: SGC7901 and BGC823 cells were treated with 5 mmol/L erastin, cotreated with 5 mmol/L erastin and propofol, or cotreated with 5 mmol/L erastin, propofol, and pcDNA.1-STAT3. MTT assays measured cell growth. B–D: SGC7901 and BGC823 cells were treated with propofol, or cotreated with propofol and pcDNA.1-STAT3. B: Iron Assay Kit analyzed the levels of iron; C: Flow cytometry analysis tested the levels of ROS; and D: Iron Assay Kit analyzed the levels of Fe2+. n = 3, mean ± SD, bP < 0.01, cP < 0.001.
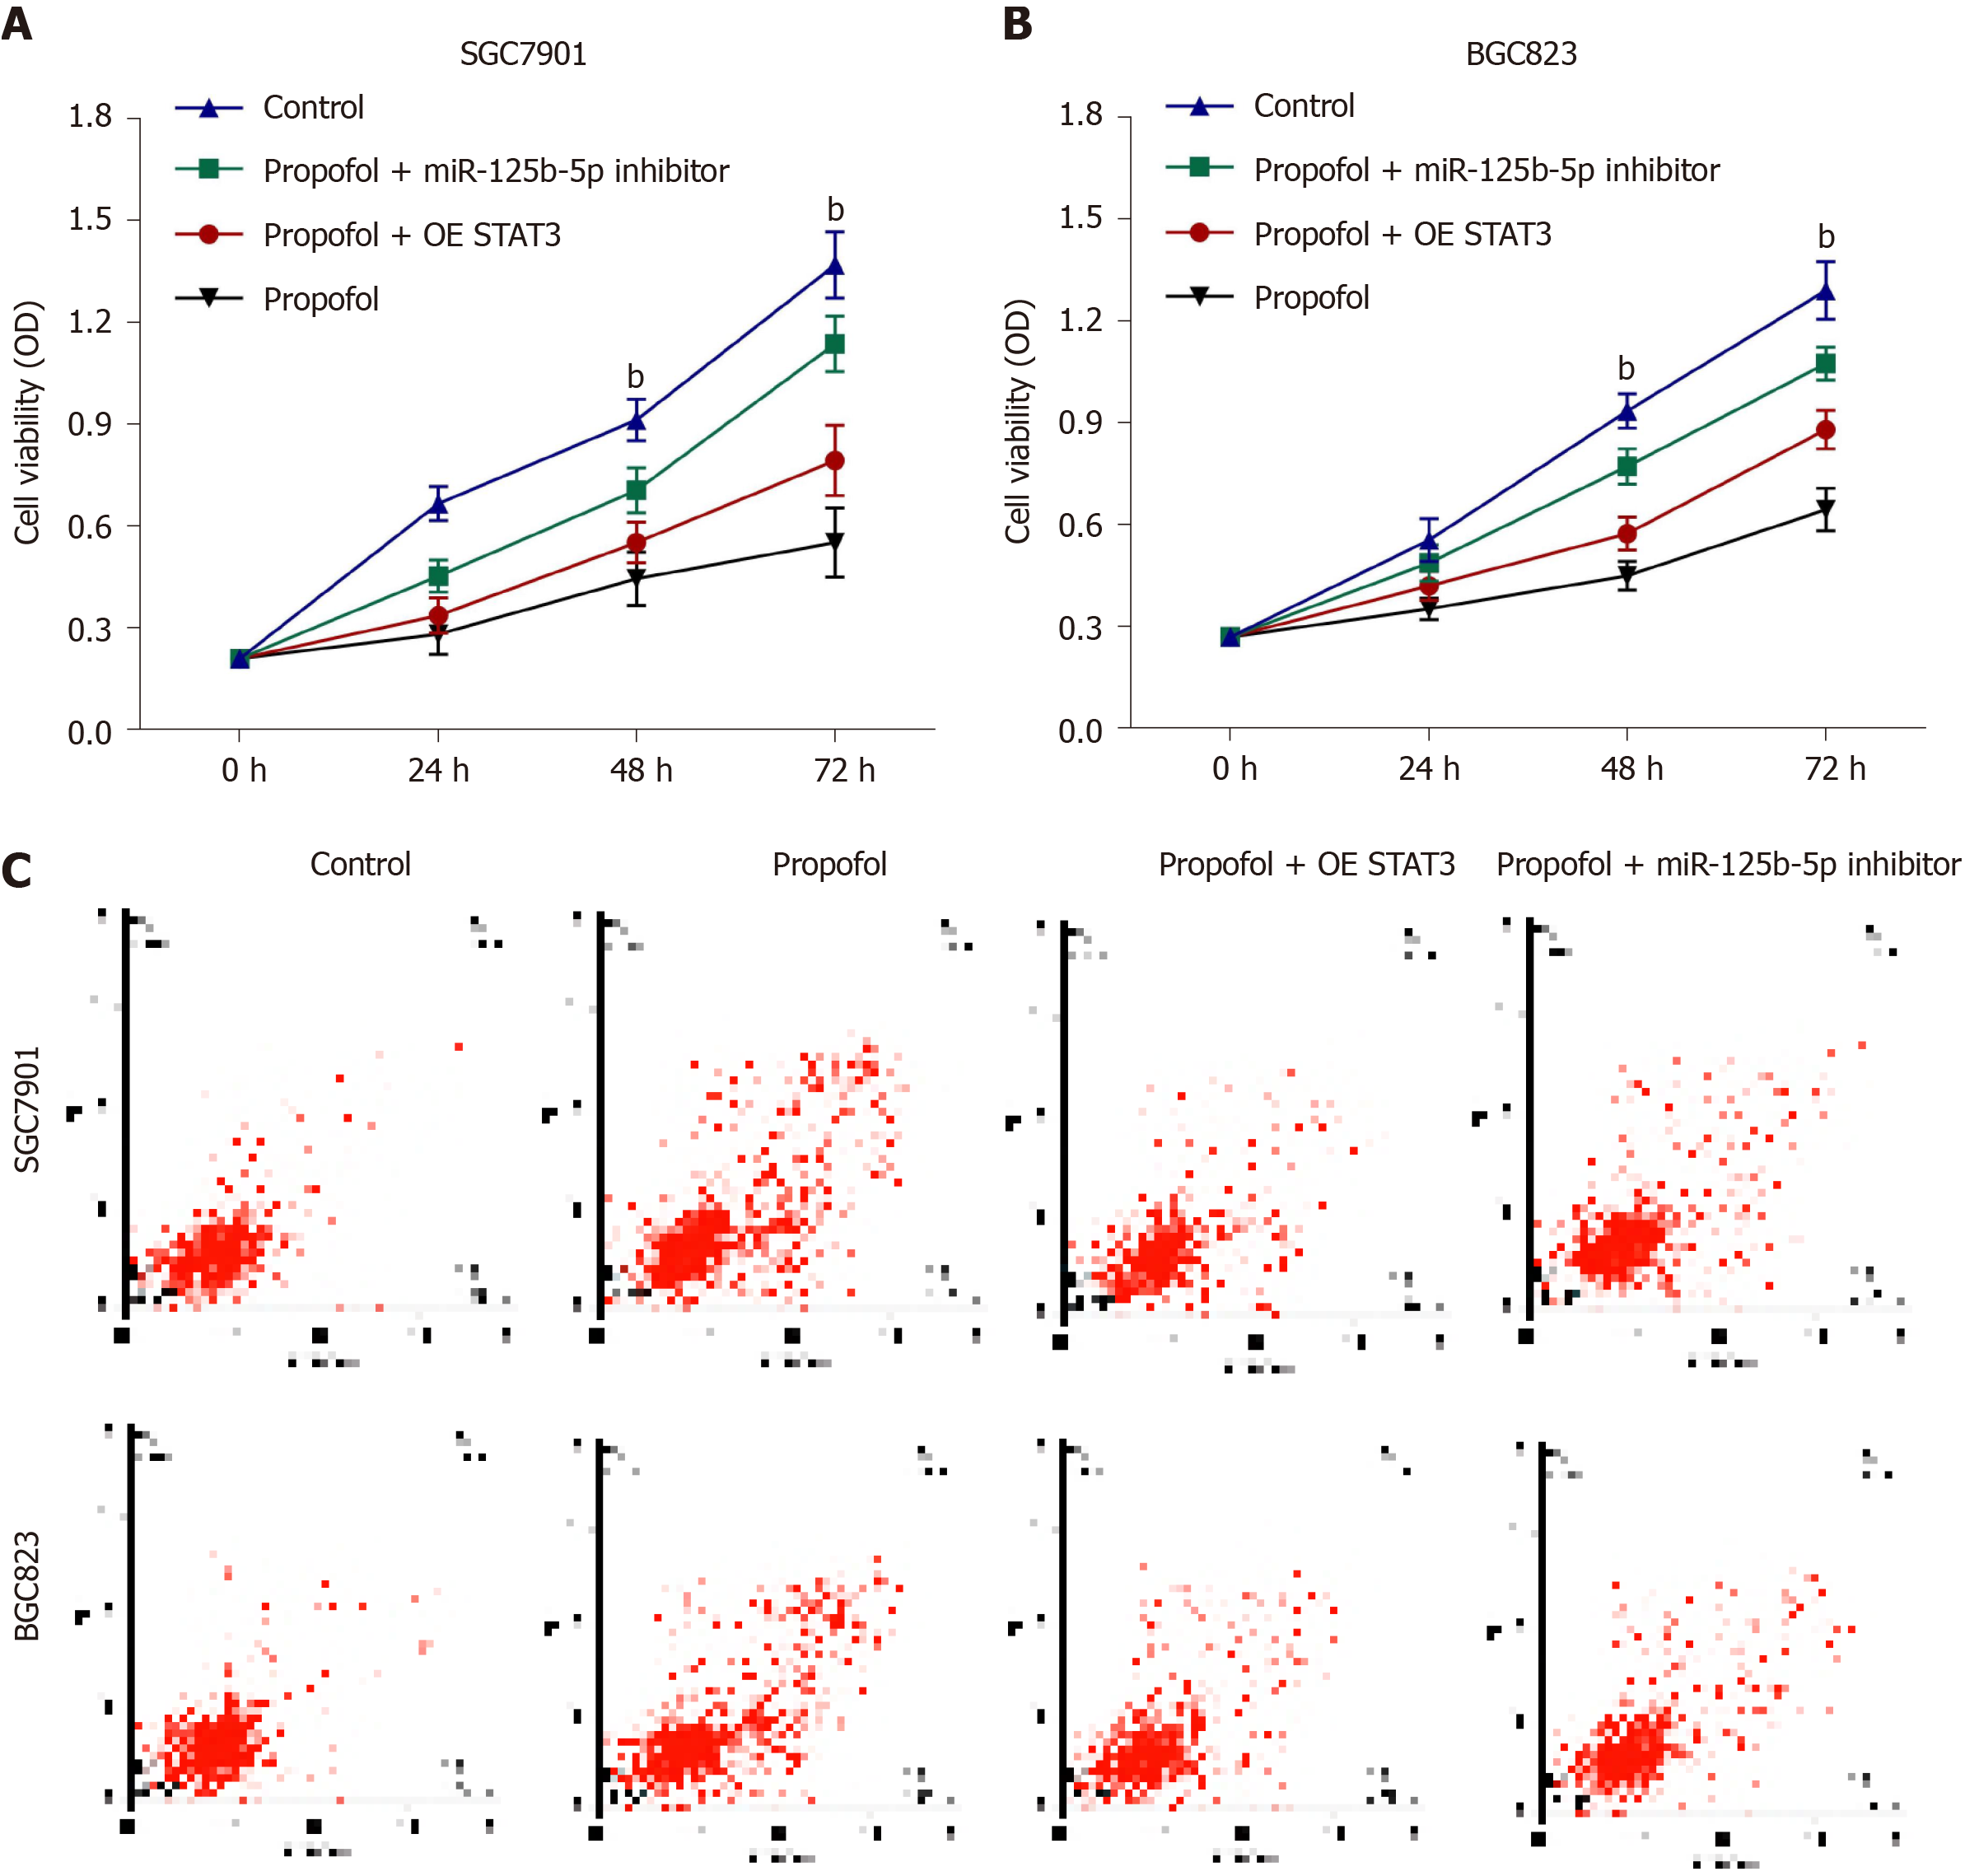
Figure 6 Propofol attenuates gastric cancer progression by miR-125b-5p/STAT3 axis.
A–C: SGC7901 and BGC823 cells were treated propofol, or cotreated with propofol and miR-125b-5p inhibitor or pcDNA.1-STAT3. A and B: MTT assays analyzed the cell viability; C: Flow cytometry measured apoptosis. n = 3, mean ± SD, bP < 0.01.
Figure 7 Propofol attenuates growth of gastric cancer cells in vivo.
The nude mice were injected with SGC7901 cells and intraperitoneally treated with propofol (50 mg/kg). A: Tumor tissues; B: Tumor volume; and C: Tumor weight; D: Expression of miR-125b-5p was analyzed by quantitative reverse transcription polymerase chain reaction. E: Protein expression of STAT3 was detected by western blotting. F: Protein expression of GPX4 and SLC7A11 was measured by western blotting. n = 5, mean ± SD, bP < 0.01.
- Citation: Liu YP, Qiu ZZ, Li XH, Li EY. Propofol induces ferroptosis and inhibits malignant phenotypes of gastric cancer cells by regulating miR-125b-5p/STAT3 axis. World J Gastrointest Oncol 2021; 13(12): 2114-2128
- URL: https://www.wjgnet.com/1948-5204/full/v13/i12/2114.htm
- DOI: https://dx.doi.org/10.4251/wjgo.v13.i12.2114


