Copyright
©The Author(s) 2020.
World J Gastrointest Oncol. Sep 15, 2020; 12(9): 1014-1030
Published online Sep 15, 2020. doi: 10.4251/wjgo.v12.i9.1014
Published online Sep 15, 2020. doi: 10.4251/wjgo.v12.i9.1014
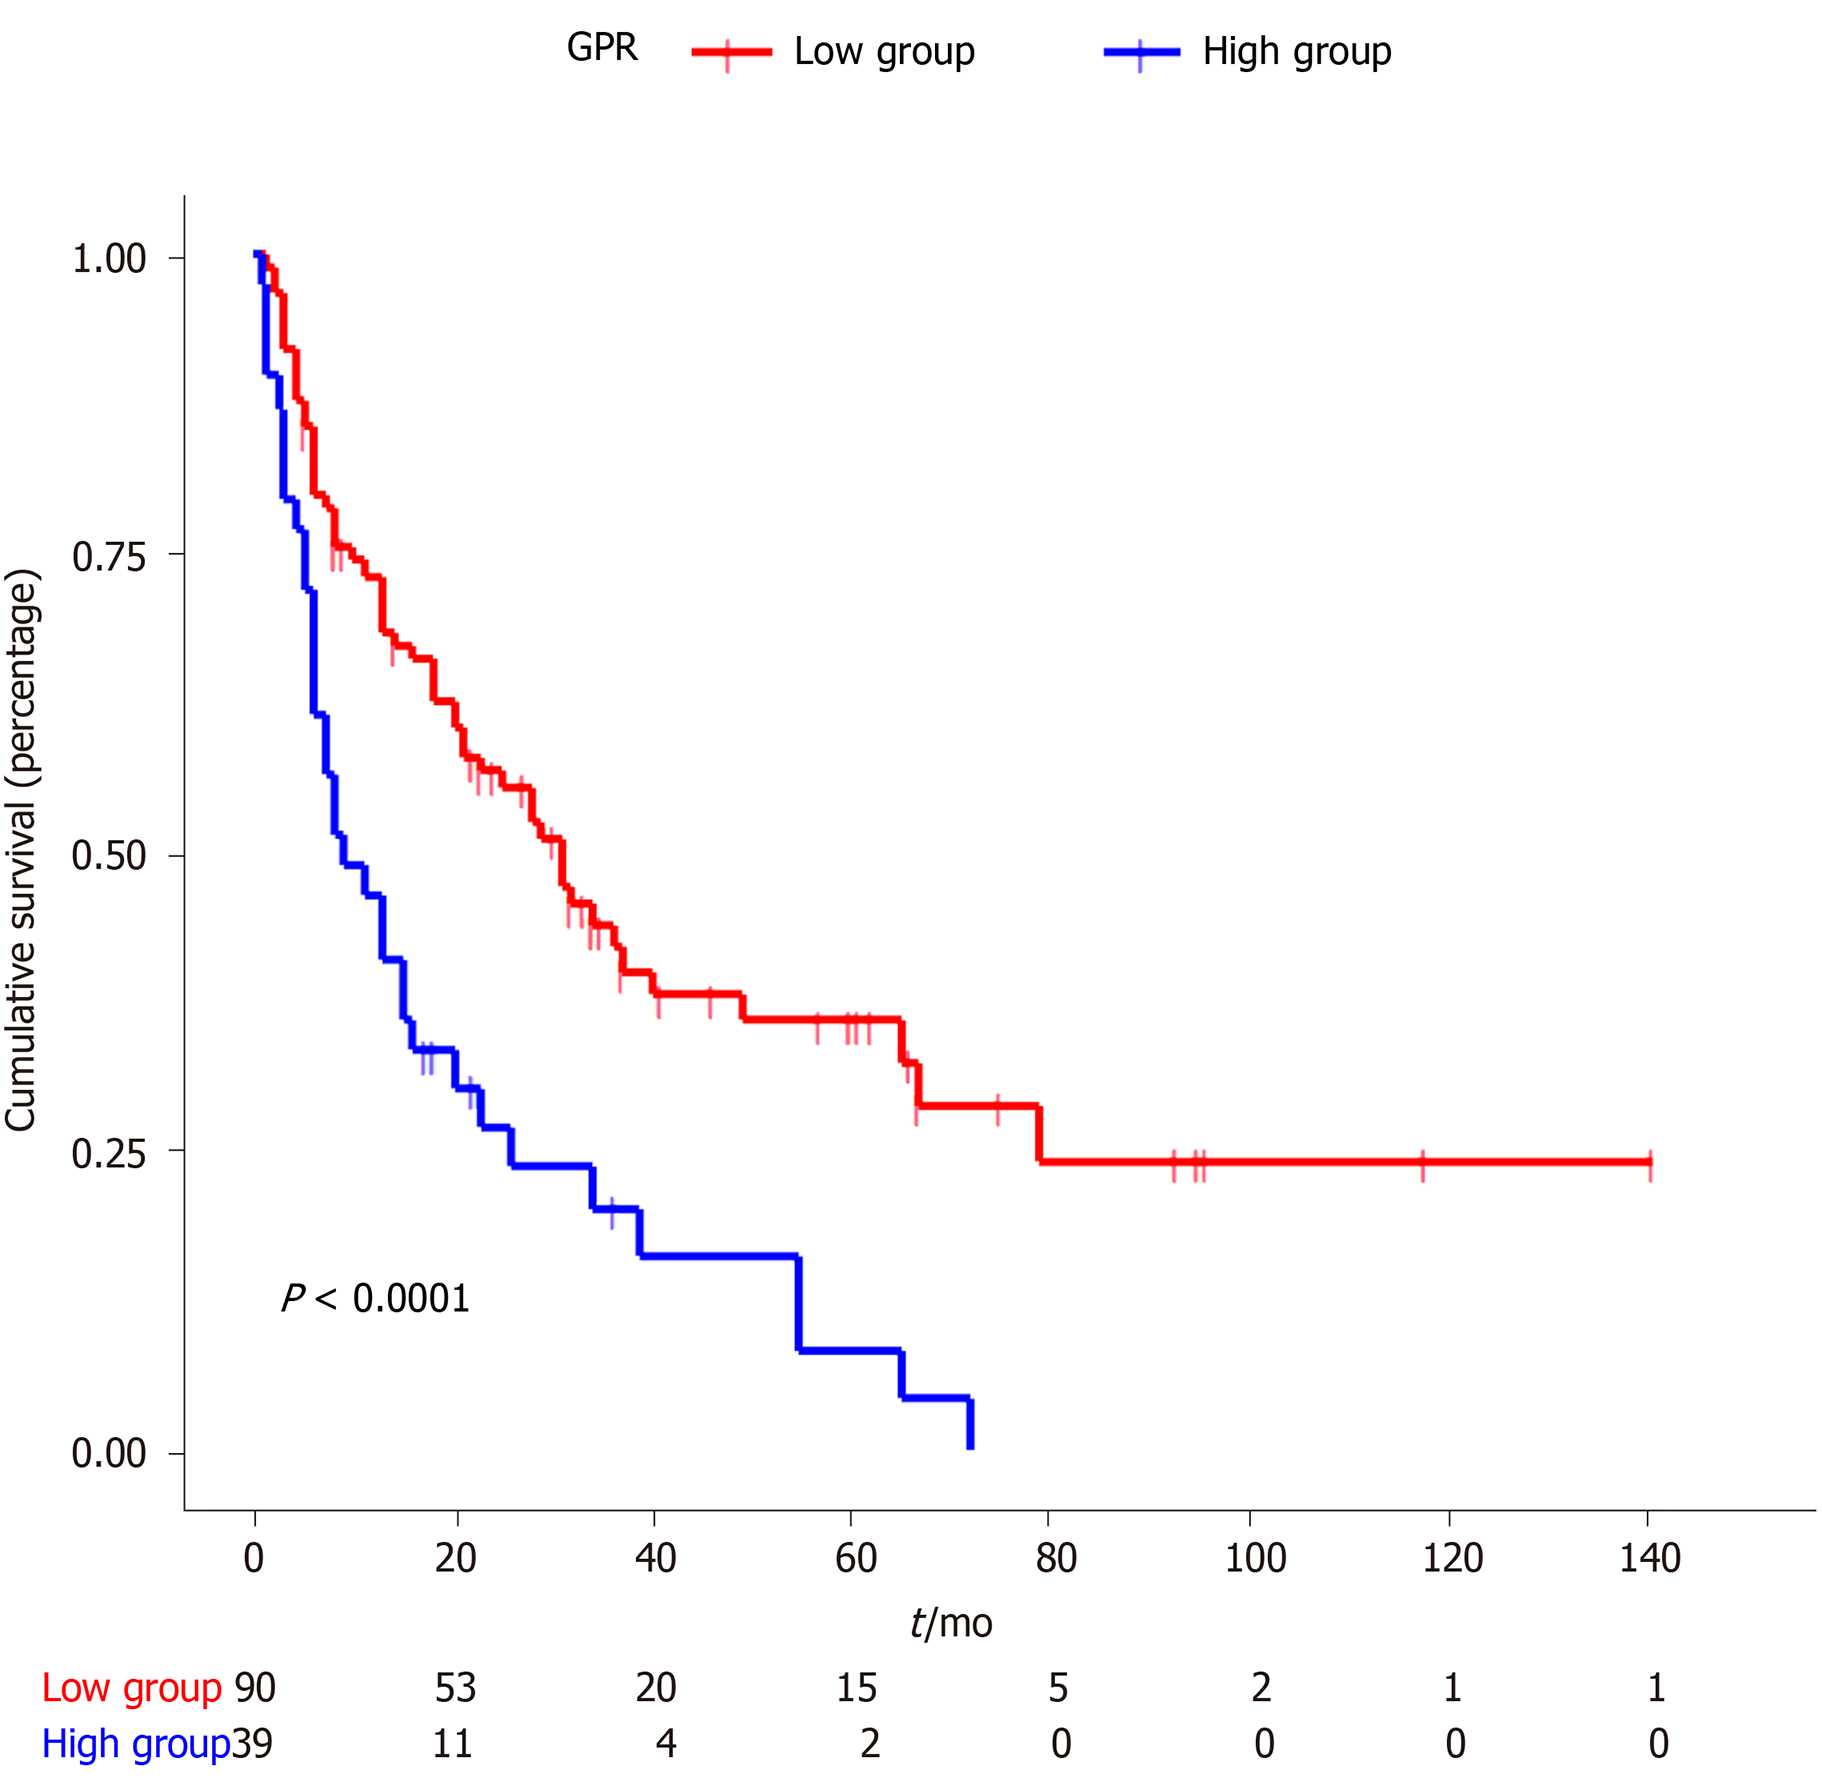
Figure 1 Kaplan-Meier curves for overall survival stratified according to Gamma-glutamyl transferase–to–platelet ratio.
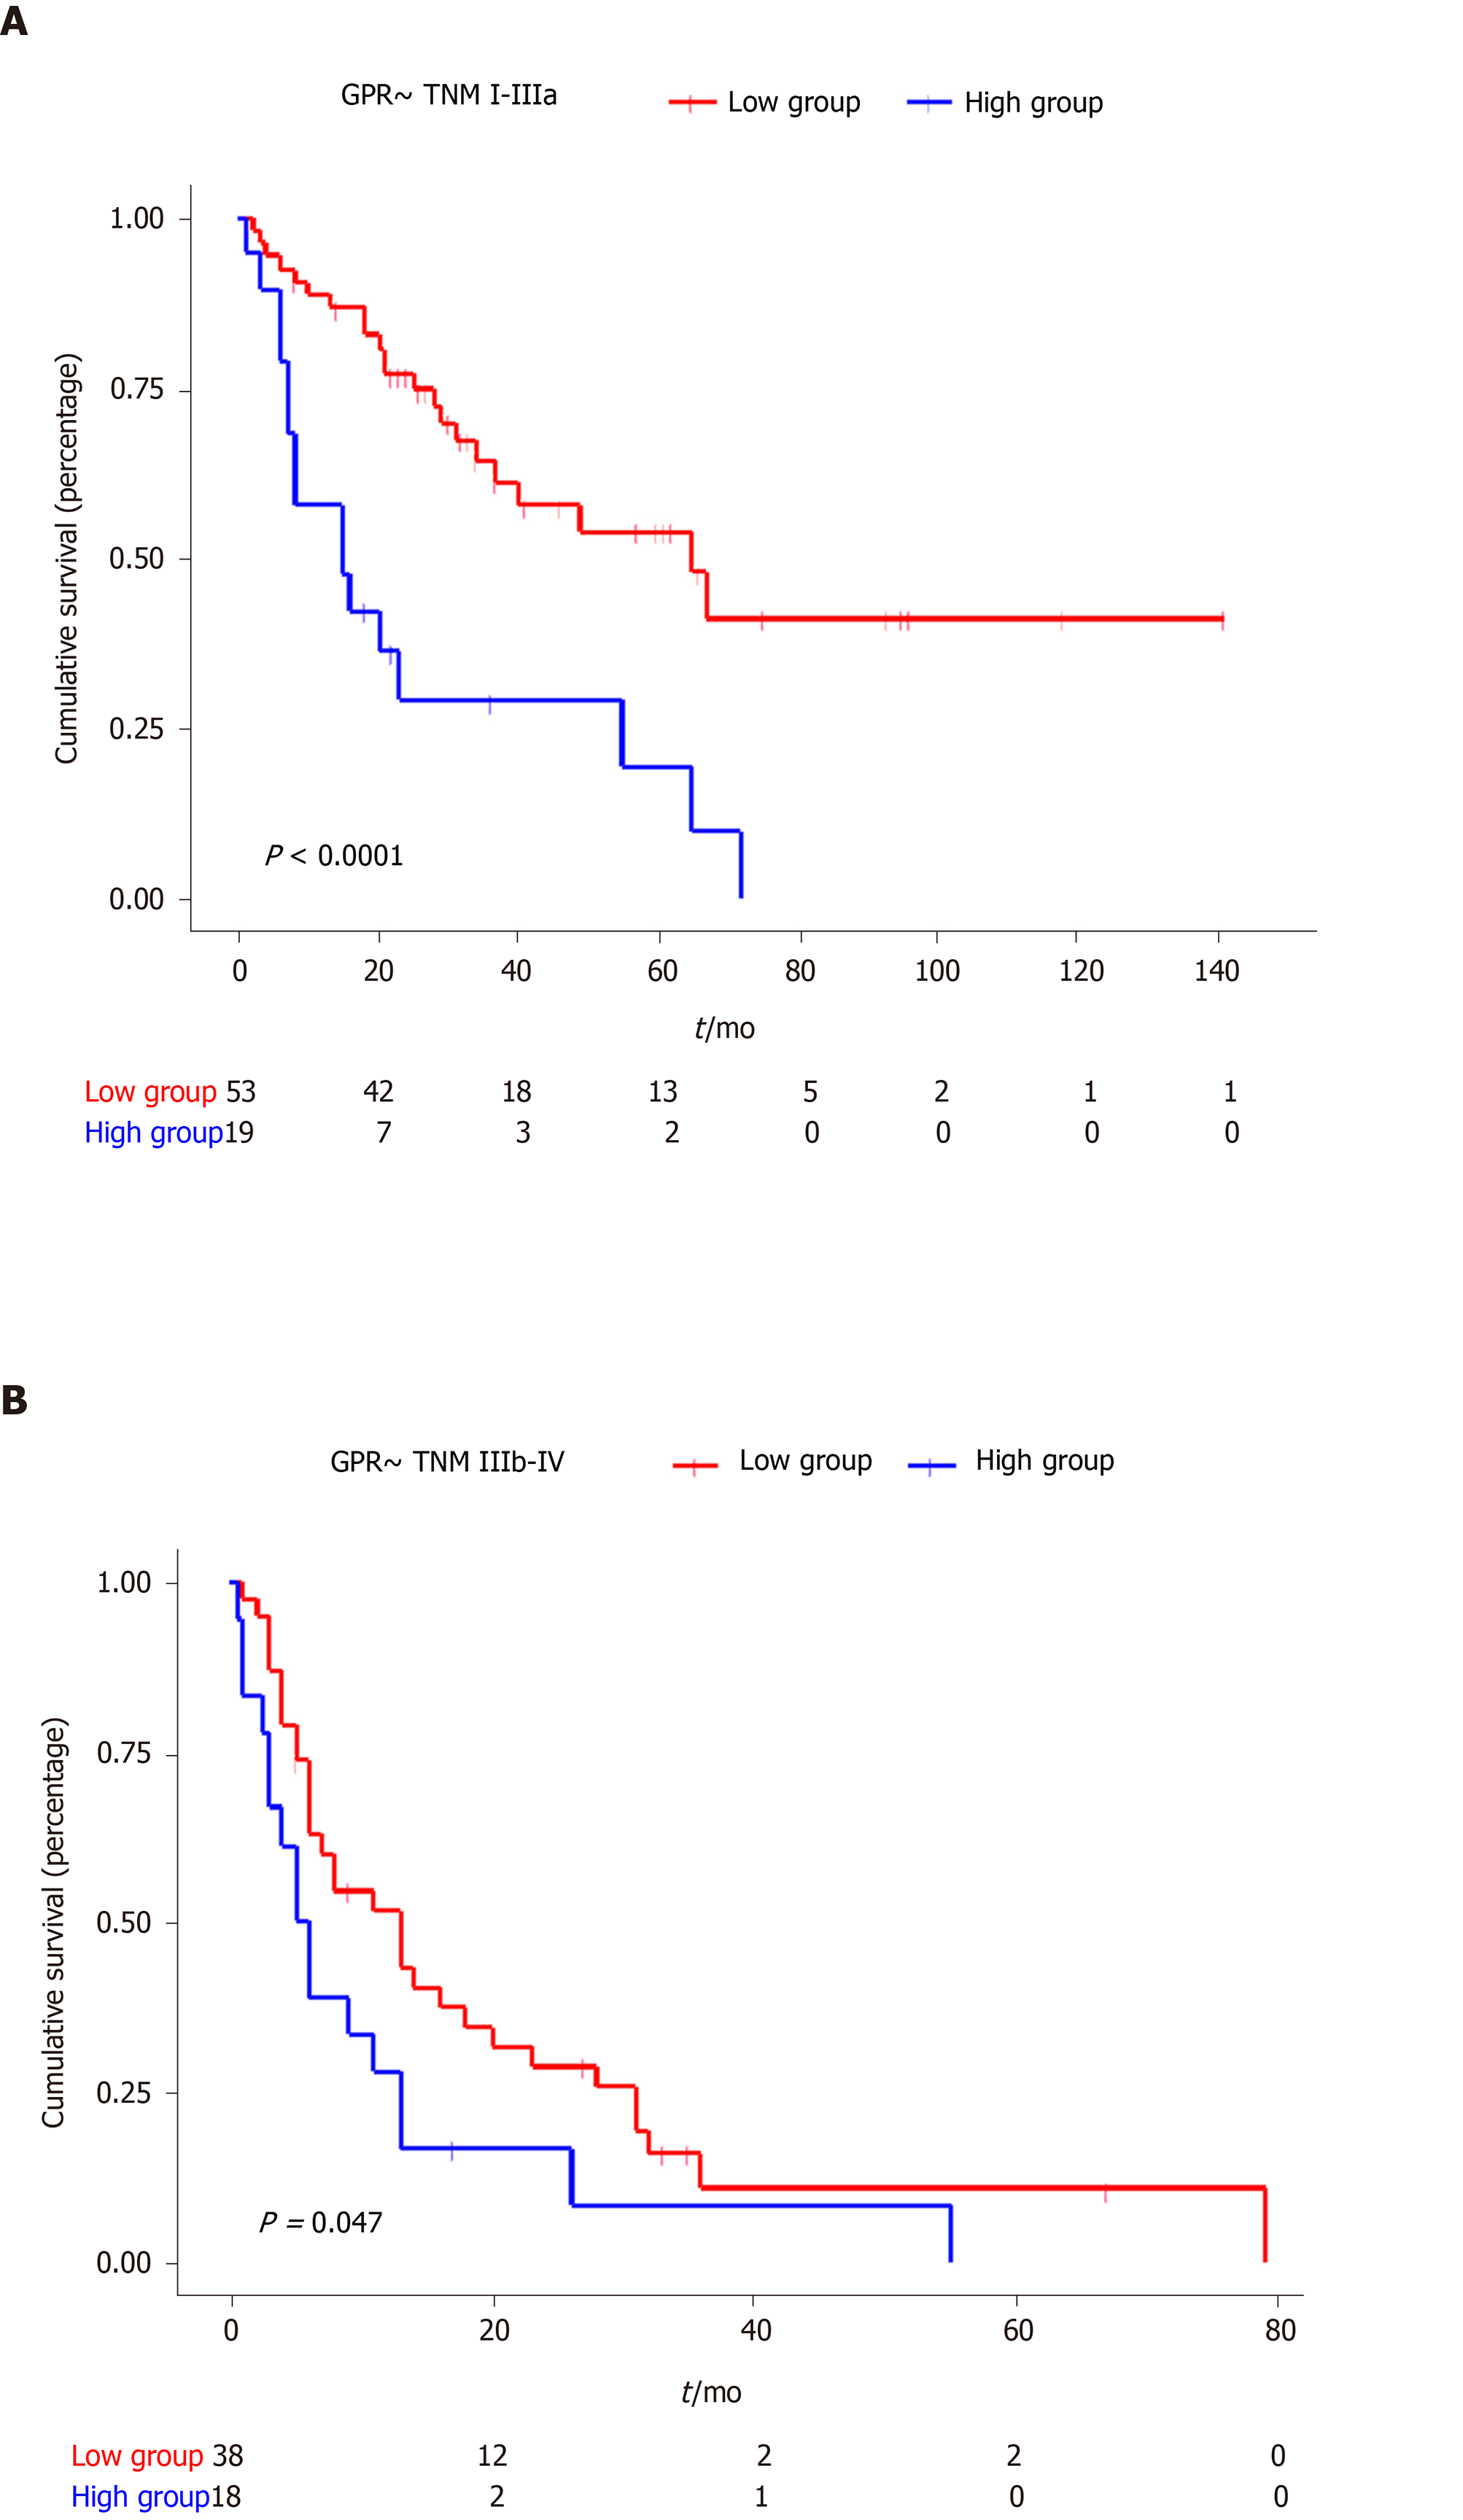
Figure 2 Kaplan-Meier curves for overall survival of different tumor–node–metastasis stages stratified according to gamma-glutamyl transferase–to–platelet ratio.
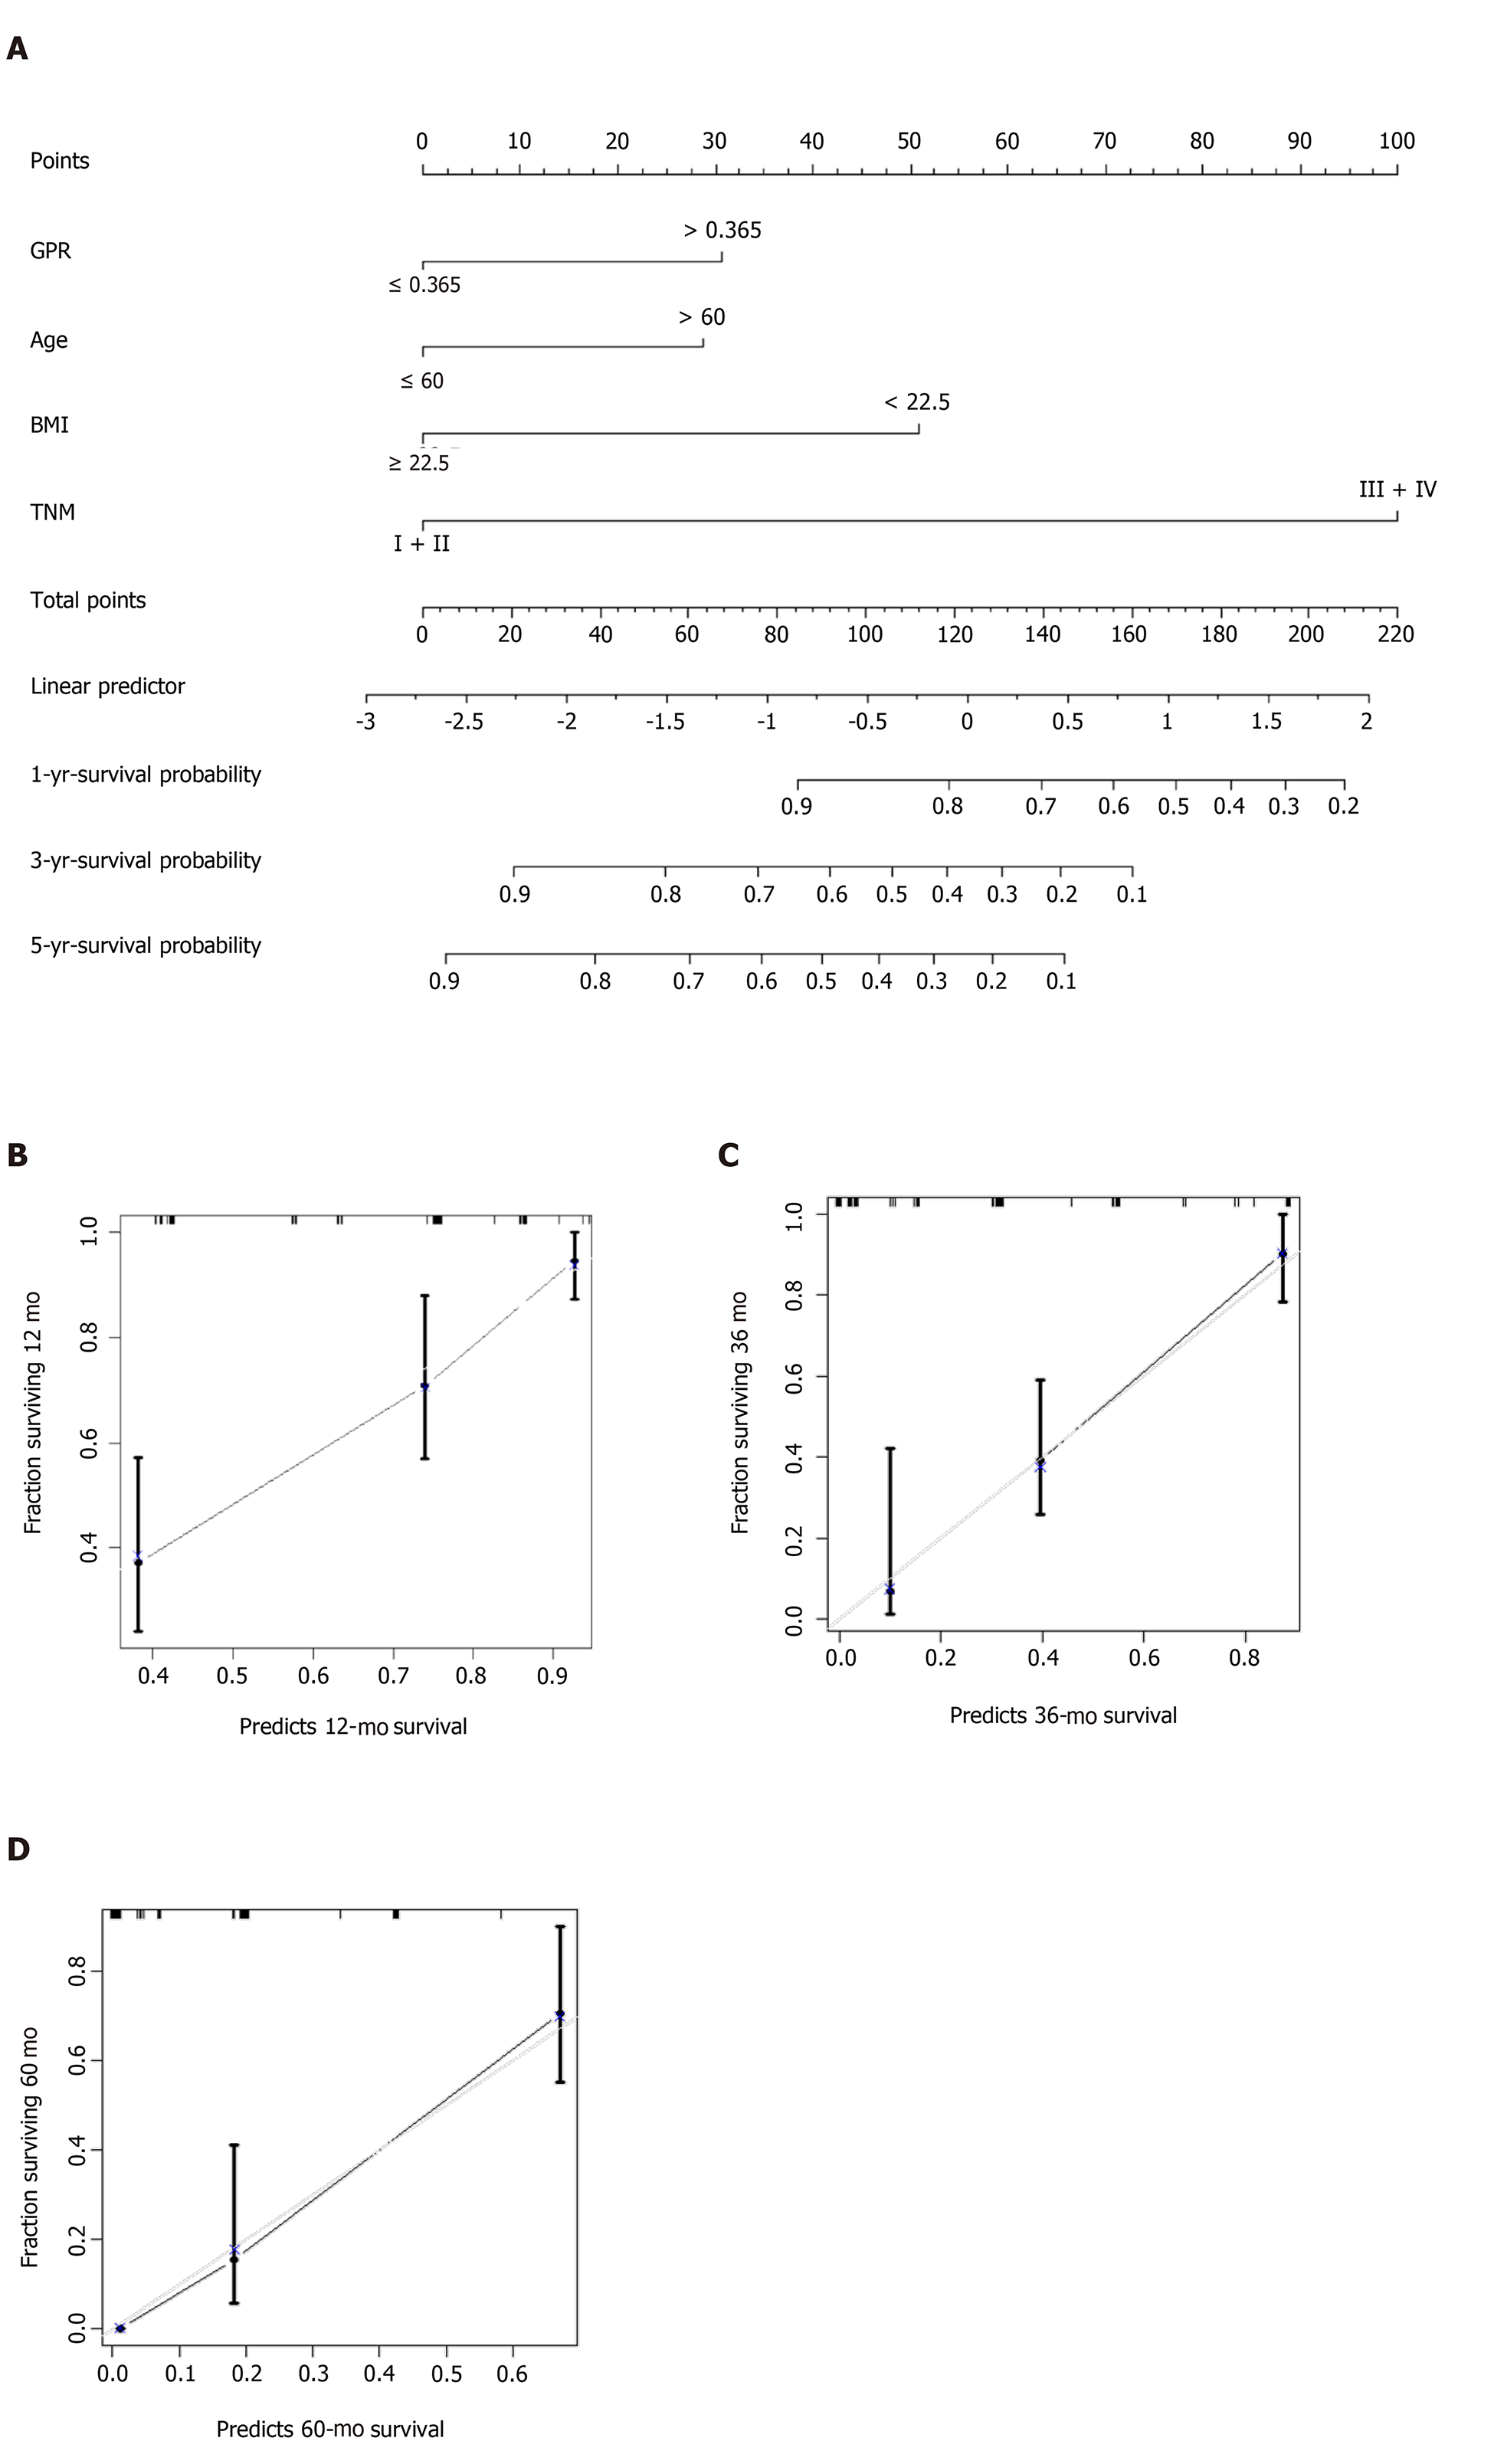
Figure 3 Prediction nomogram for survival probability.
A: Nomogram for overall survival; B: Calibration curve for the nomogram for predicting 1-year survival probability; C: Calibration curve for the nomogram for predicting 3-year survival probability; and D: Calibration curve for the nomogram for predicting 5-year survival probability.
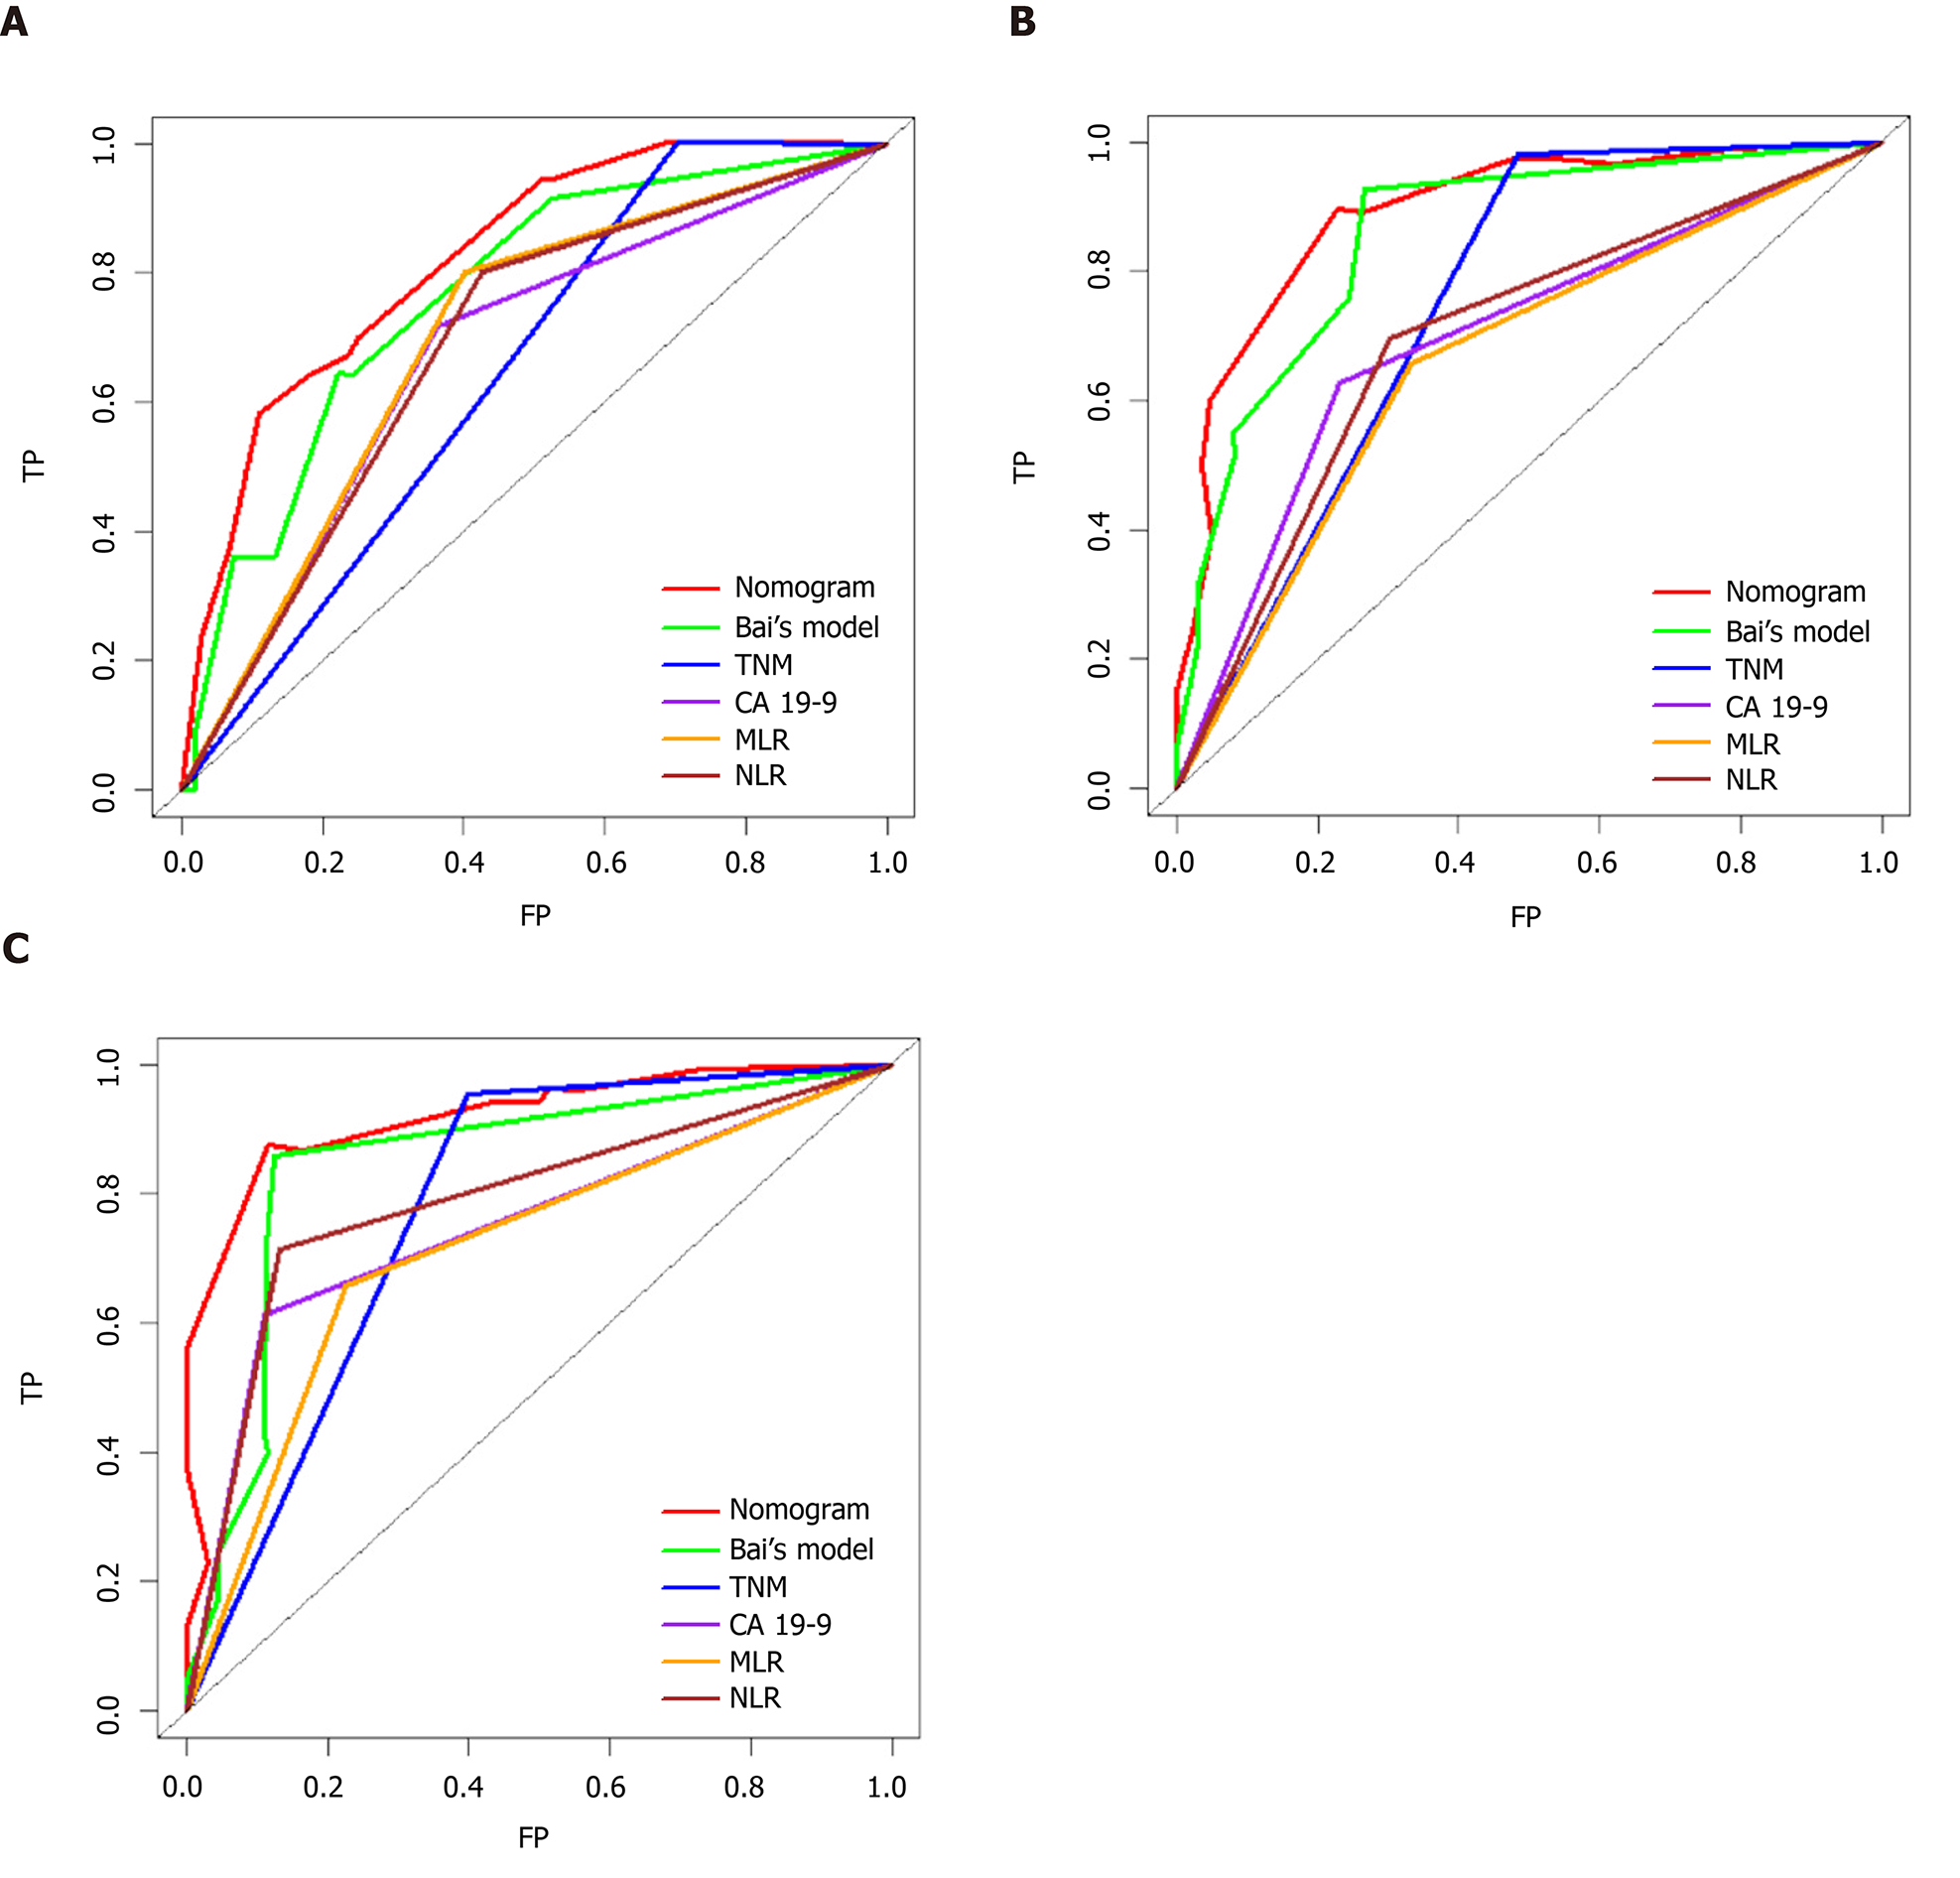
Figure 4 Time-dependent receiver operating characteristic curves for the nomogram.
Bai et al[34]’s model1, tumor–node–metastasis staging, CA 19-9, monocyte–to–lymphocyte ratio, and neutrophil–to–lymphocyte ratio. A: Time-dependent receiver operating characteristic (ROC) curves at 1 year; B: Time-dependent ROC curves at 3 years; and C: Time-dependent ROC curves at 5 years. 1Bai’s model: Nomogram based on jaundice, CA19-9, tumor–node–metastasis stage, and R status[34].
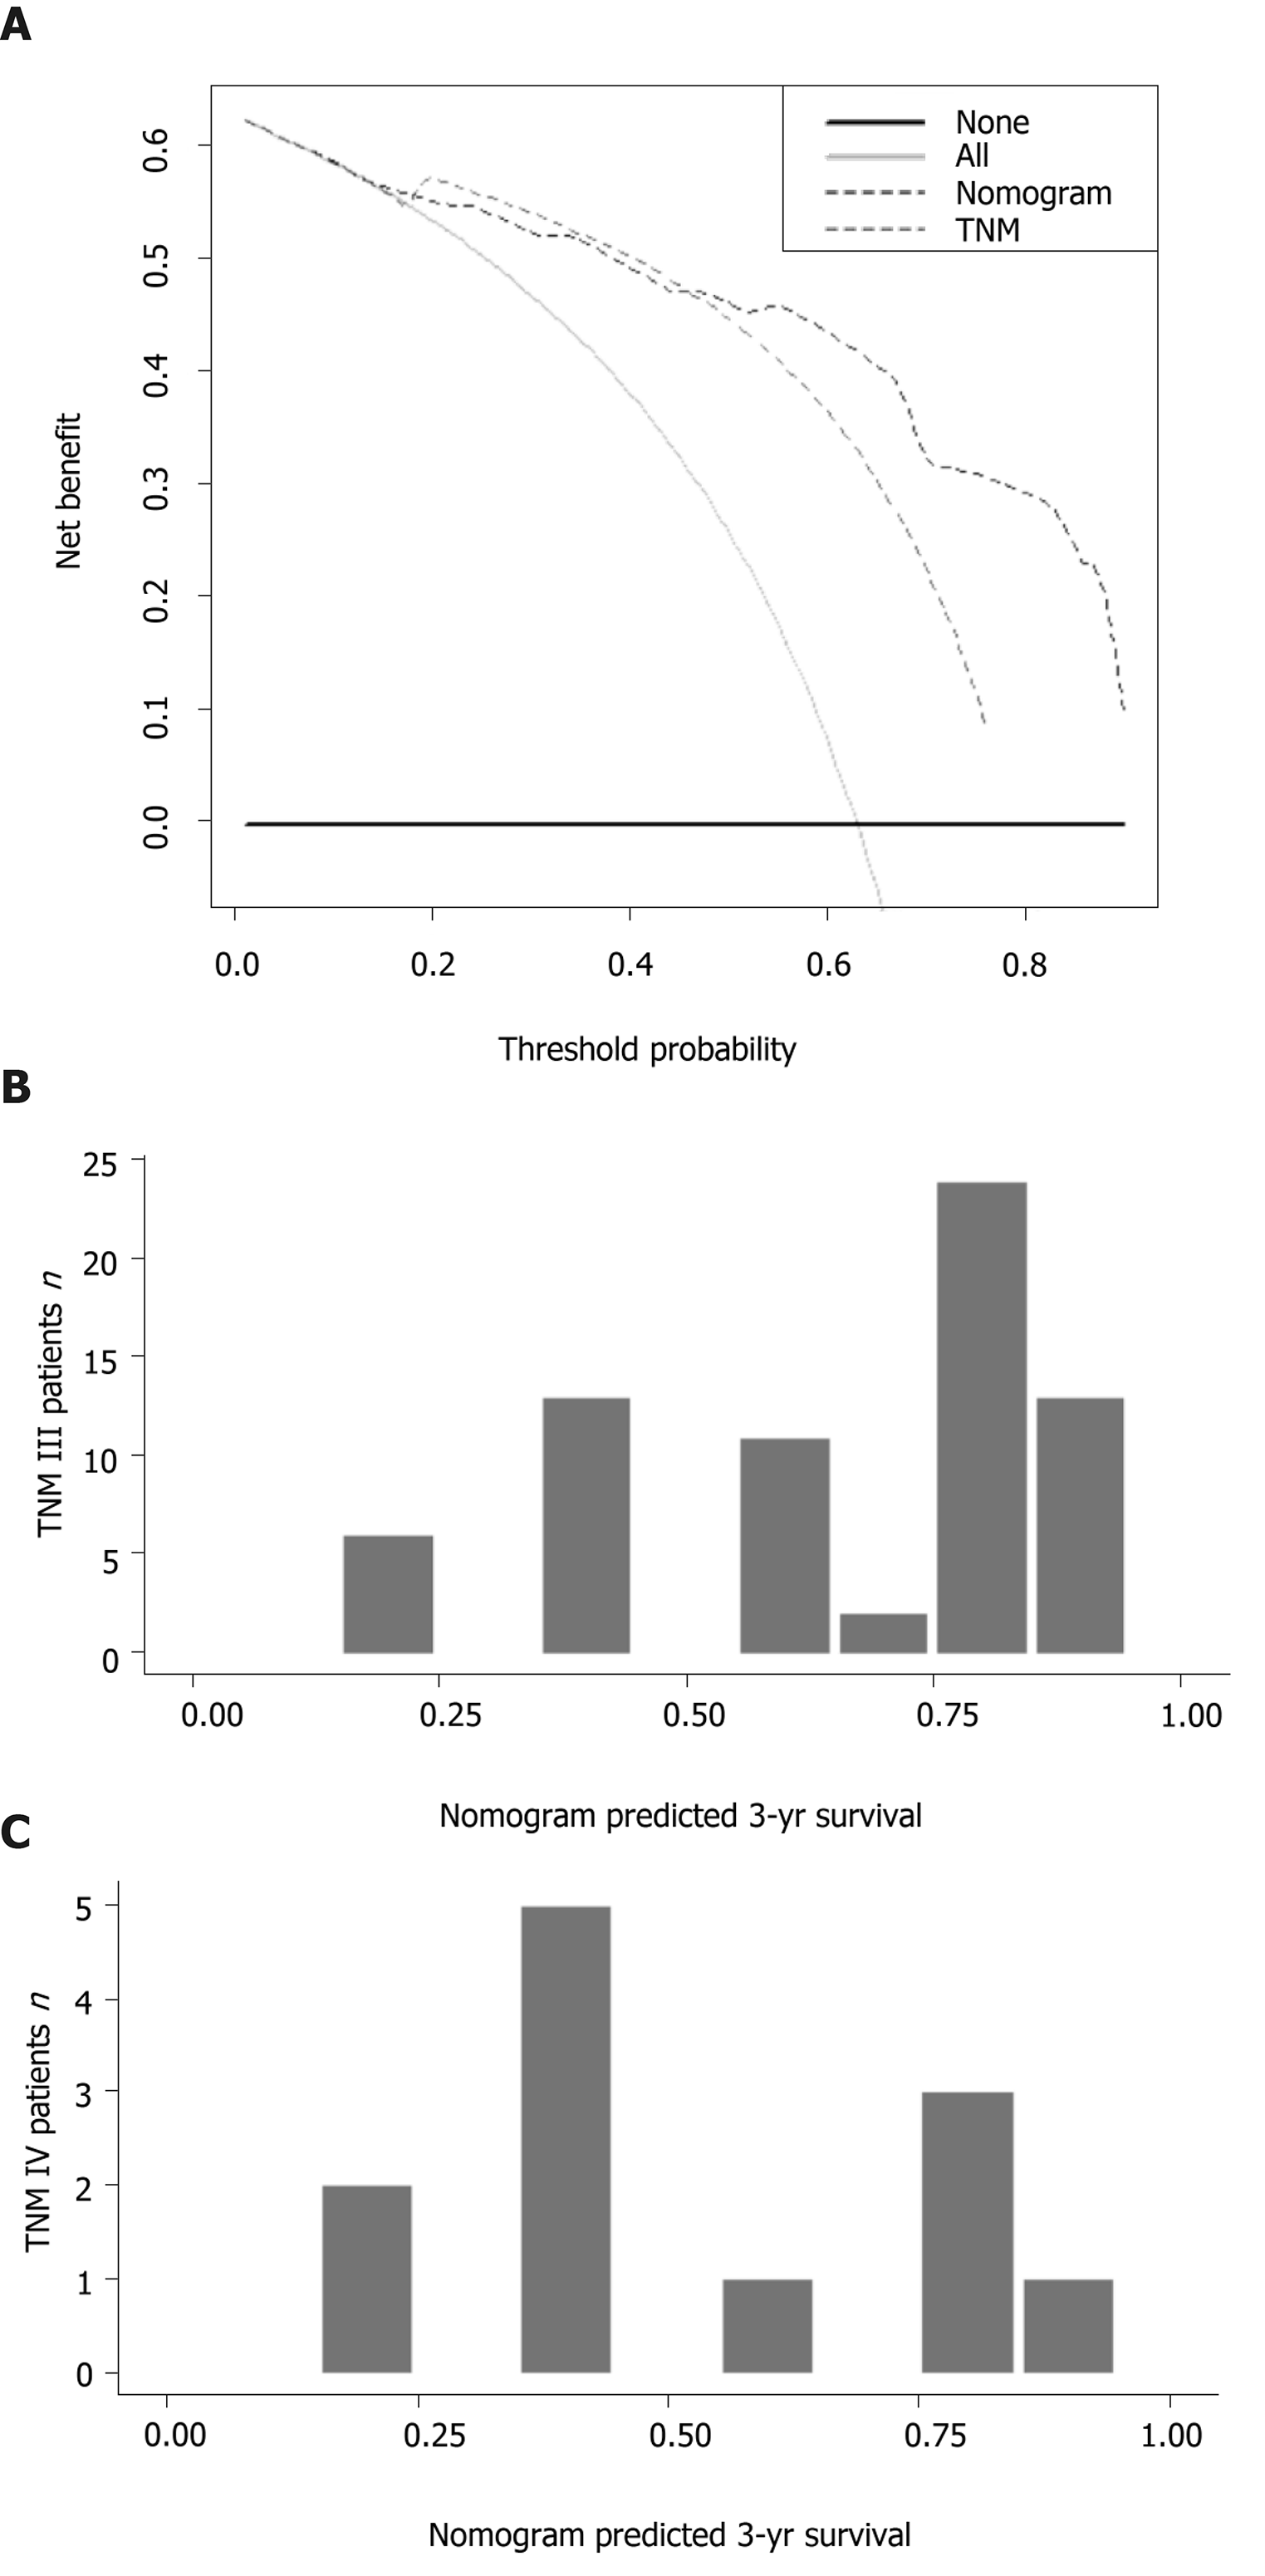
Figure 5 Comparisons of the nomogram with the American Joint Committee on Cancer tumor–node–metastasis stage model.
A: Decision curve analysis of the nomogram and tumor–node–metastasis stage model for 3-year survival probability; B: Comparison of the nomogram prediction with tumor–node–metastasis staging.
- Citation: Sun LJ, Guan A, Xu WY, Liu MX, Yin HH, Jin B, Xu G, Xie FH, Xu HF, Du SD, Xu YY, Zhao HT, Lu X, Sang XT, Yang HY, Mao YL. γ-glutamyl transferase-to-platelet ratio based nomogram predicting overall survival of gallbladder carcinoma. World J Gastrointest Oncol 2020; 12(9): 1014-1030
- URL: https://www.wjgnet.com/1948-5204/full/v12/i9/1014.htm
- DOI: https://dx.doi.org/10.4251/wjgo.v12.i9.1014


