Copyright
©The Author(s) 2020.
World J Gastrointest Oncol. Aug 15, 2020; 12(8): 857-876
Published online Aug 15, 2020. doi: 10.4251/wjgo.v12.i8.857
Published online Aug 15, 2020. doi: 10.4251/wjgo.v12.i8.857
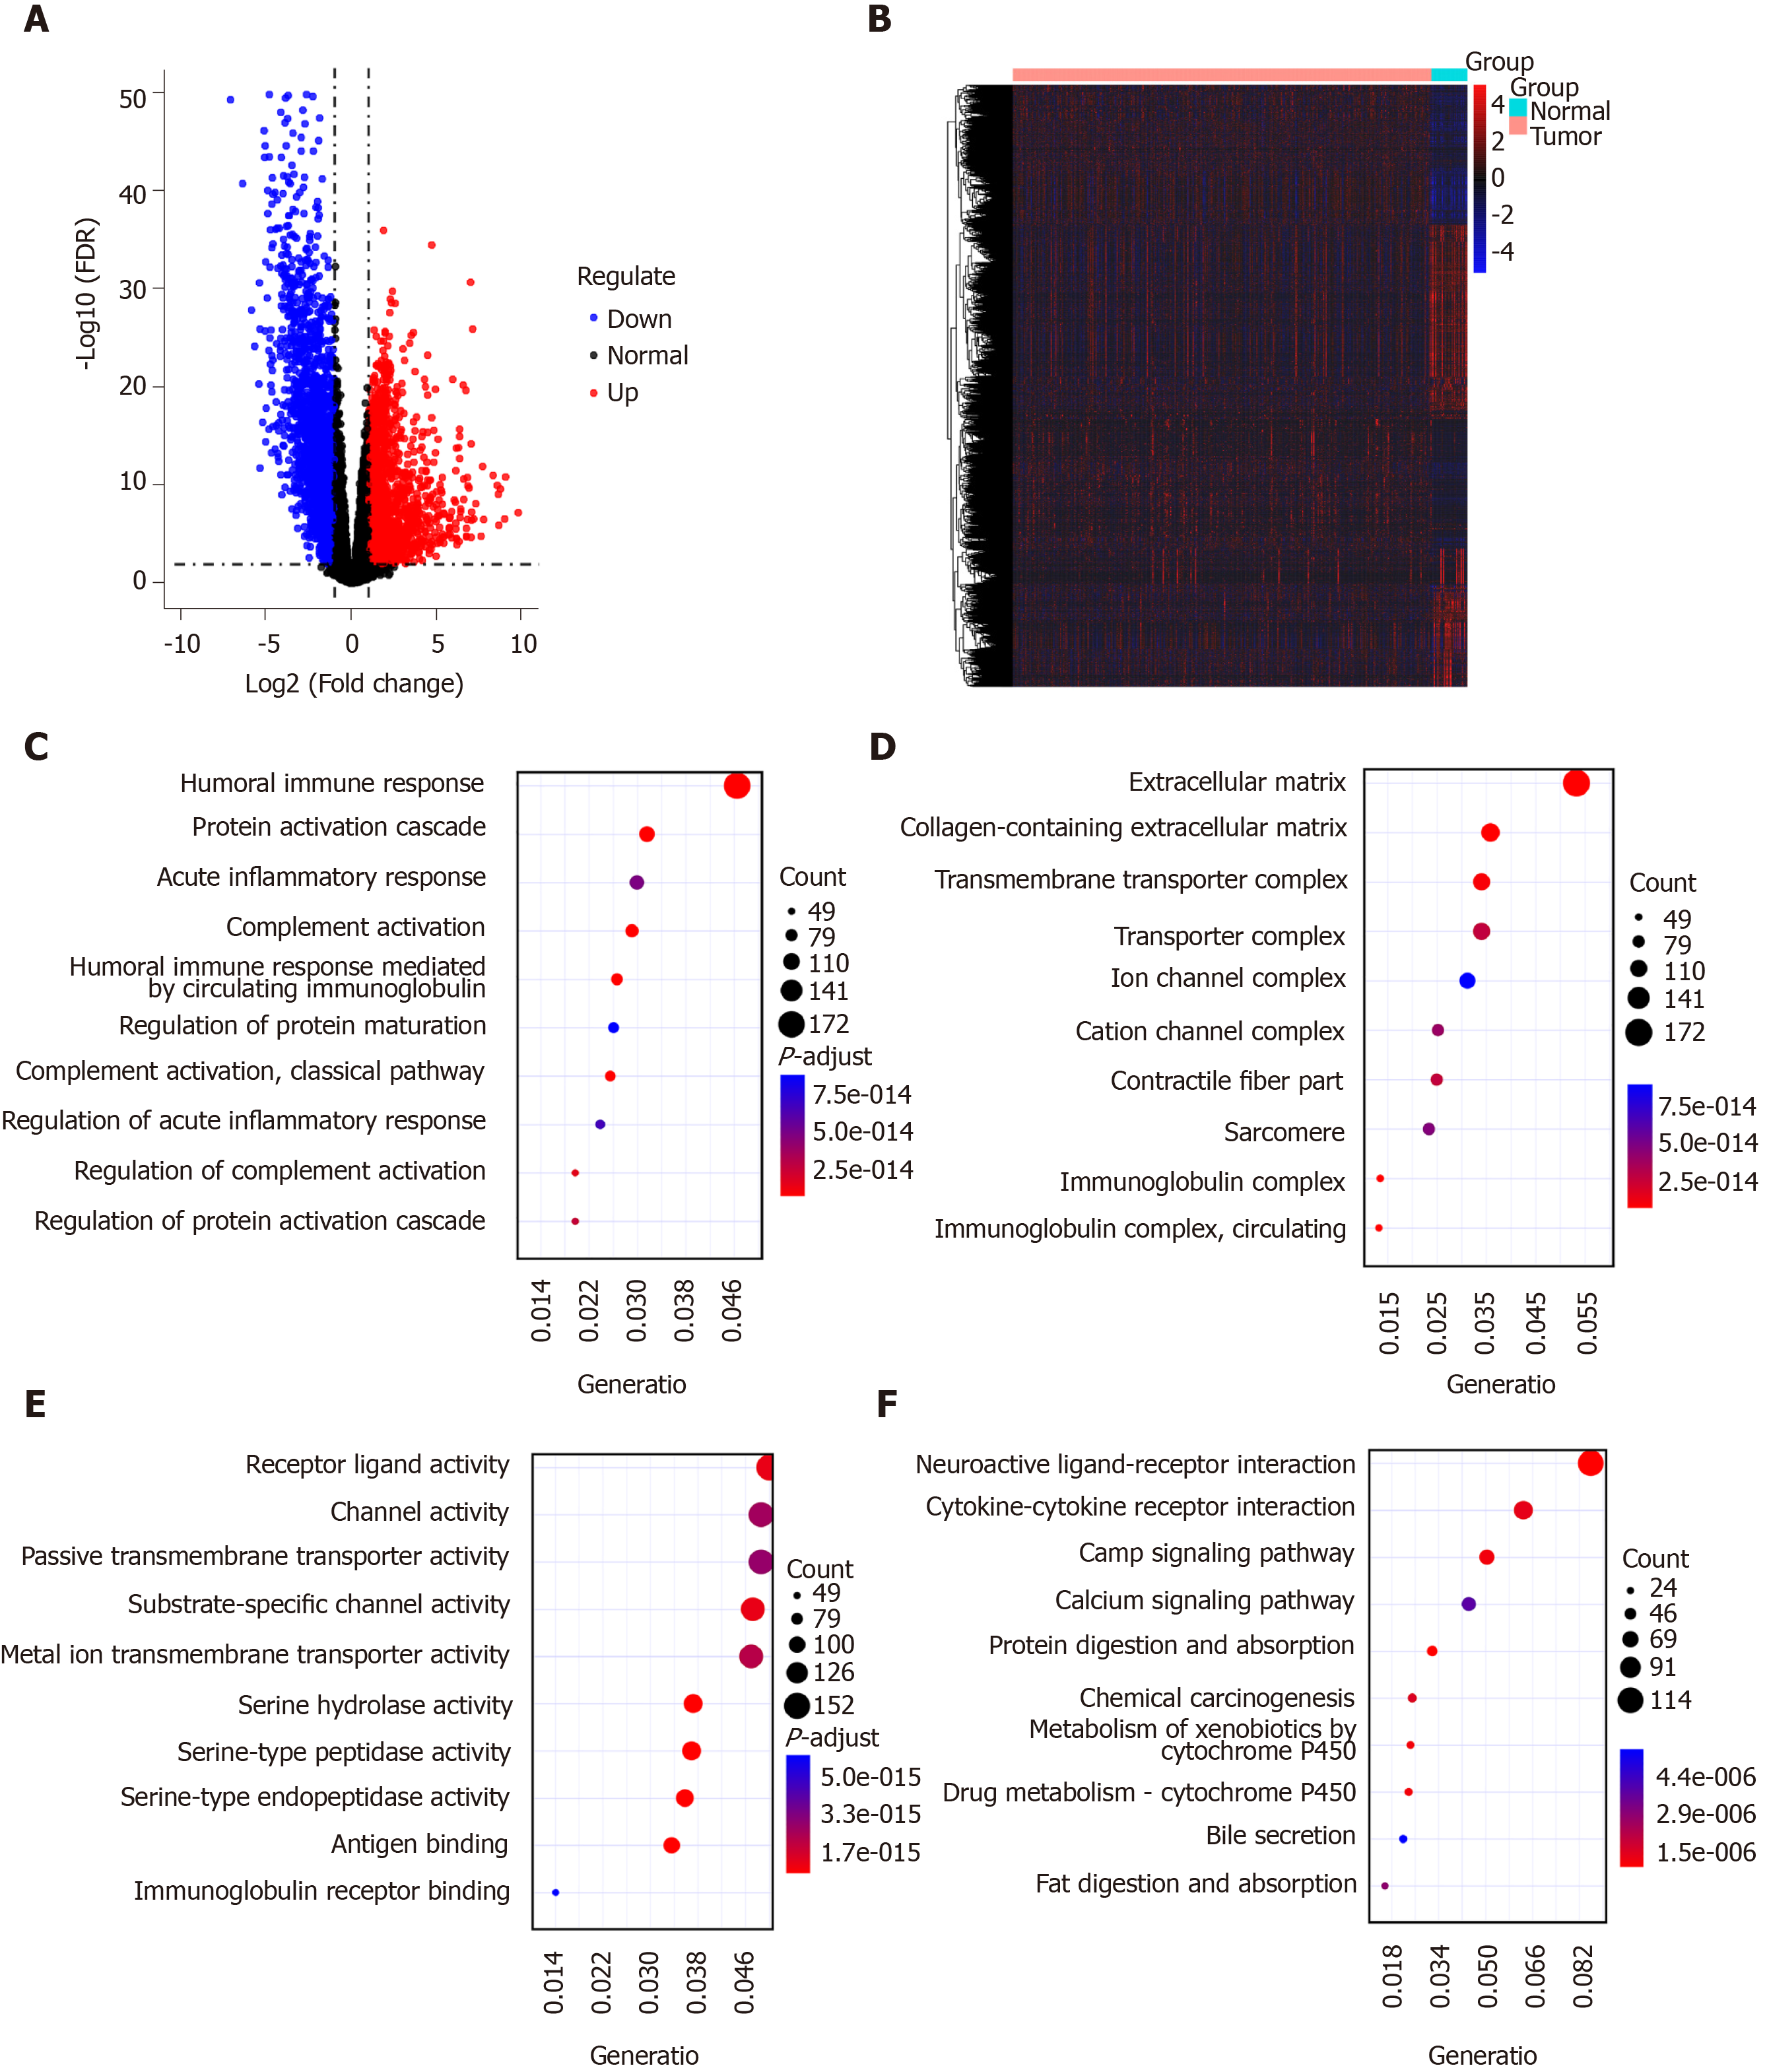
Figure 1 Identification of differentially expressed genes for gastric cancer.
A and B: Volcano plot (A) and heatmap (B) showing differentially expressed genes (DEGs) between gastric cancer tissues and normal tissues. Blue represents down-regulation and red represents up-regulation; C-E: Gene Ontology enrichment results of the top ten DEGs including biological processes (C), cellular component (D), and molecular function (E); F: Kyoto Encyclopedia of Genes and Genomes enrichment results of the top ten DEGs.
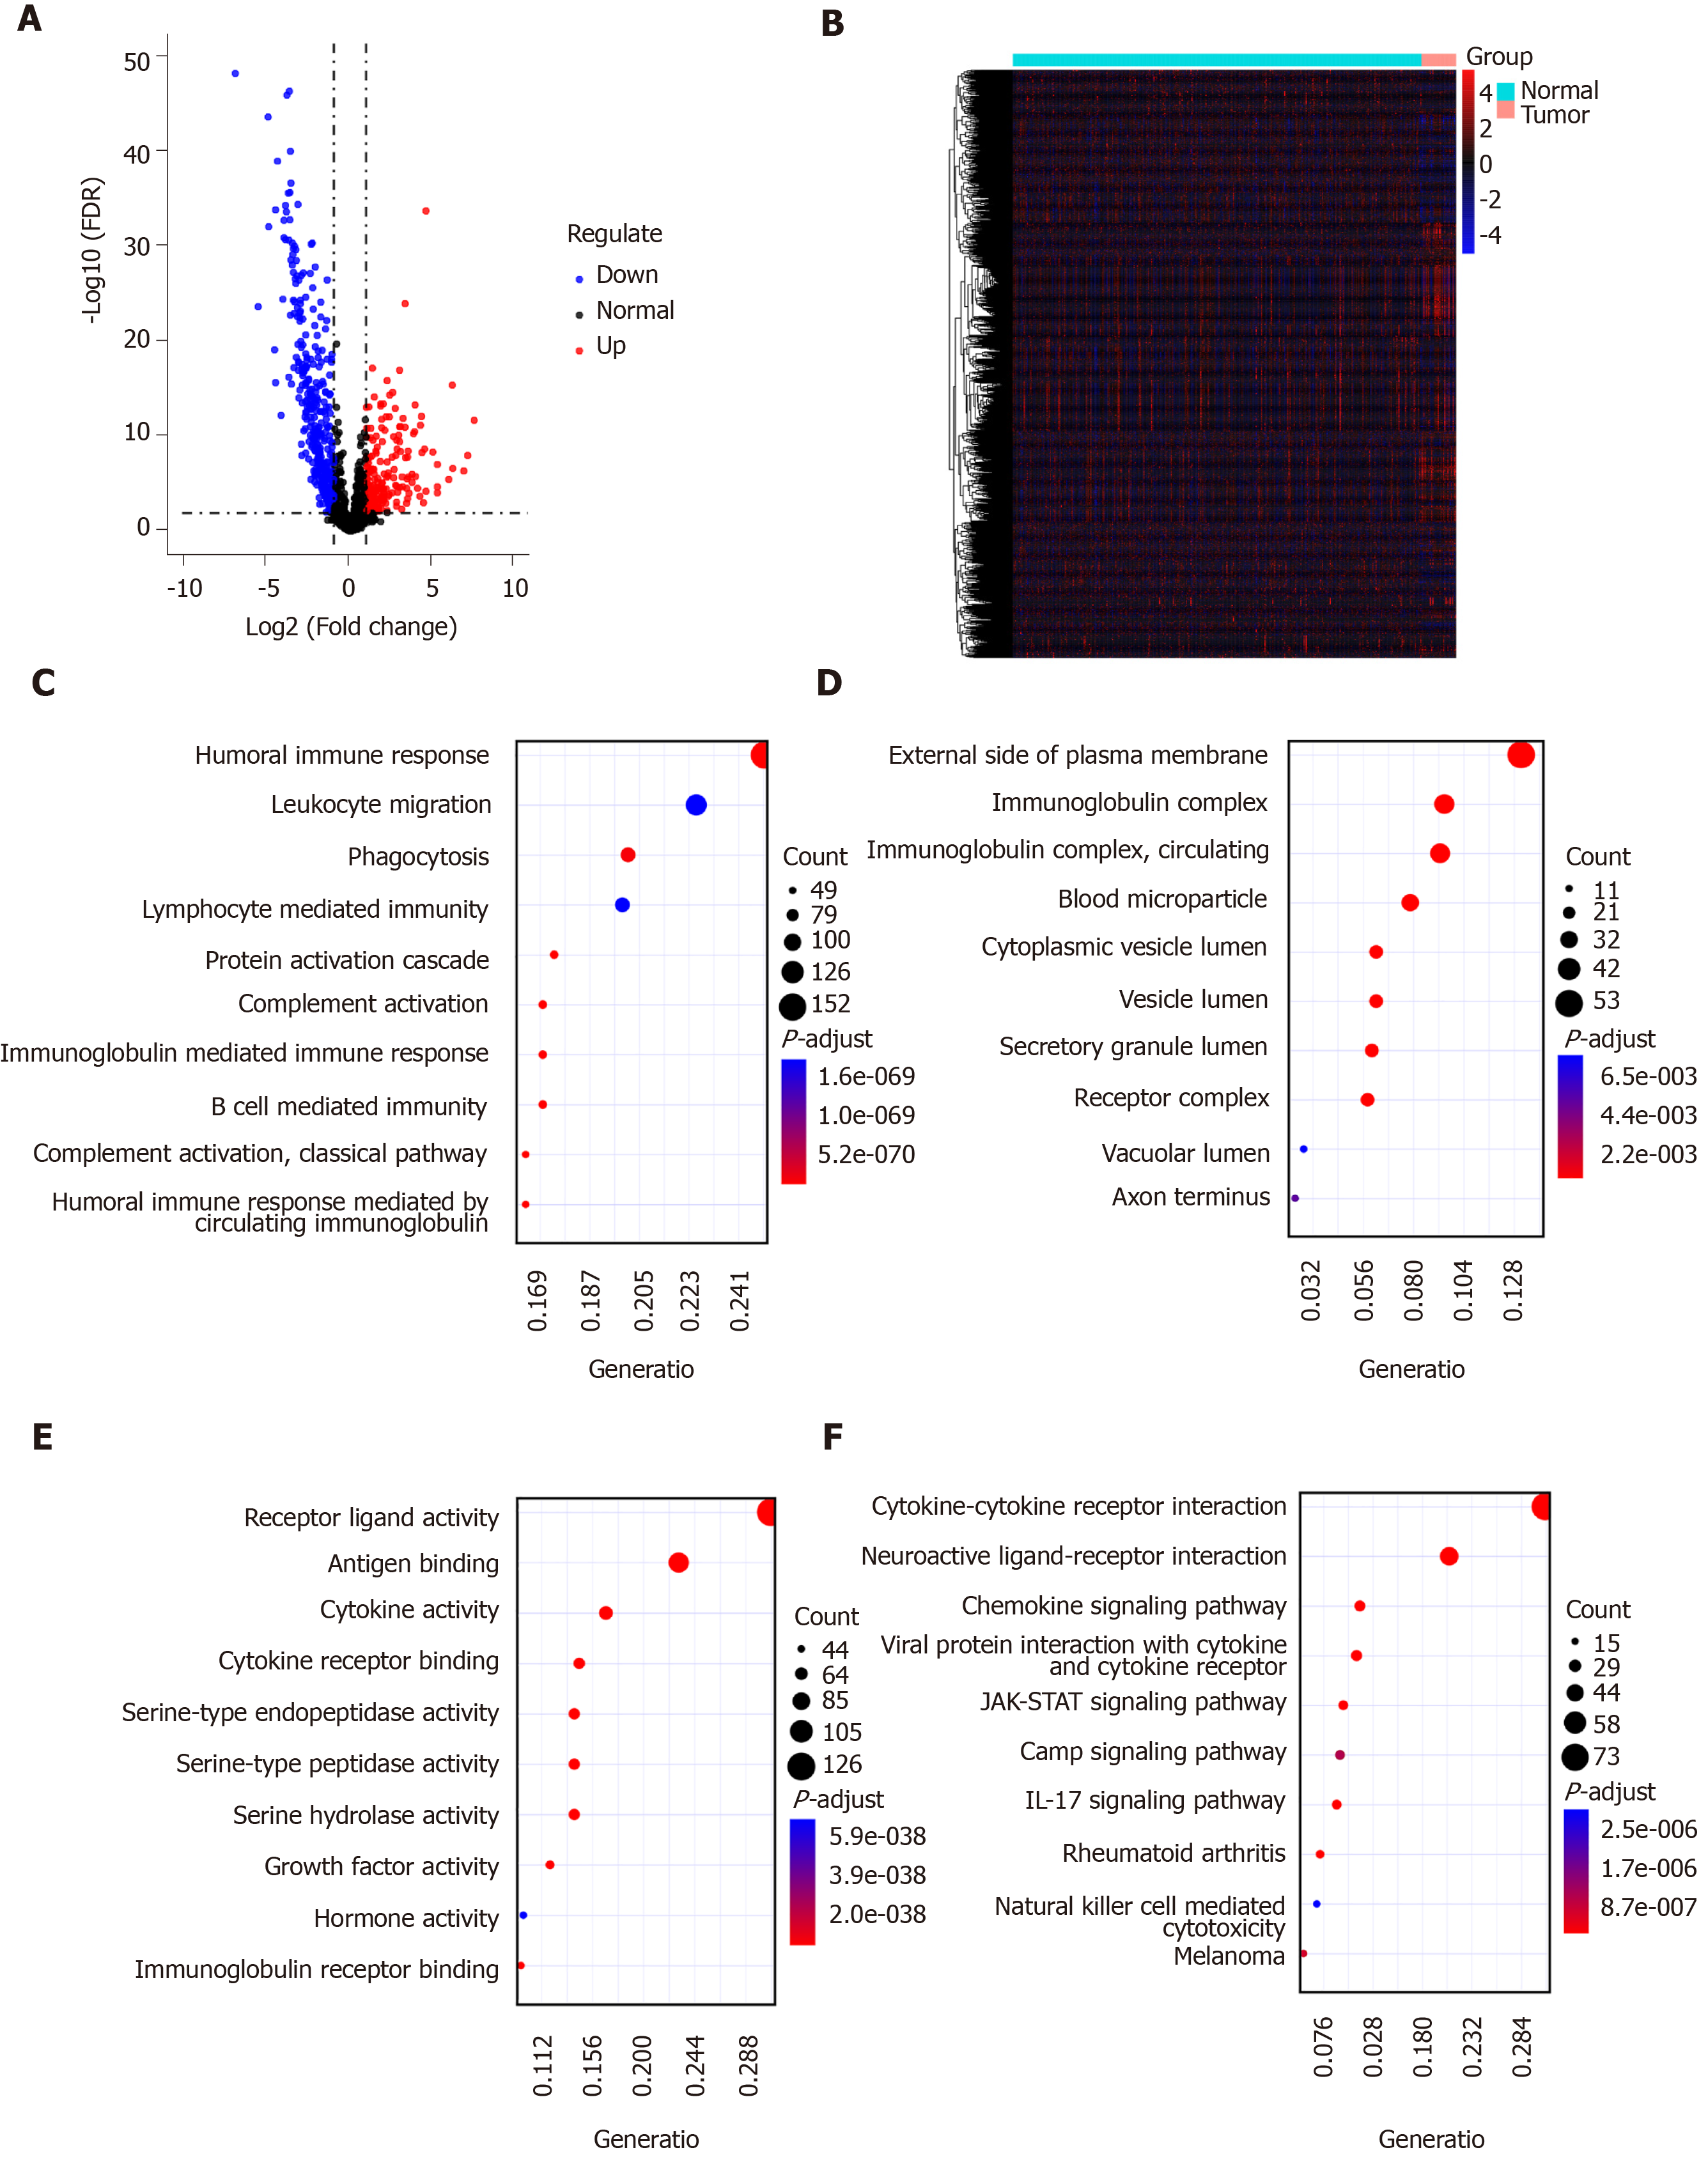
Figure 2 Identification of differentially expressed immune-related genes for gastric cancer.
A and B: Volcano plot (A) and heatmap (B) showing differentially expressed immune-related gene (IRGs) between gastric cancer tissues and normal tissues. Blue represents down-regulation and red represents up-regulation; C-E: Gene Ontology enrichment results of the top ten differentially expressed IRGs including biological processes (C), cellular component (D), and molecular function (E); F: Kyoto Encyclopedia of Genes and Genomes enrichment results of the top ten differentially expressed IRGs.
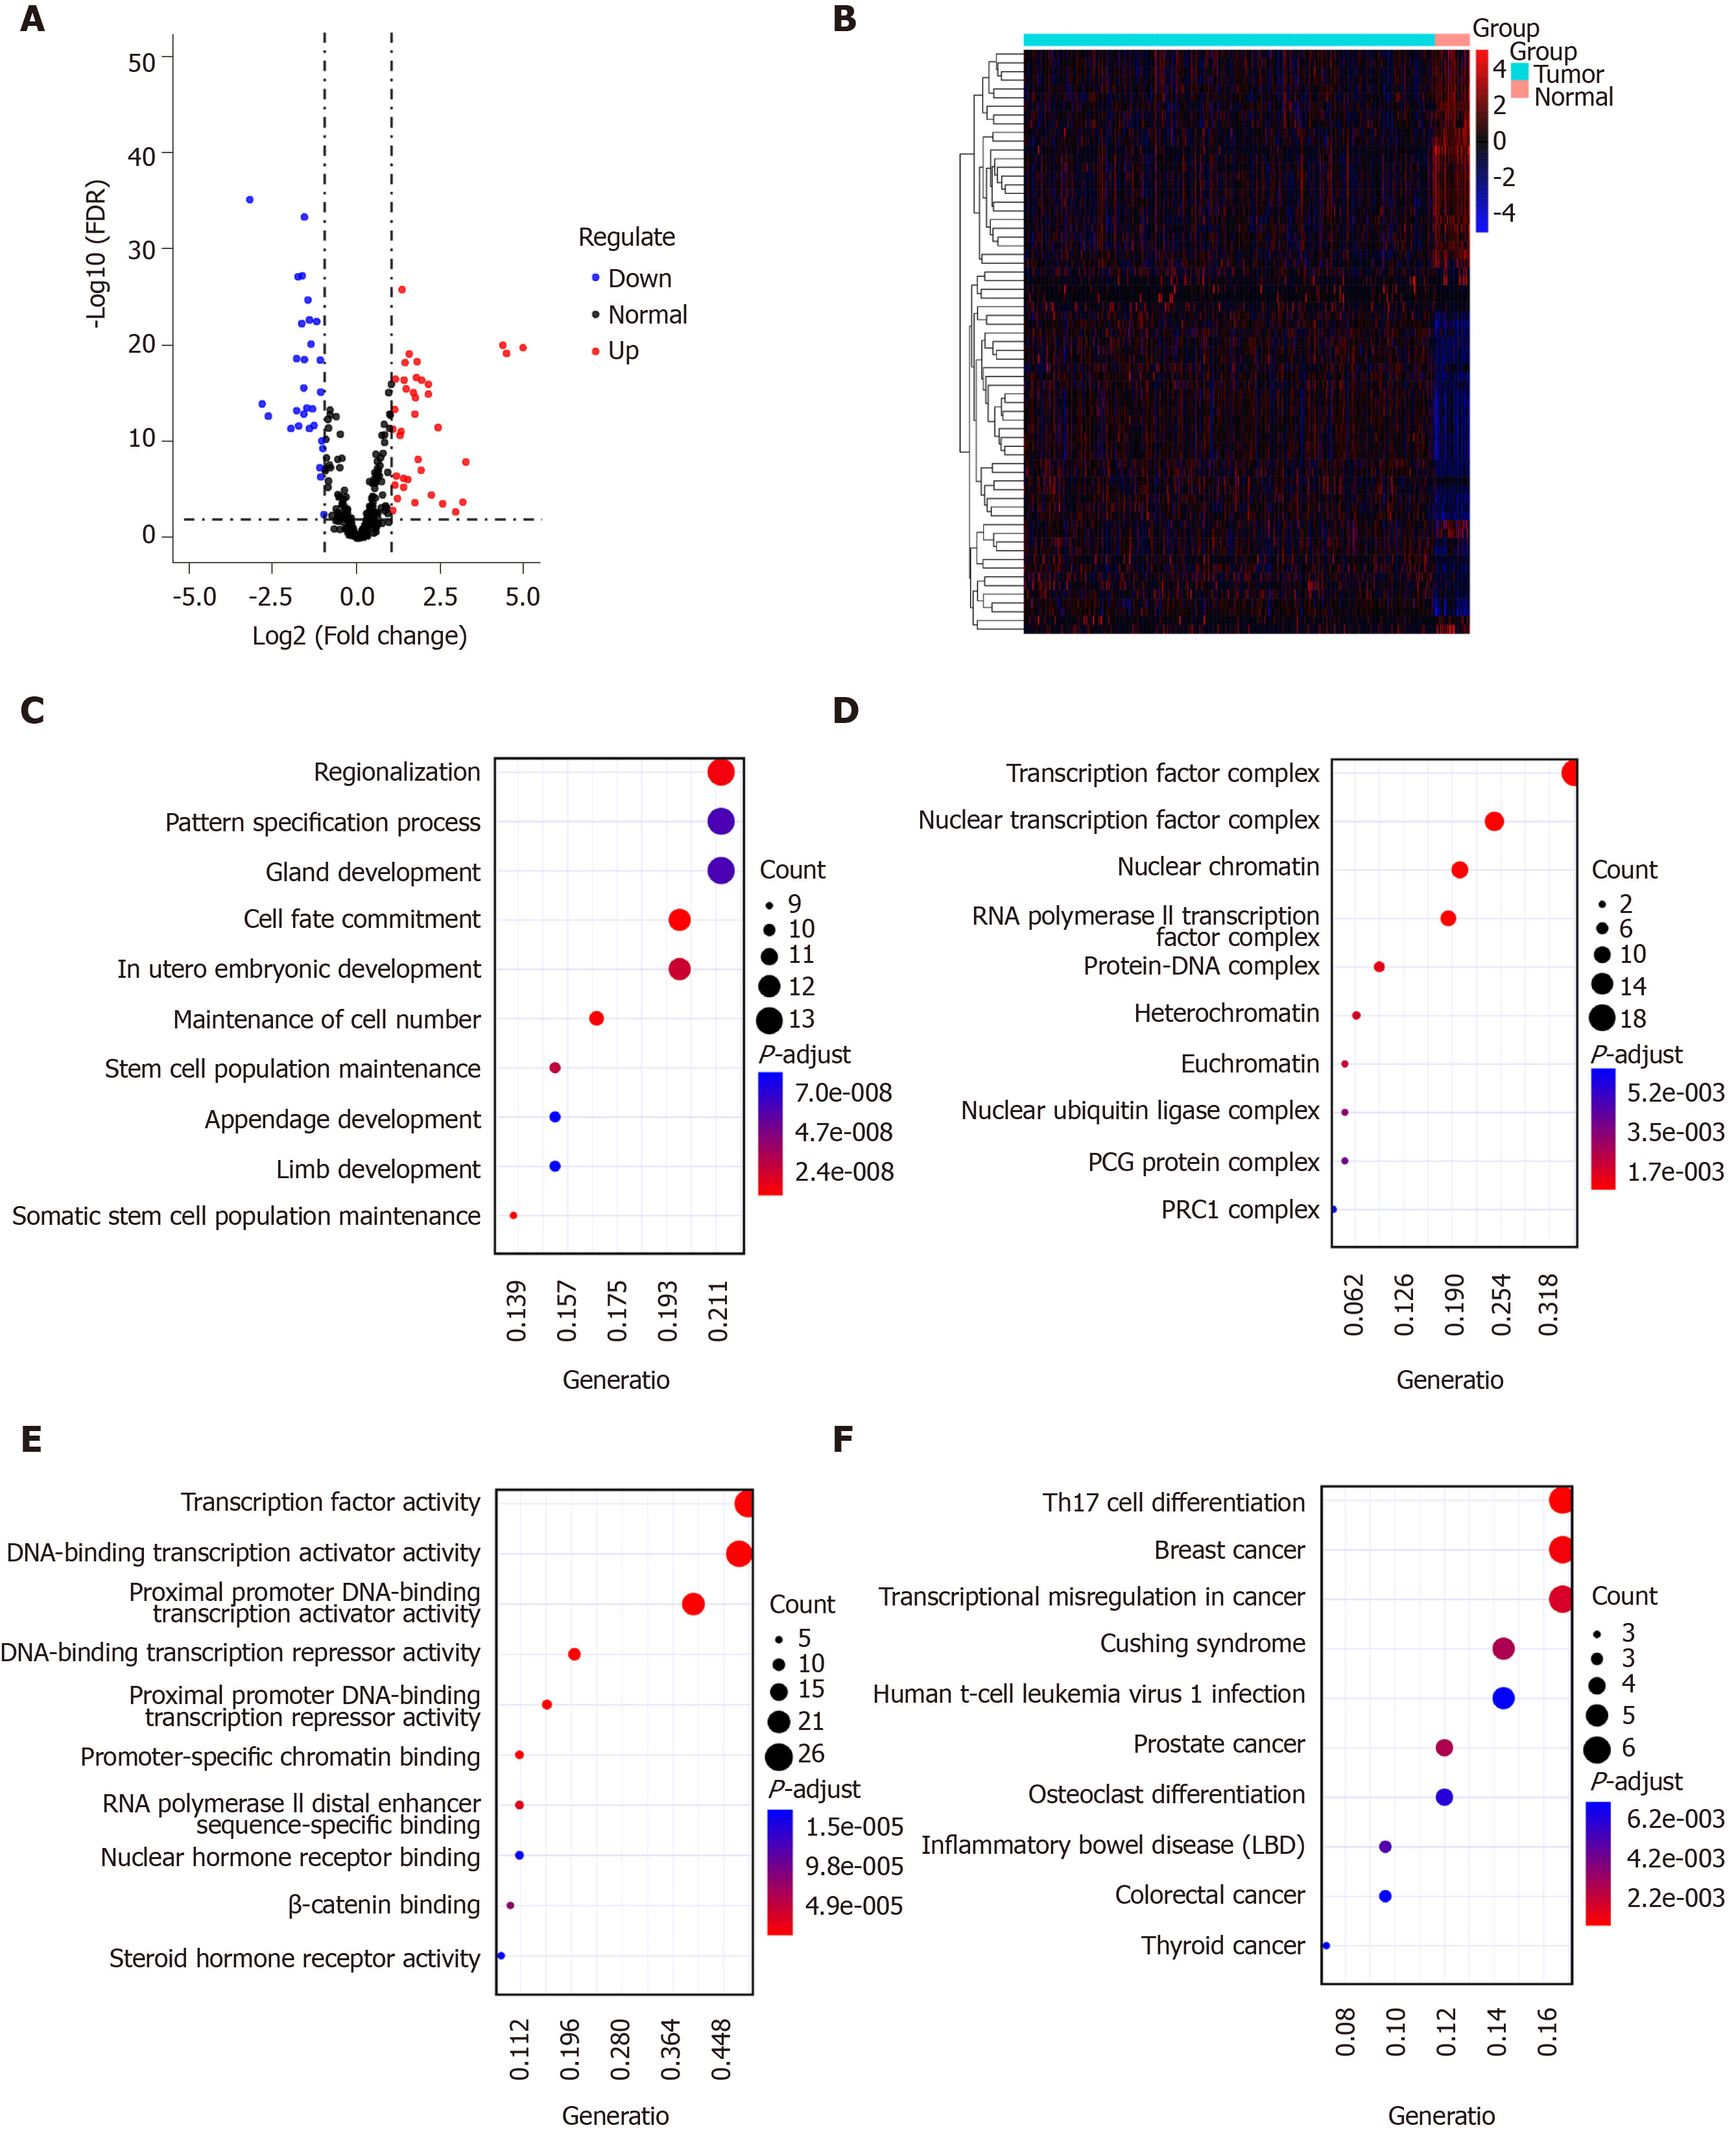
Figure 3 Identification of differentially expressed transcription factors for gastric cancer.
A and B: Volcano plot (A) and heatmap (B) showing differentially expressed transcription factors (TFs) between gastric cancer tissues and normal tissues. Blue represents down-regulation and red represents up-regulation; C-E: Gene Ontology enrichment results of the top ten differentially expressed TFs including biological processes (C), cellular component (D), and molecular function (E); F: Kyoto Encyclopedia of Genes and Genomes enrichment results of the top ten differentially expressed TFs.
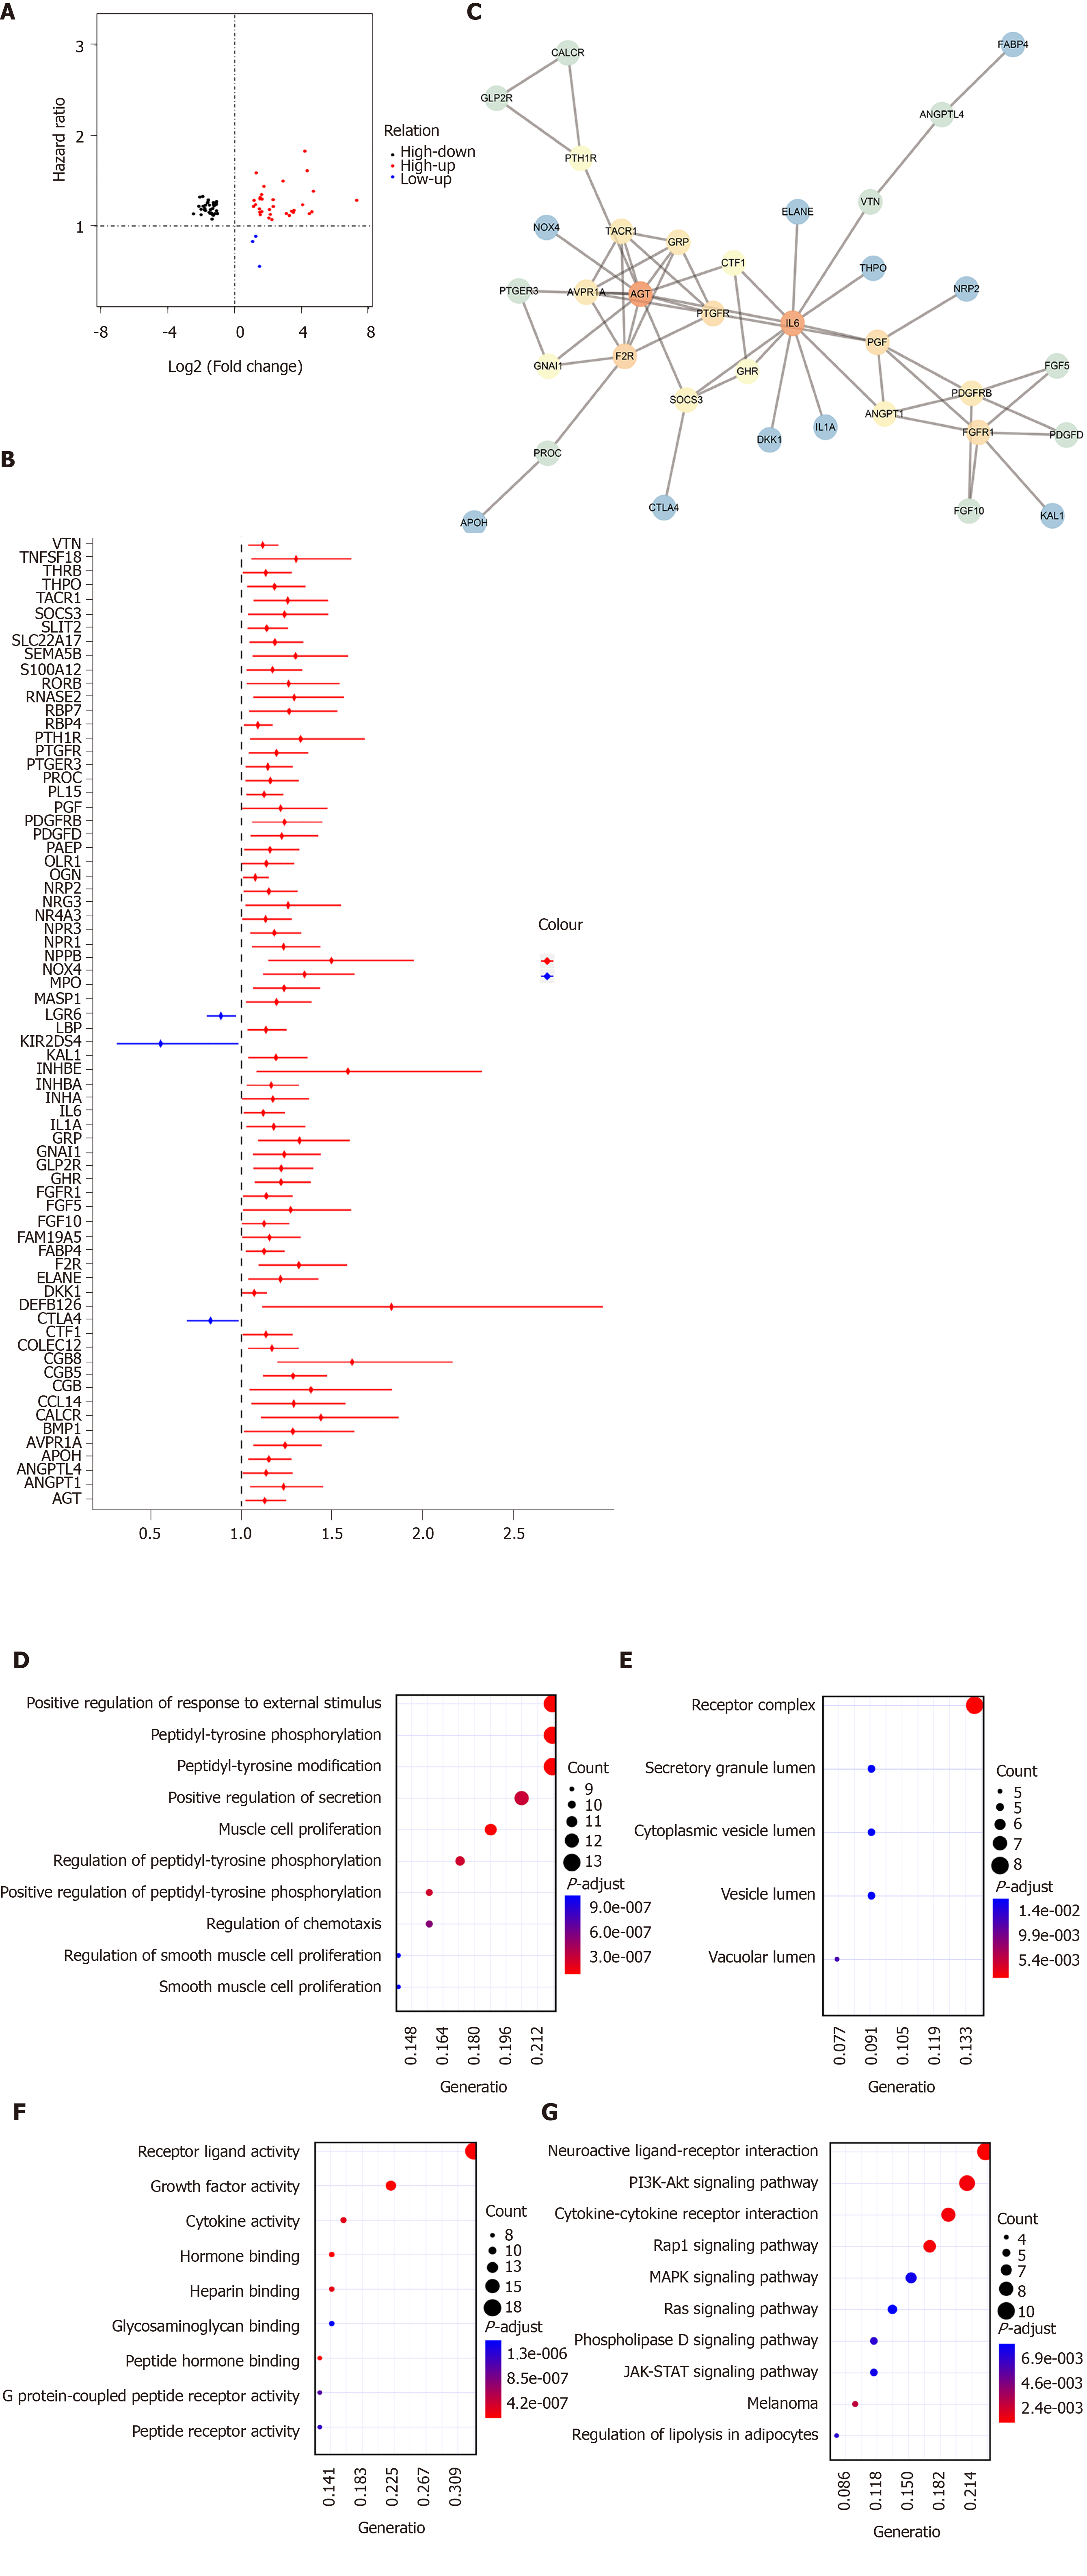
Figure 4 Identification of hub immune-related genes for gastric cancer.
A: The intersection of differentially expressed immune-related gene (IRGs) and survival-related IRGs; B: Forest plot showing prognostic value of hub IRGs. The X-axis represents hazard ratio, and the Y-axis represents the differentially expressed hub IRG; C: Protein-protein interaction network of hub IRGs; D-F: Gene Ontology enrichment results of the top ten differentially expressed transcription factors (TFs) including biological processes (D), cellular component (E), and molecular function (F); G: Kyoto Encyclopedia of Genes and Genomes enrichment results of the top ten differentially expressed TFs.
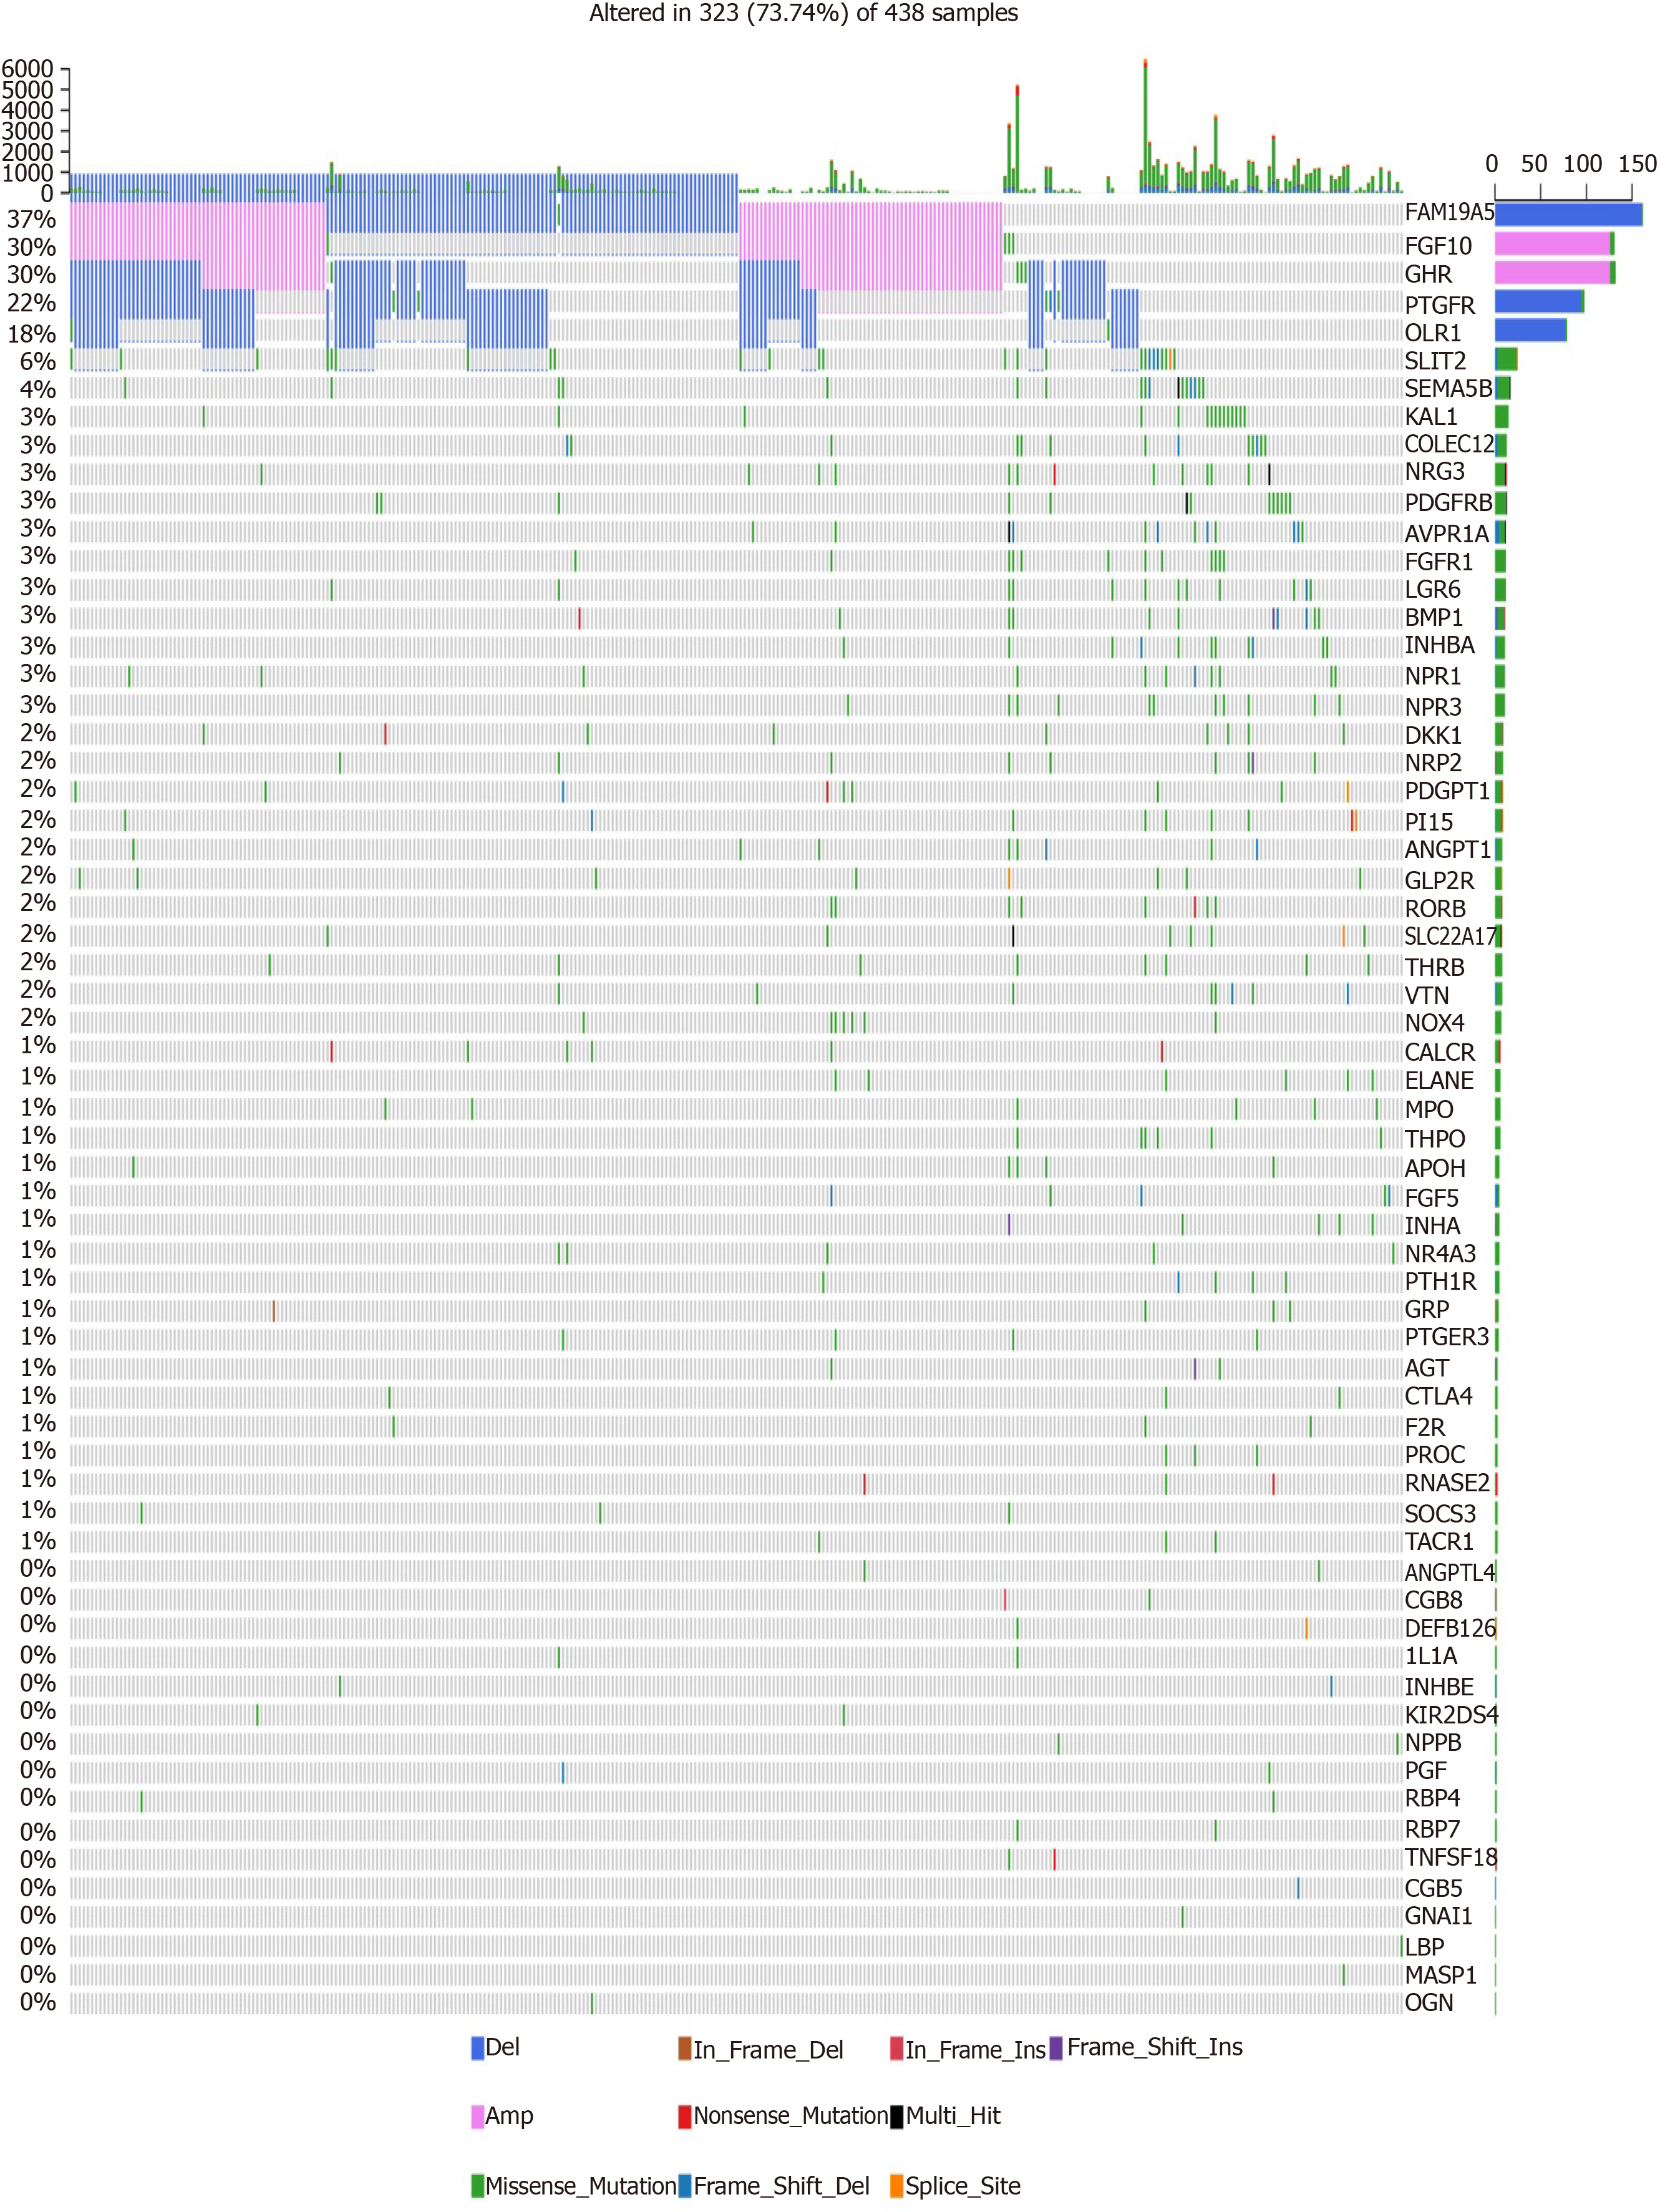
Figure 5 Mutation landscape of hub immune-related genes for gastric cancer.
The horizontal axis represents different samples, and the vertical axis represents immune-related gene. Different colors represent different types of variation.
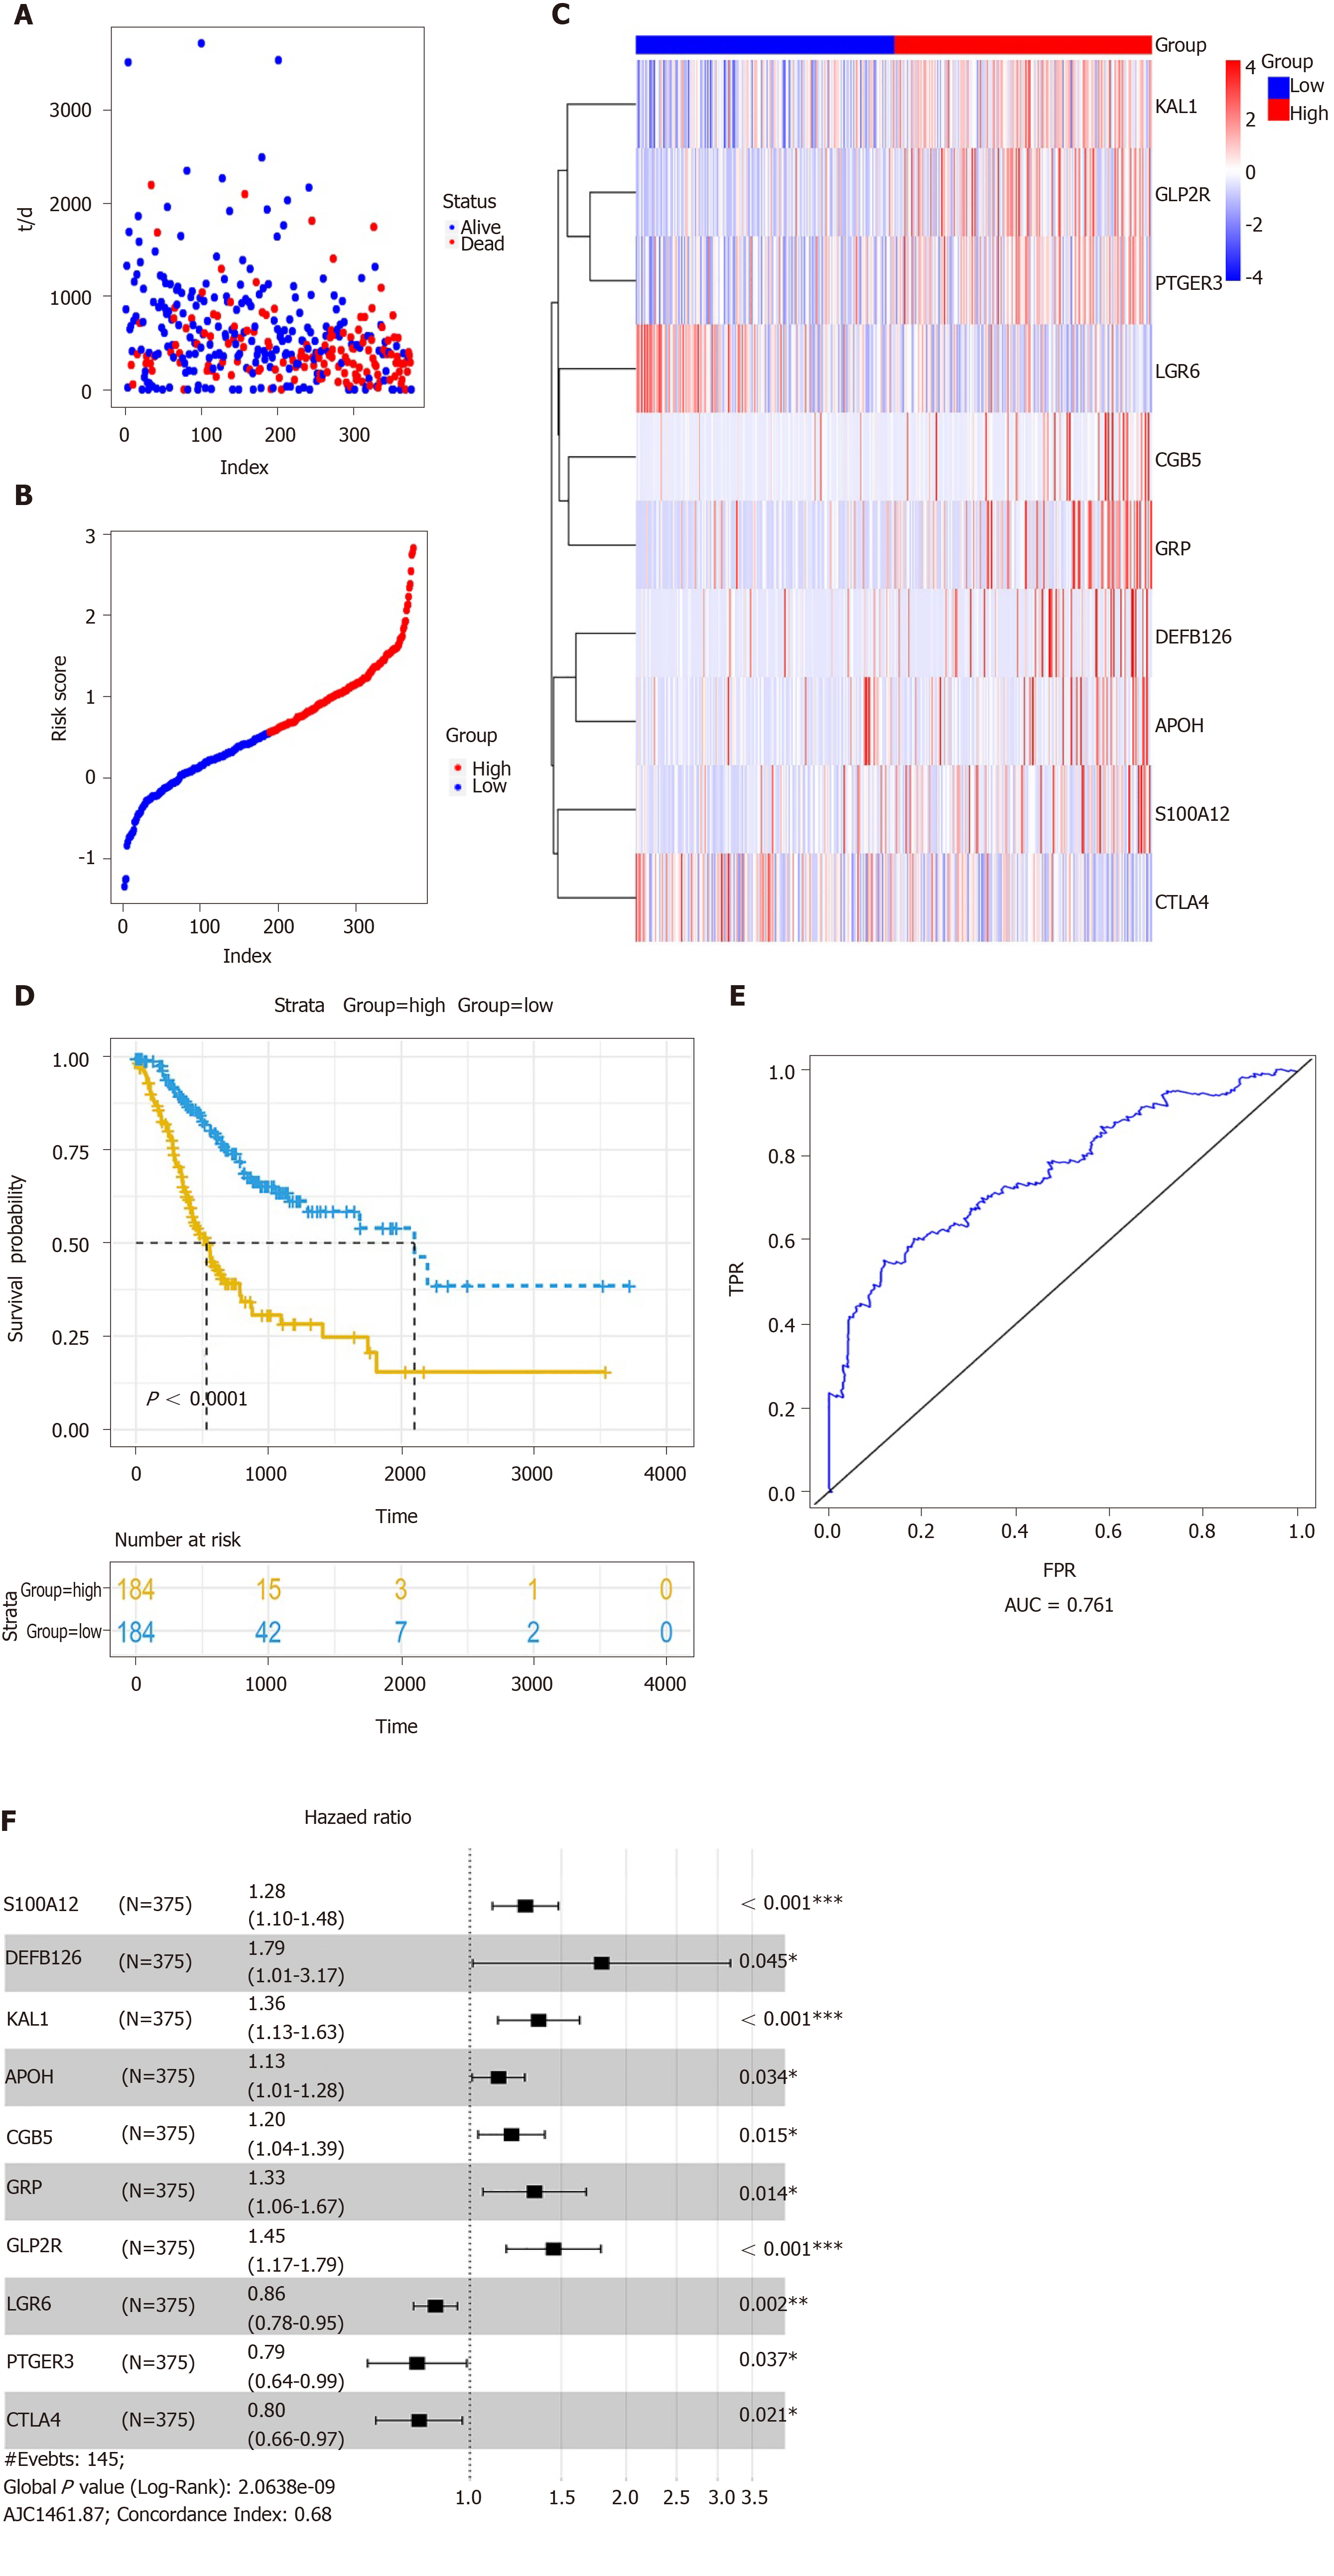
Figure 6 Construction of a prognostic signature for gastric cancer.
A: Forest plot showing the prognostic values of ten hub immune-related gene (IRGs) in the prognostic signature; B: Prognostic index rank; C: Survival status of patients in the two groups; D: Heatmap showing the expression patterns of ten hub IRGs; E: Overall survival analysis results; F: The area under the receiver operating characteristic curve.
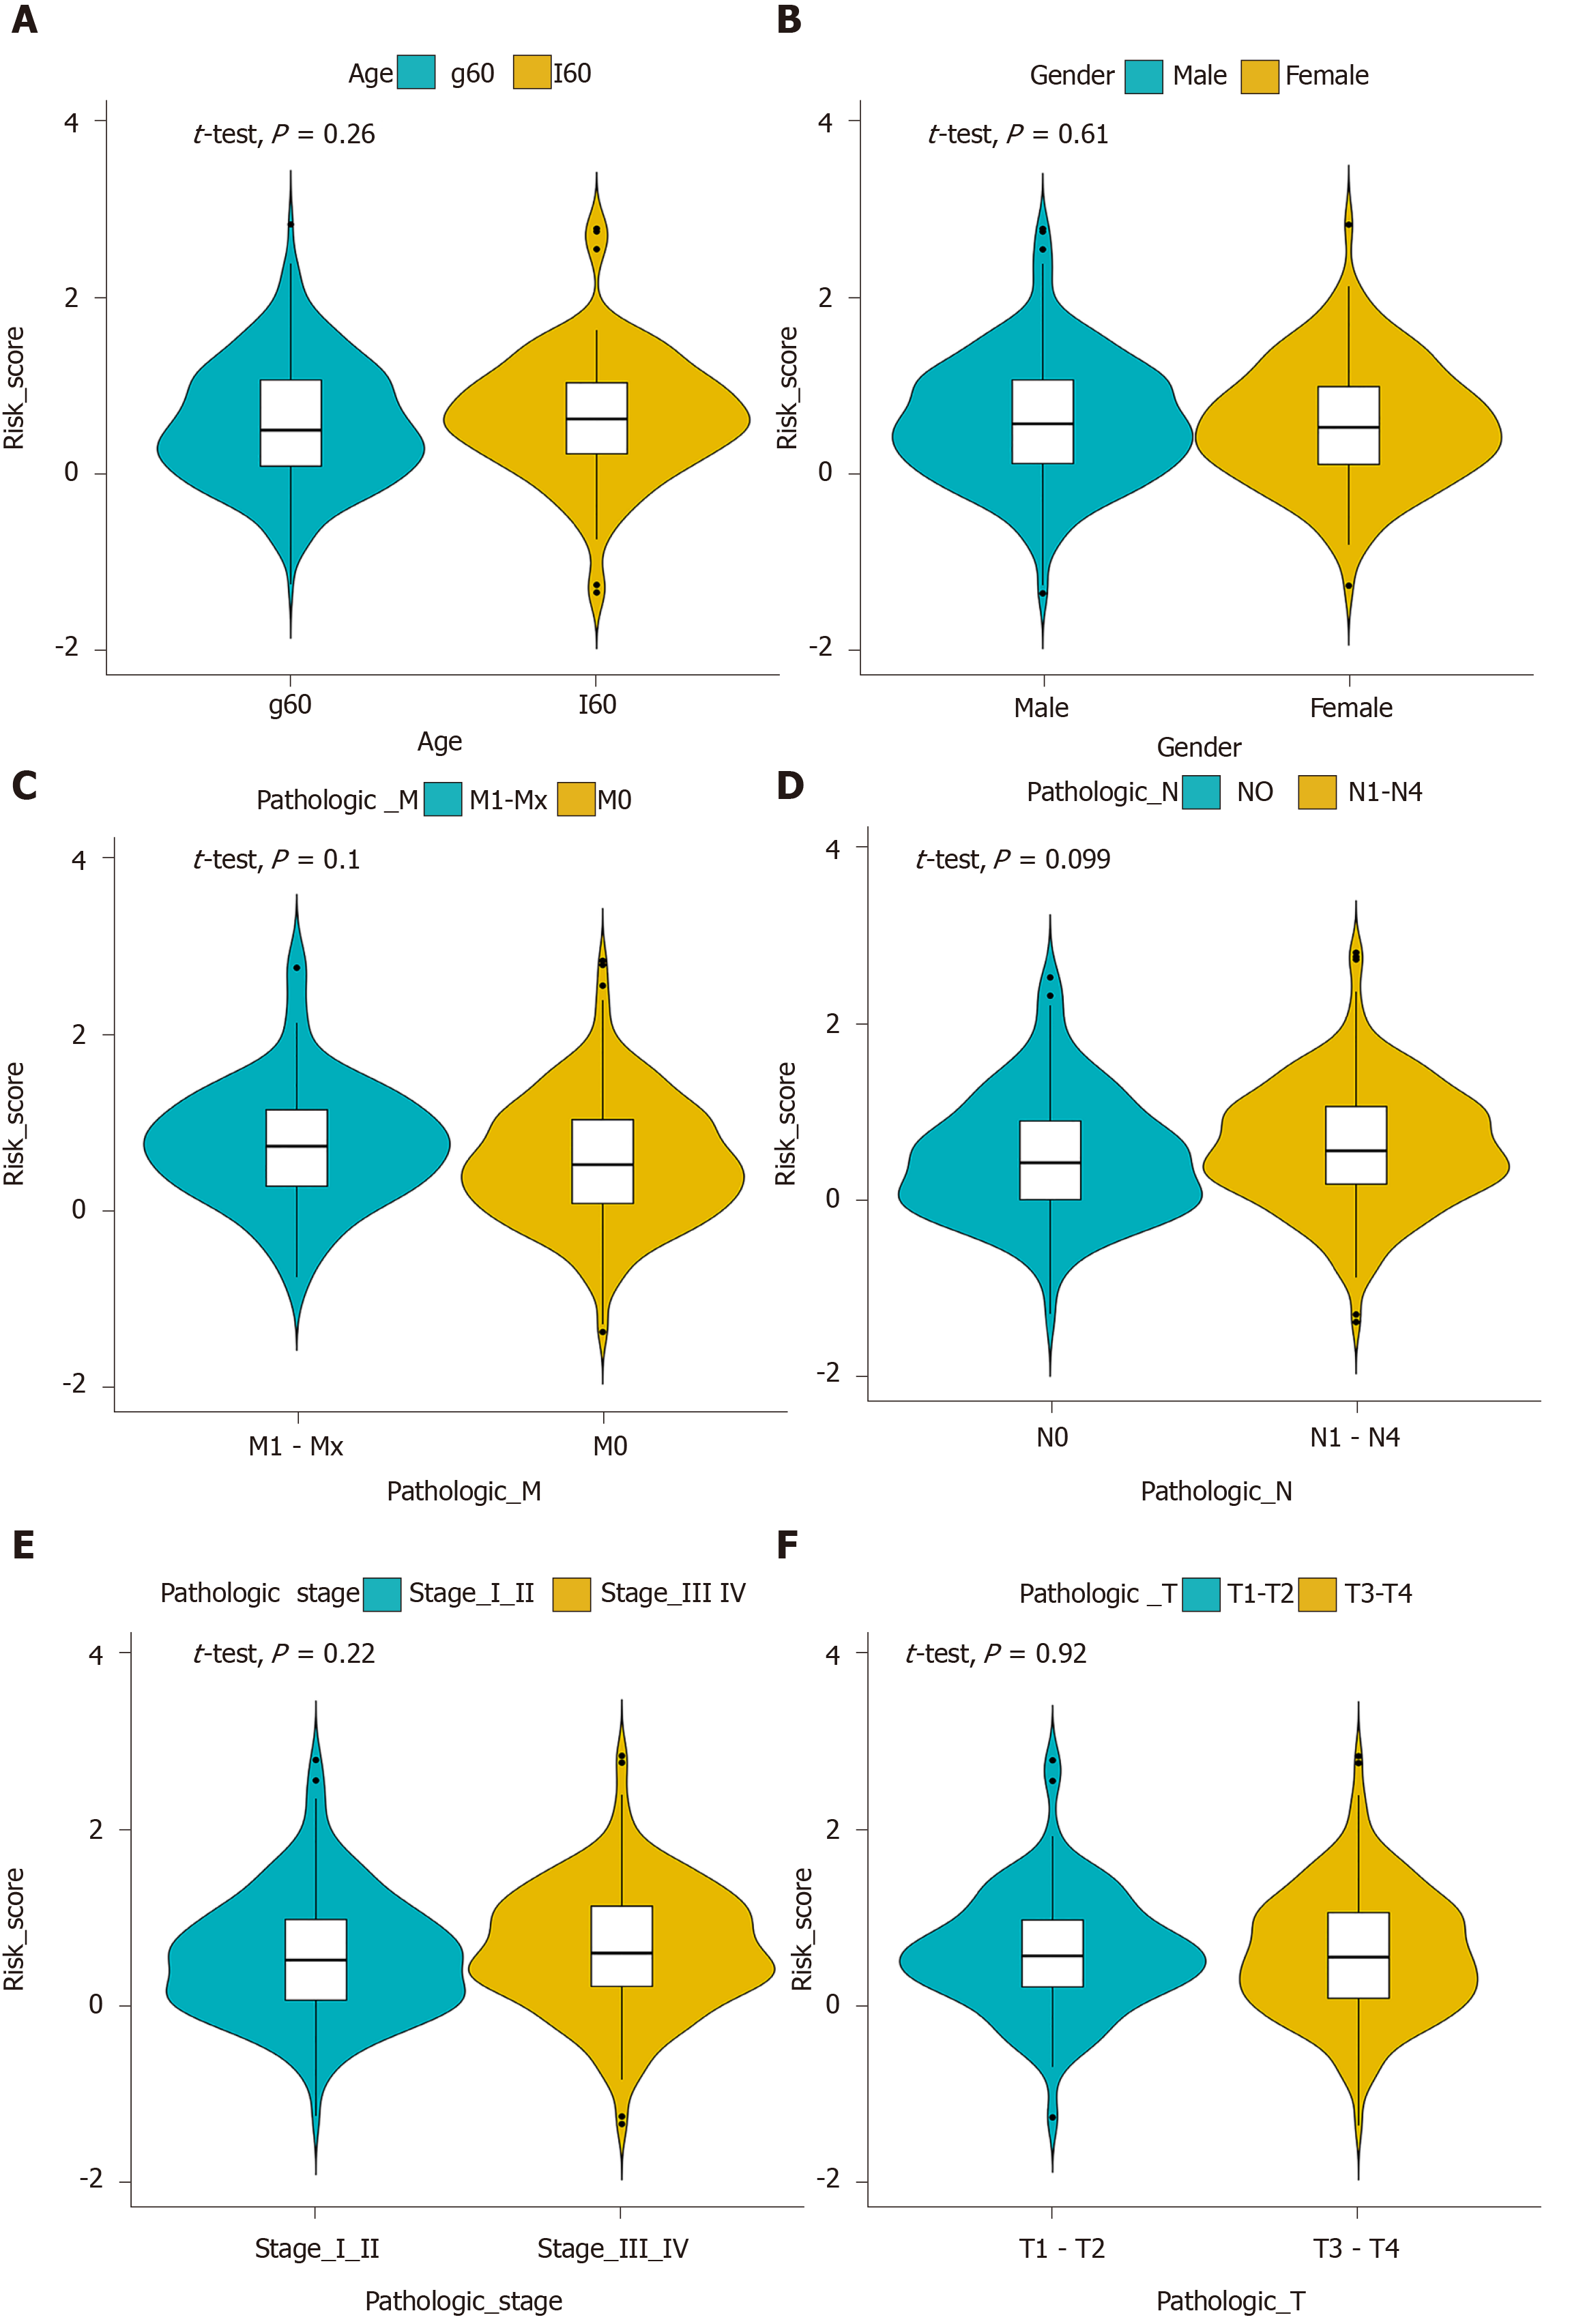
Figure 7 Correlation between clinical features and the prognostic signature for gastric cancer.
The clinical features included age (A), gender (B), pathologic T (C), pathologic N (D), pathologic M (E), and pathologic stage (F).
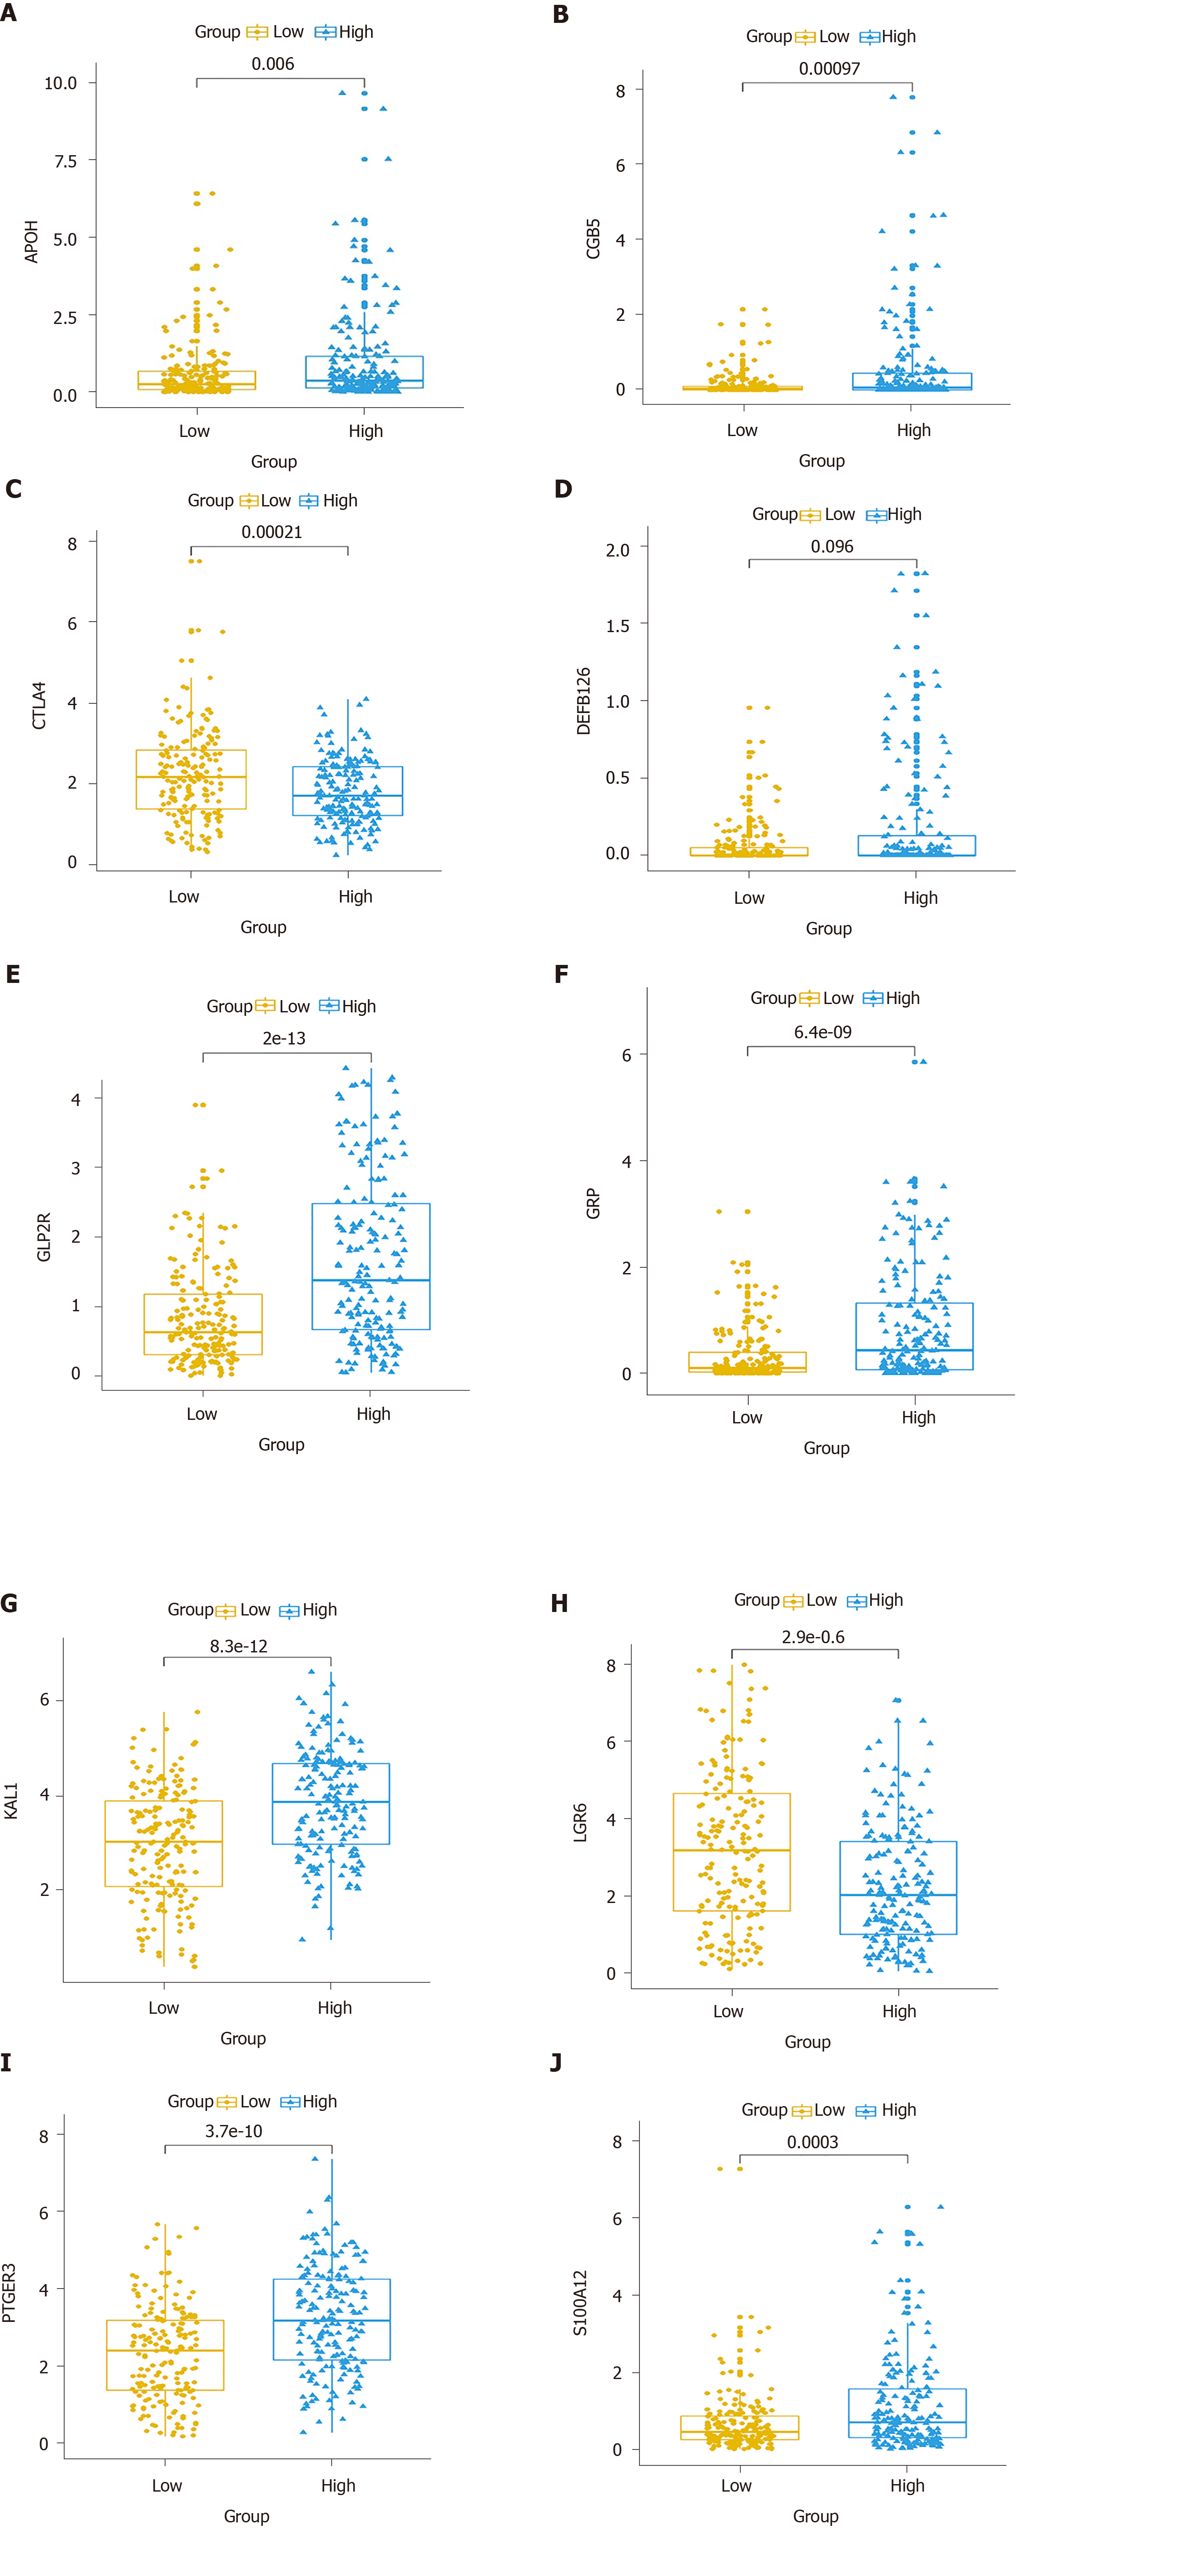
Figure 8 Expression patterns of the ten hub immune-related genes in the prognostic signature between gastric cancer tissues and normal tissues.
A: APOH; B: CGB5; C: CTLA4; D: DEFB126; E: GLP2R; F: GRP; G: KAL1; H: LGR6; I: PTGER3; J: S100A12.
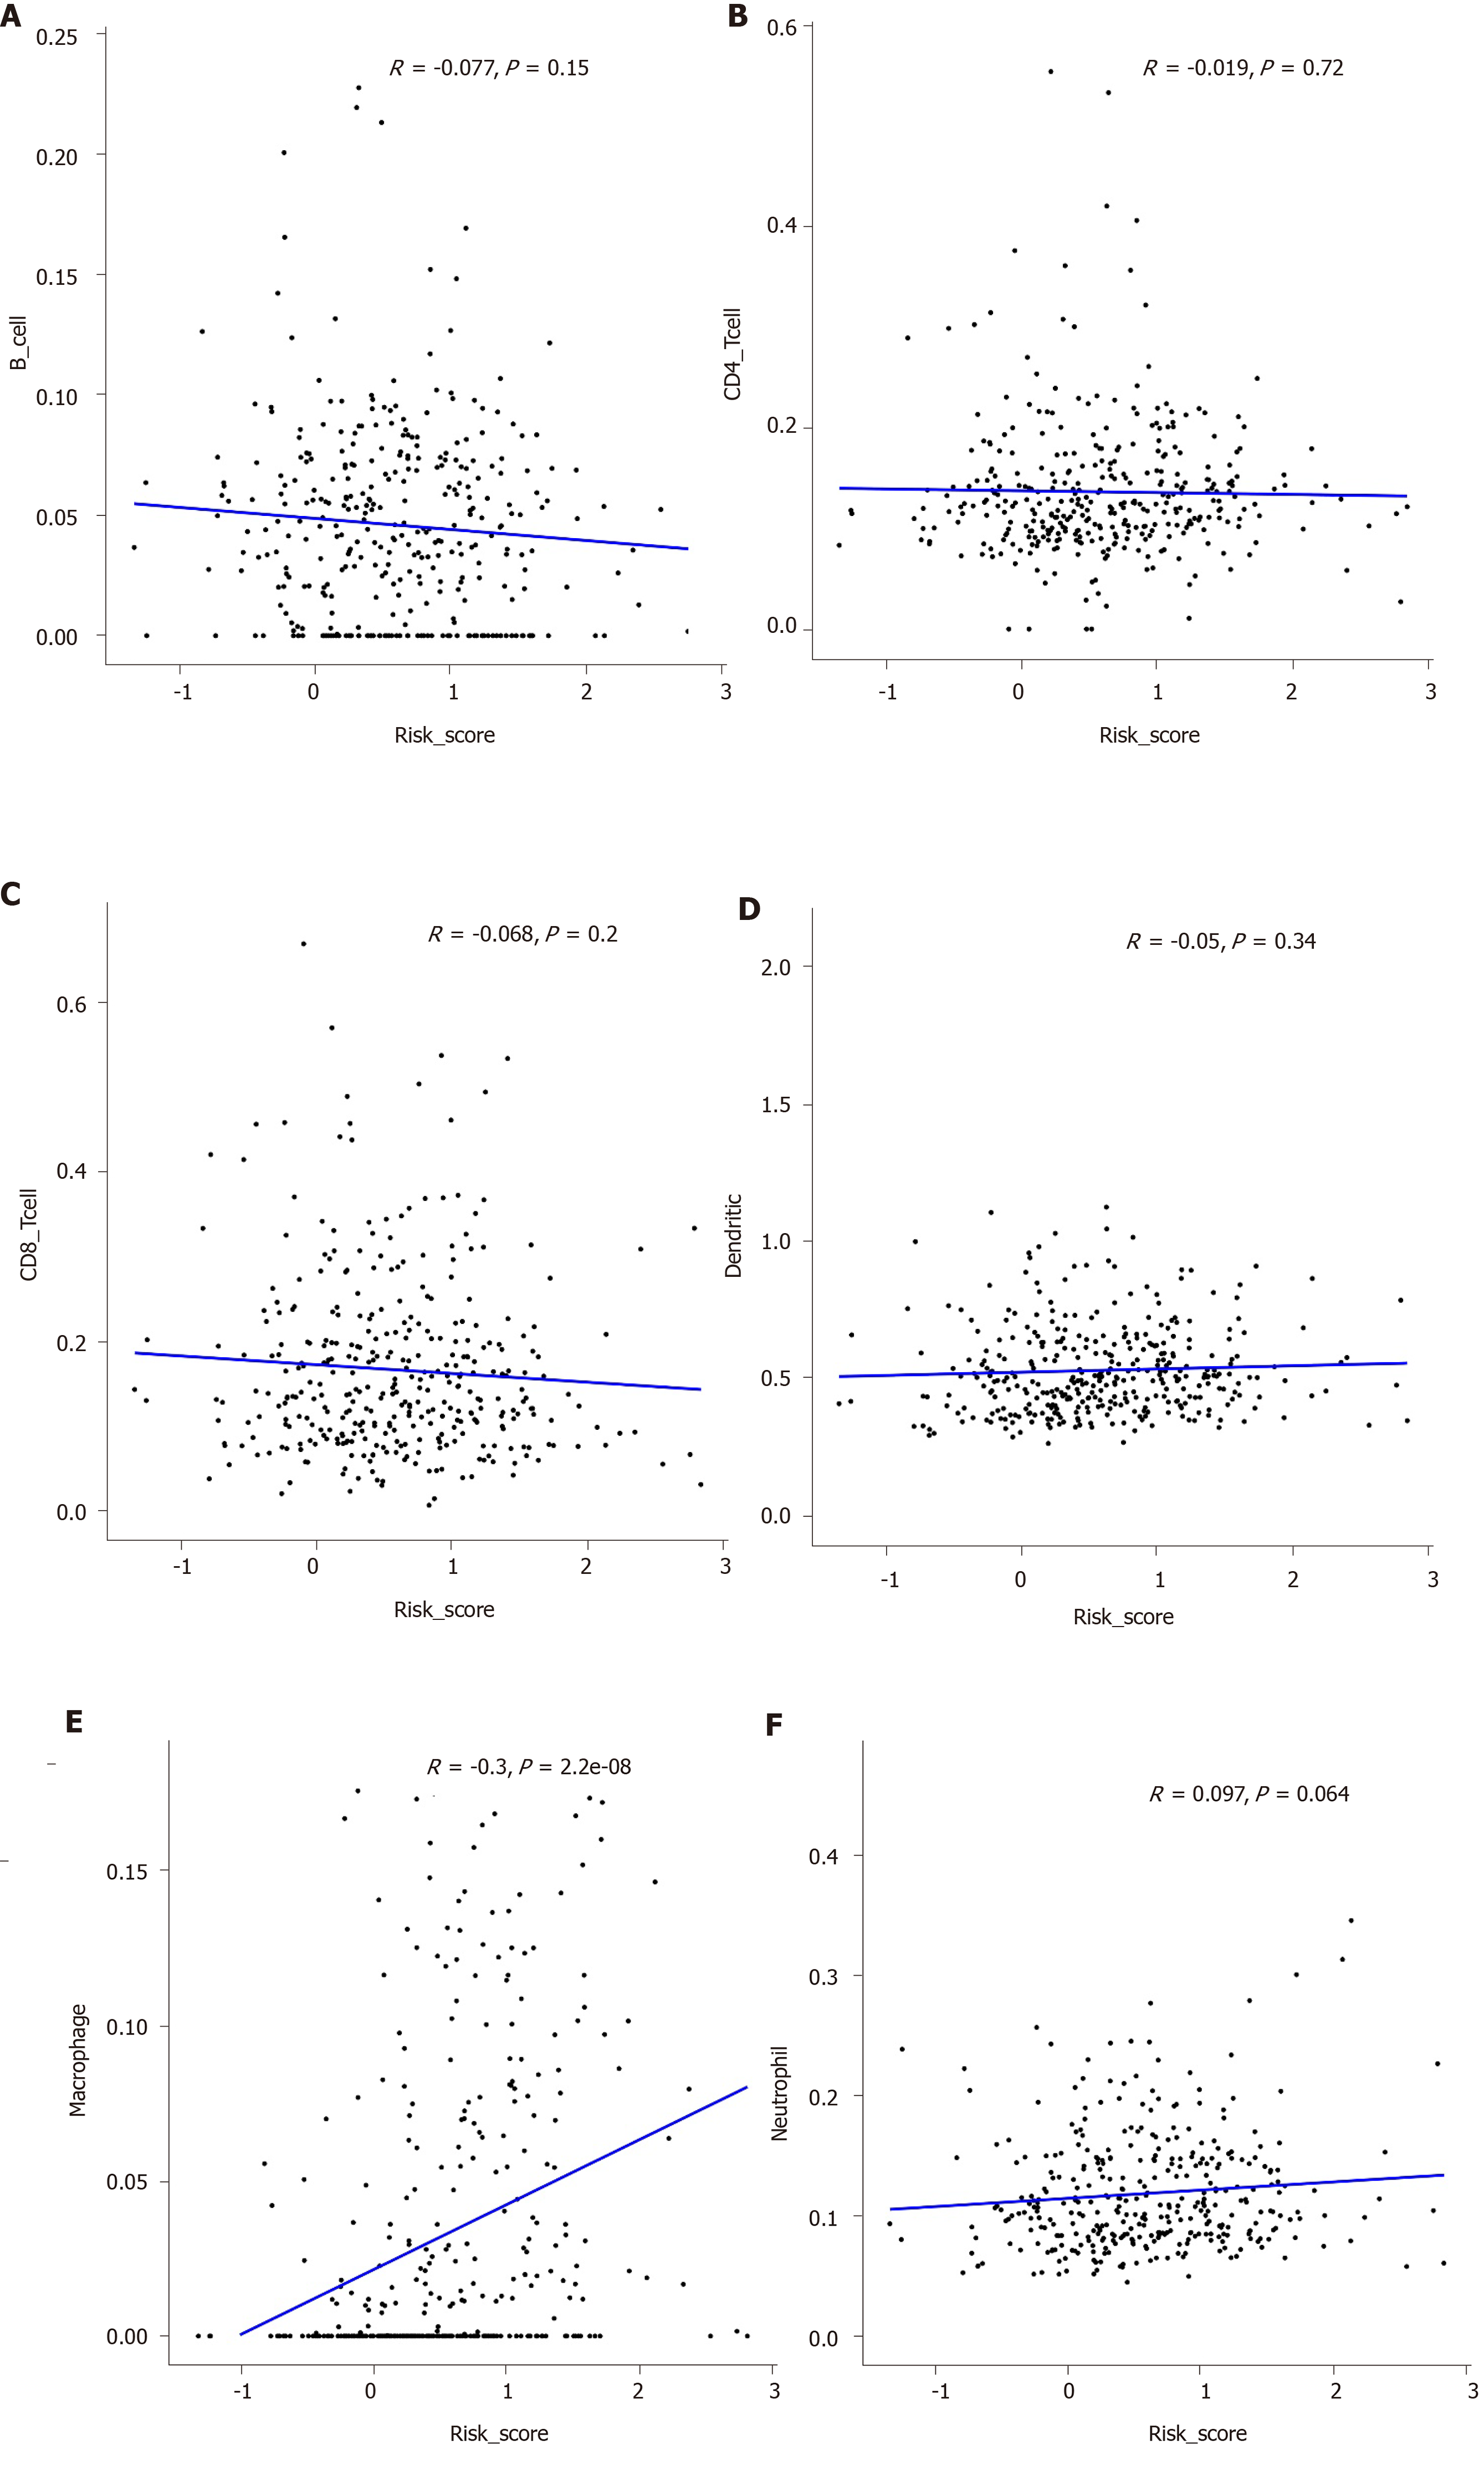
Figure 9 Correlation between the prognostic signature and immune cells including macrophages (A), B cells (B), CD4+ T cells (C), CD8+ T cells (D), dendritic cells (E), and neutrophils (F).
- Citation: Qiu XT, Song YC, Liu J, Wang ZM, Niu X, He J. Identification of an immune-related gene-based signature to predict prognosis of patients with gastric cancer. World J Gastrointest Oncol 2020; 12(8): 857-876
- URL: https://www.wjgnet.com/1948-5204/full/v12/i8/857.htm
- DOI: https://dx.doi.org/10.4251/wjgo.v12.i8.857


