Copyright
©The Author(s) 2020.
World J Gastrointest Oncol. Nov 15, 2020; 12(11): 1311-1324
Published online Nov 15, 2020. doi: 10.4251/wjgo.v12.i11.1311
Published online Nov 15, 2020. doi: 10.4251/wjgo.v12.i11.1311
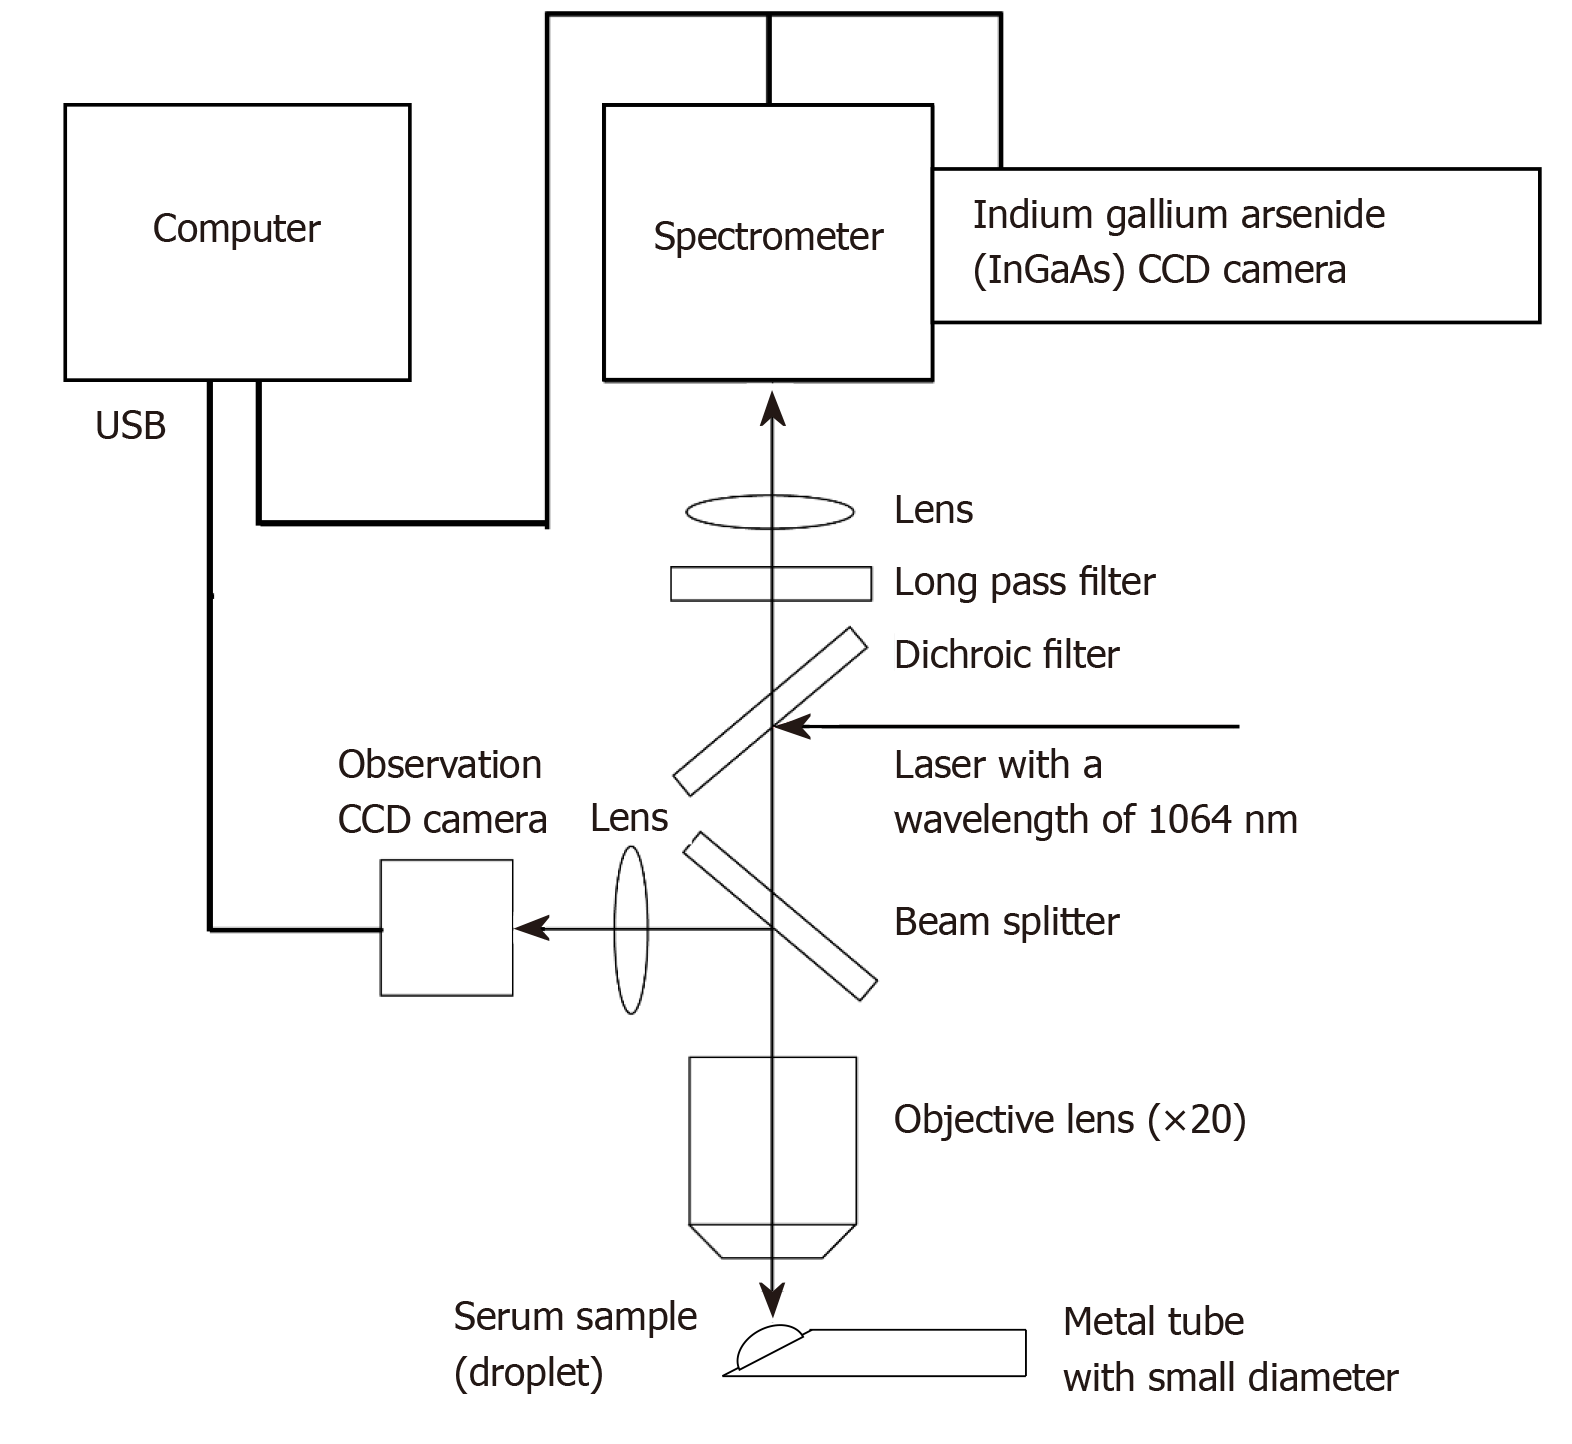
Figure 1 Schematic of the confocal micro-Raman spectrometer used in this study.
A nomadic Raman microscope with an excitation laser at a wavelength of 1064 nm was used in this study. A 20 × magnifying objective lens with a correction collar with near-infrared microscopy (LCPLN20XIR; Olympus Corporation, Tokyo, Japan) and a 2048 × 64 pixel thermoelectric cooled indium gallium arsenide (InGaAs), charge-couple device (CCD) detector, with a spectral range of 100-3200 cm-1 (grating 4 cm-1) were used to record the spectra.
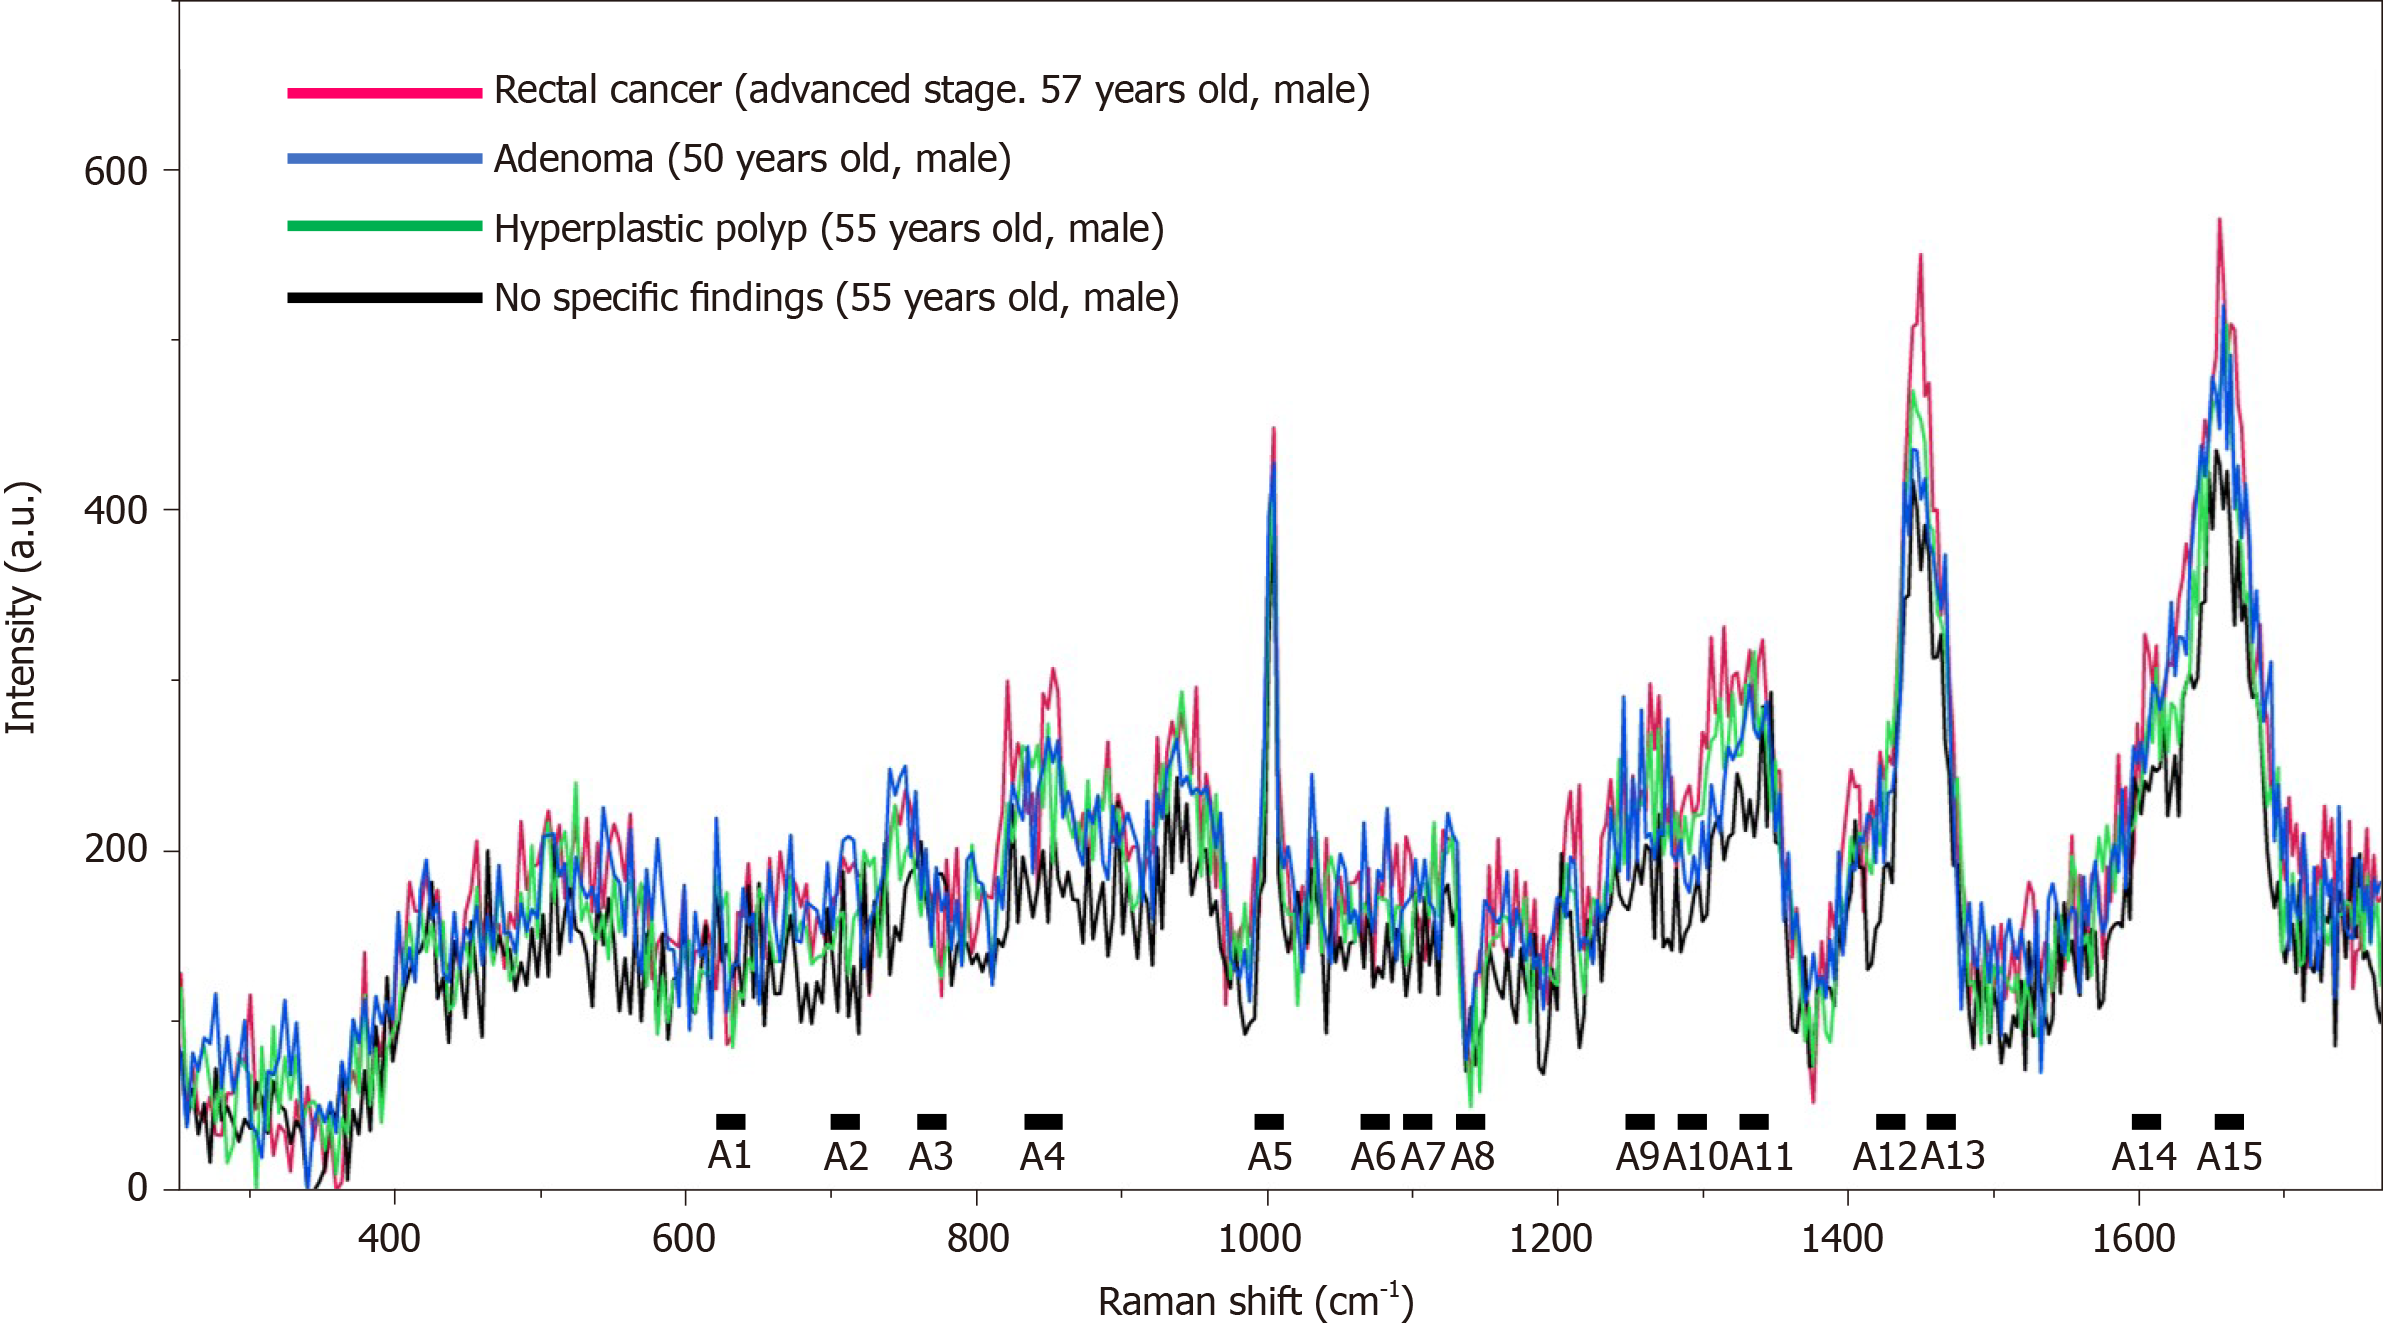
Figure 2 Raman spectra of serum samples from patients.
The spectra of the serum samples from patients with rectal cancer, colon adenoma, and colon hyperplastic polyp, and the patient with no specific findings.
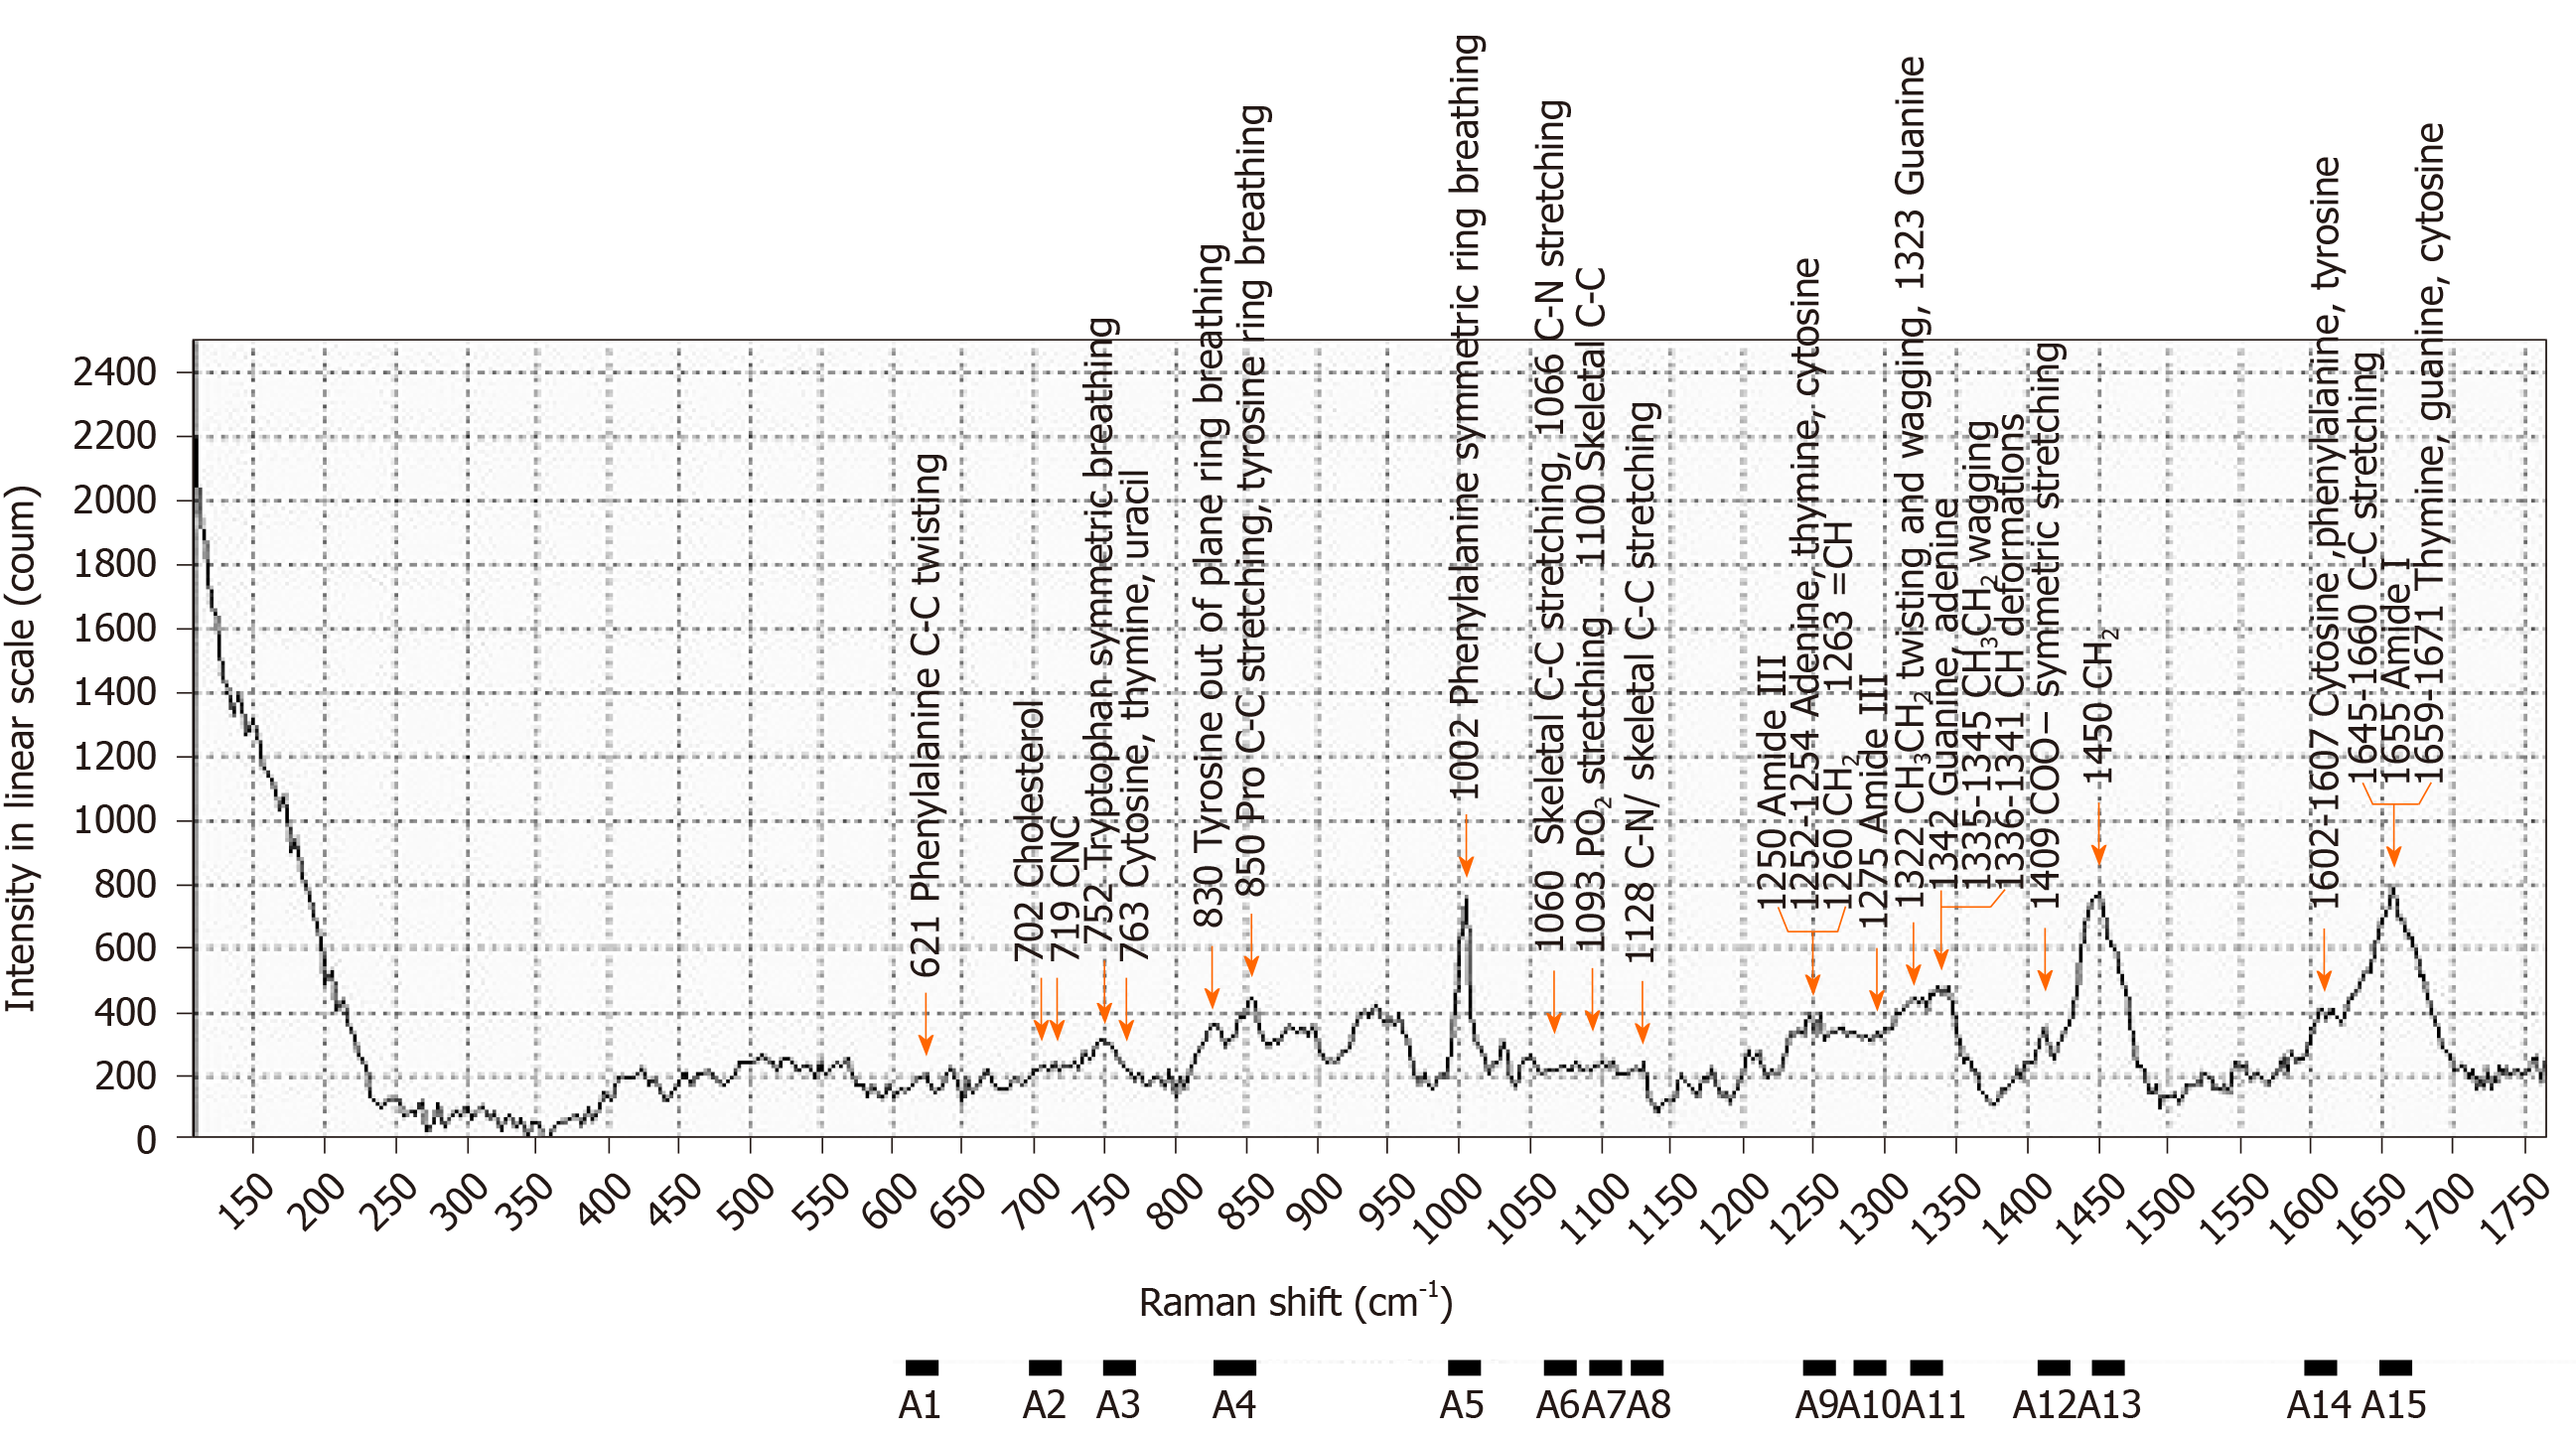
Figure 3 Raman spectra of patient serum samples and assignments.
Raman spectra of serum sample from the patient with internal hemorrhoid (53-years-old, female), and selected range of Raman shift.
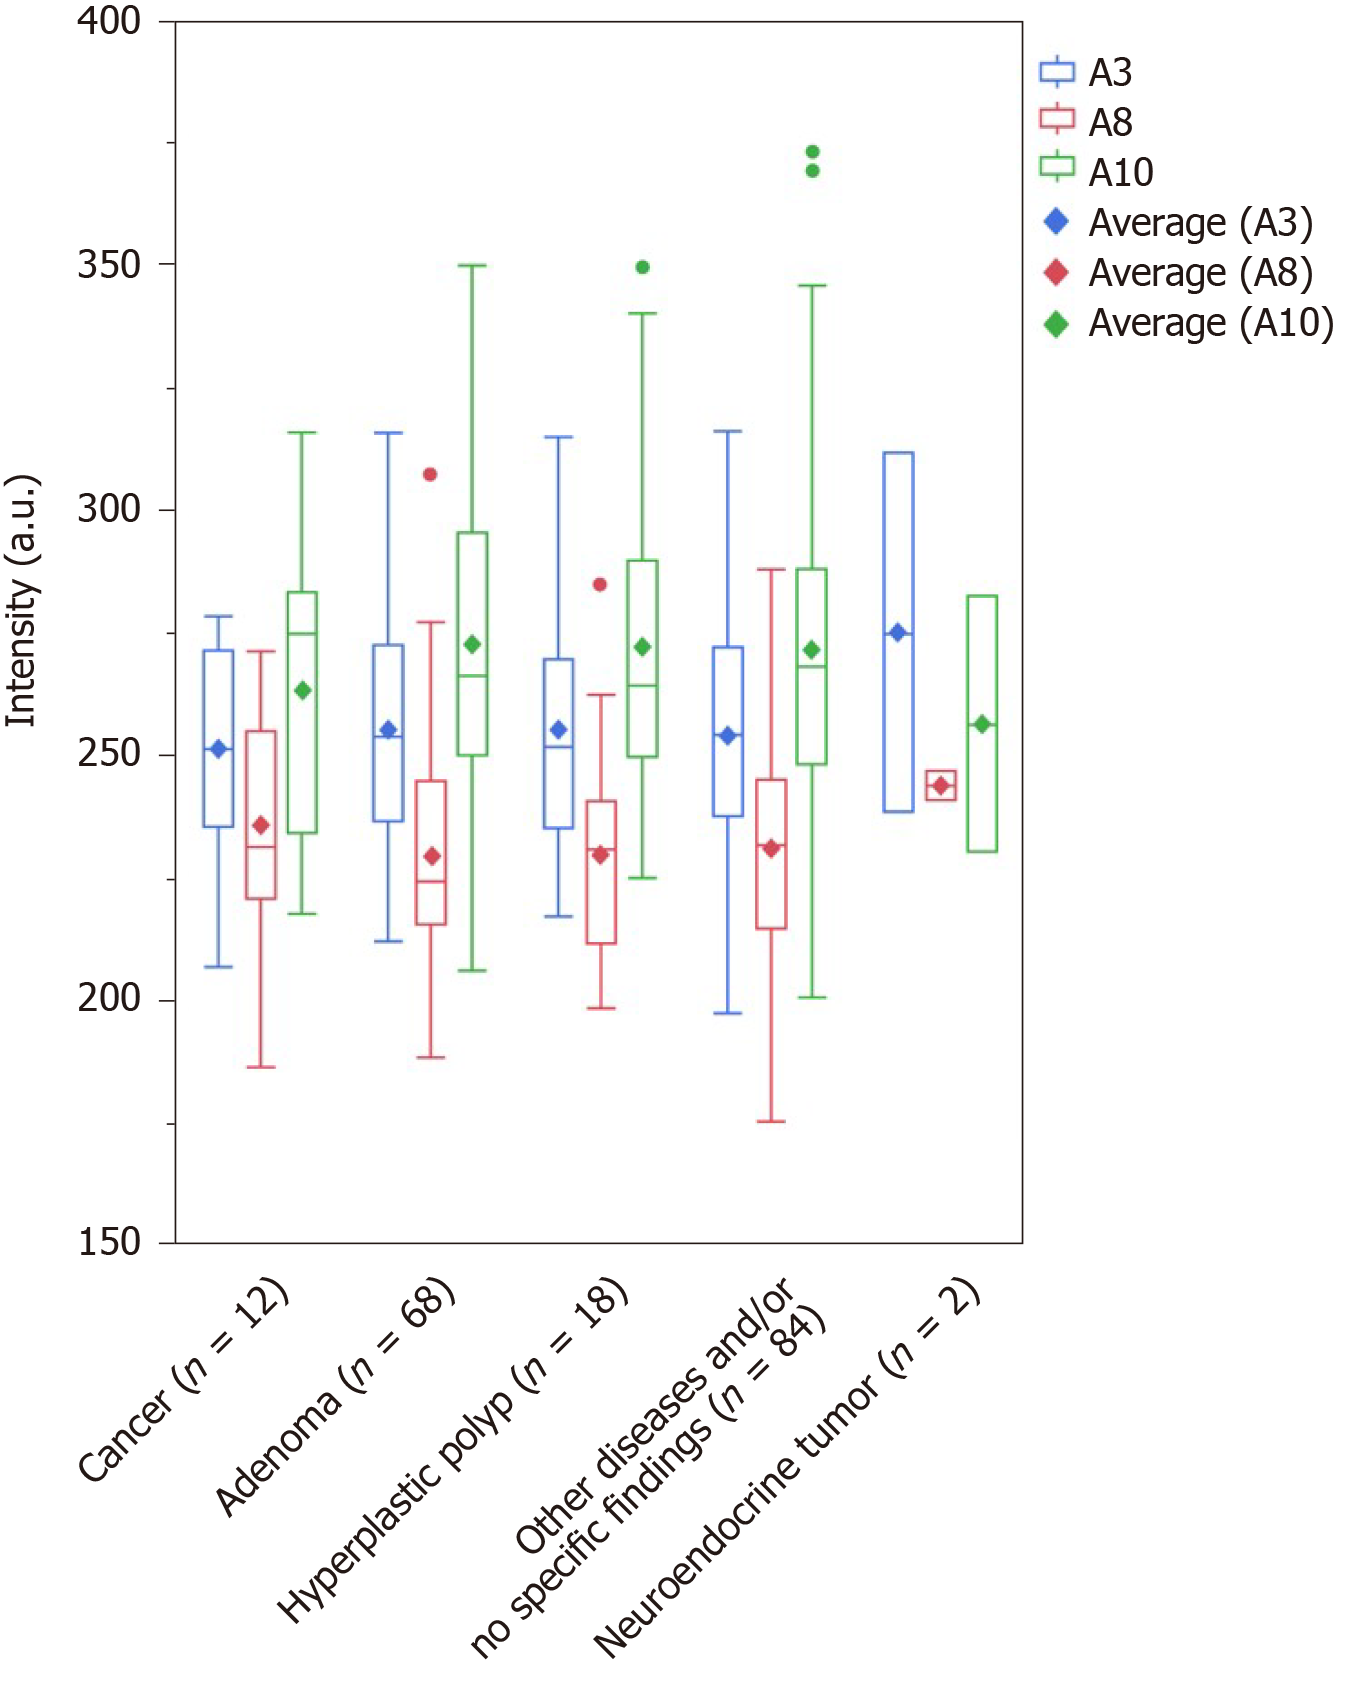
Figure 4 Comparison of intensity.
Outlier box plot depicting the intensity of the scattered light of the sera from the studied patients. The bottom and top parts of the box show the lower and upper quartiles, and the band across the box indicates the median. The lower and upper bars at the ends of the whiskers show the lowest data point within a range spanning 1.5 interquartile ranges of the lower quartile, and the highest data point within a range spanning 1.5 interquartile ranges of the upper quartile. The dots denote outliers that extend beyond the whiskers. The diagonal square indicates average values. However, with no significant deference, the mean scattered light intensity of A8 is higher in the cancer group (235.6) than in the adenoma (229.4), hyperplastic polyp (229.7), and other disease and/or no specific findings (231.0) groups. In addition, with no significant deference, the mean scattered light intensity of A10 is lower in the cancer group (263.4) than in the adenoma (272.4), hyperplastic polyp (272.1), and other disease and/or no specific findings (271.6) groups. With a slight difference, the mean scattered light intensity of A3 tended to be lower in the cancer group (251.3) than that in those with adenomas (255.2), hyperplastic polyps (254.9), and other disease and/or no specific findings (253.9).
- Citation: Ito H, Uragami N, Miyazaki T, Yang W, Issha K, Matsuo K, Kimura S, Arai Y, Tokunaga H, Okada S, Kawamura M, Yokoyama N, Kushima M, Inoue H, Fukagai T, Kamijo Y. Highly accurate colorectal cancer prediction model based on Raman spectroscopy using patient serum. World J Gastrointest Oncol 2020; 12(11): 1311-1324
- URL: https://www.wjgnet.com/1948-5204/full/v12/i11/1311.htm
- DOI: https://dx.doi.org/10.4251/wjgo.v12.i11.1311


