Copyright
©The Author(s) 2020.
World J Gastrointest Oncol. Nov 15, 2020; 12(11): 1216-1236
Published online Nov 15, 2020. doi: 10.4251/wjgo.v12.i11.1216
Published online Nov 15, 2020. doi: 10.4251/wjgo.v12.i11.1216
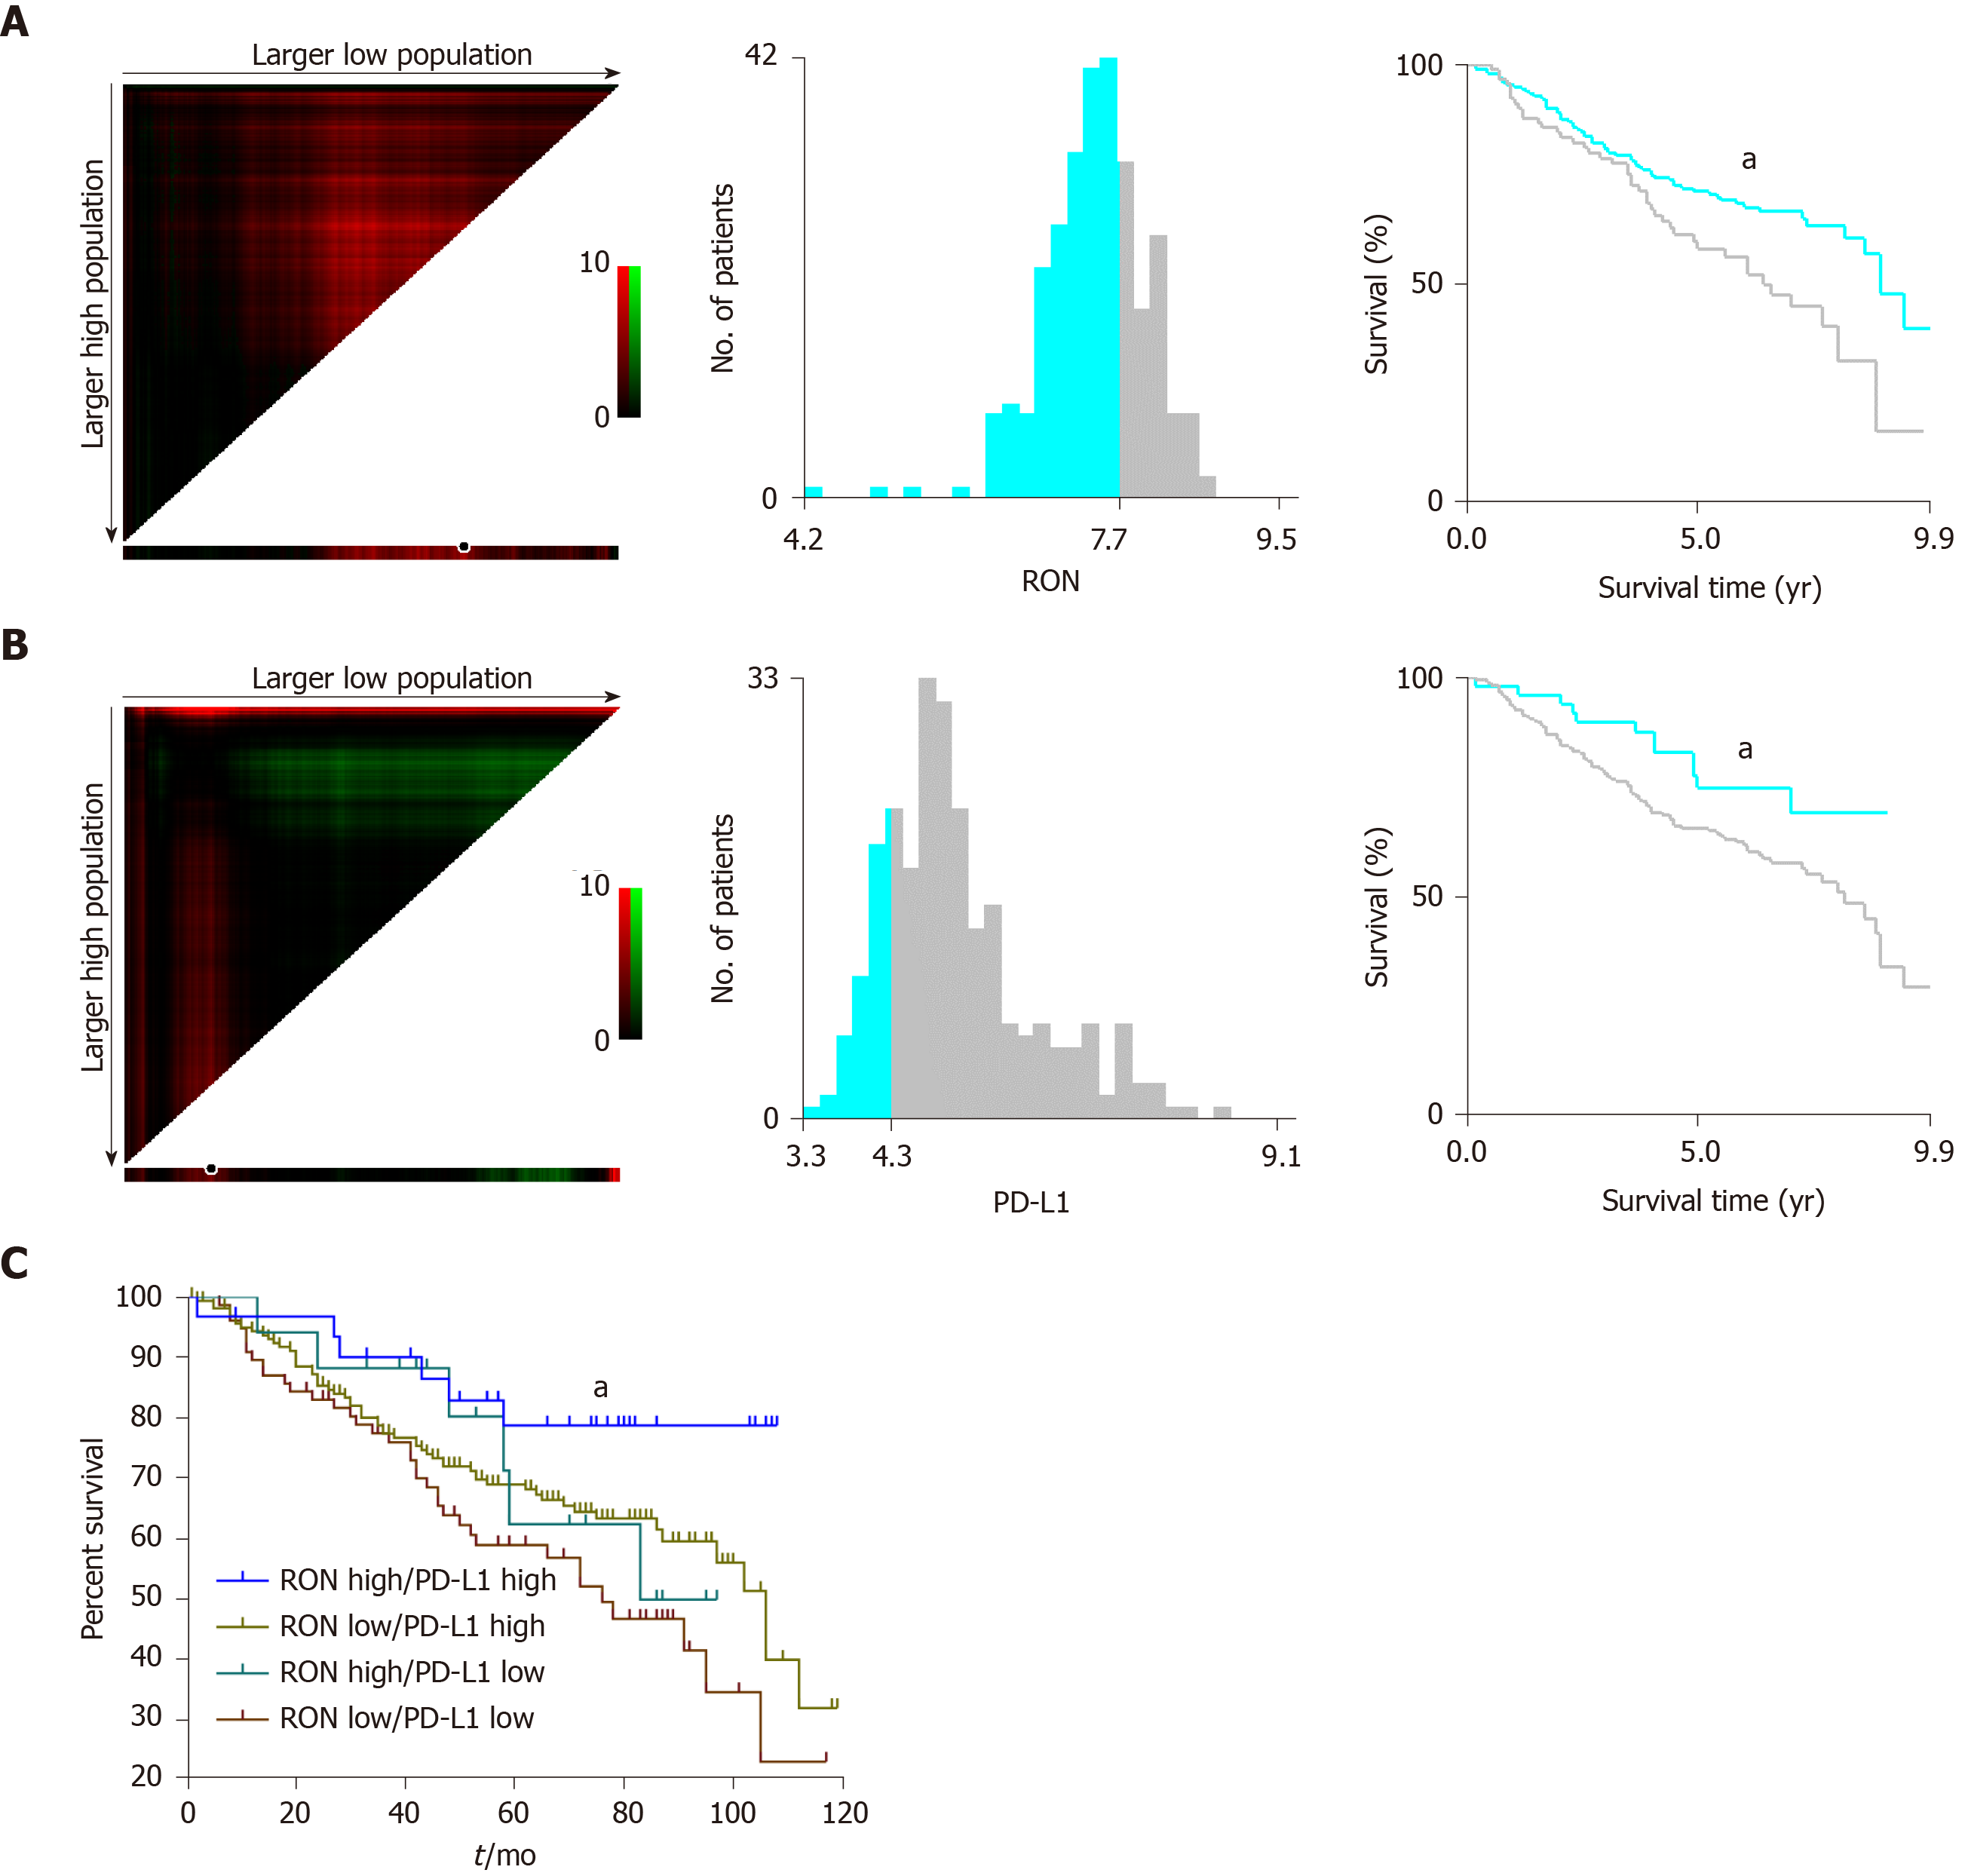
Figure 1 X-tile analysis to determine the optimal cut-off values for RON and PD-L1 expression and survival analysis in the GEO dataset.
The optimal cut-off values are highlighted by black circles (left panels) and shown in histograms for the entire cohort (middle panels). Kaplan-Meier survival plots are shown in right panels. A: The optimal cut-off value for RON was 7.50 (χ2 = 4.544, P = 0.033); B: The optimal cut-off value for PD-L1 was 4.30 (χ2 = 4.078, P = 0.043); C: Effect of different RON and PD-L1 expression states on patient survival. aP < 0.05.
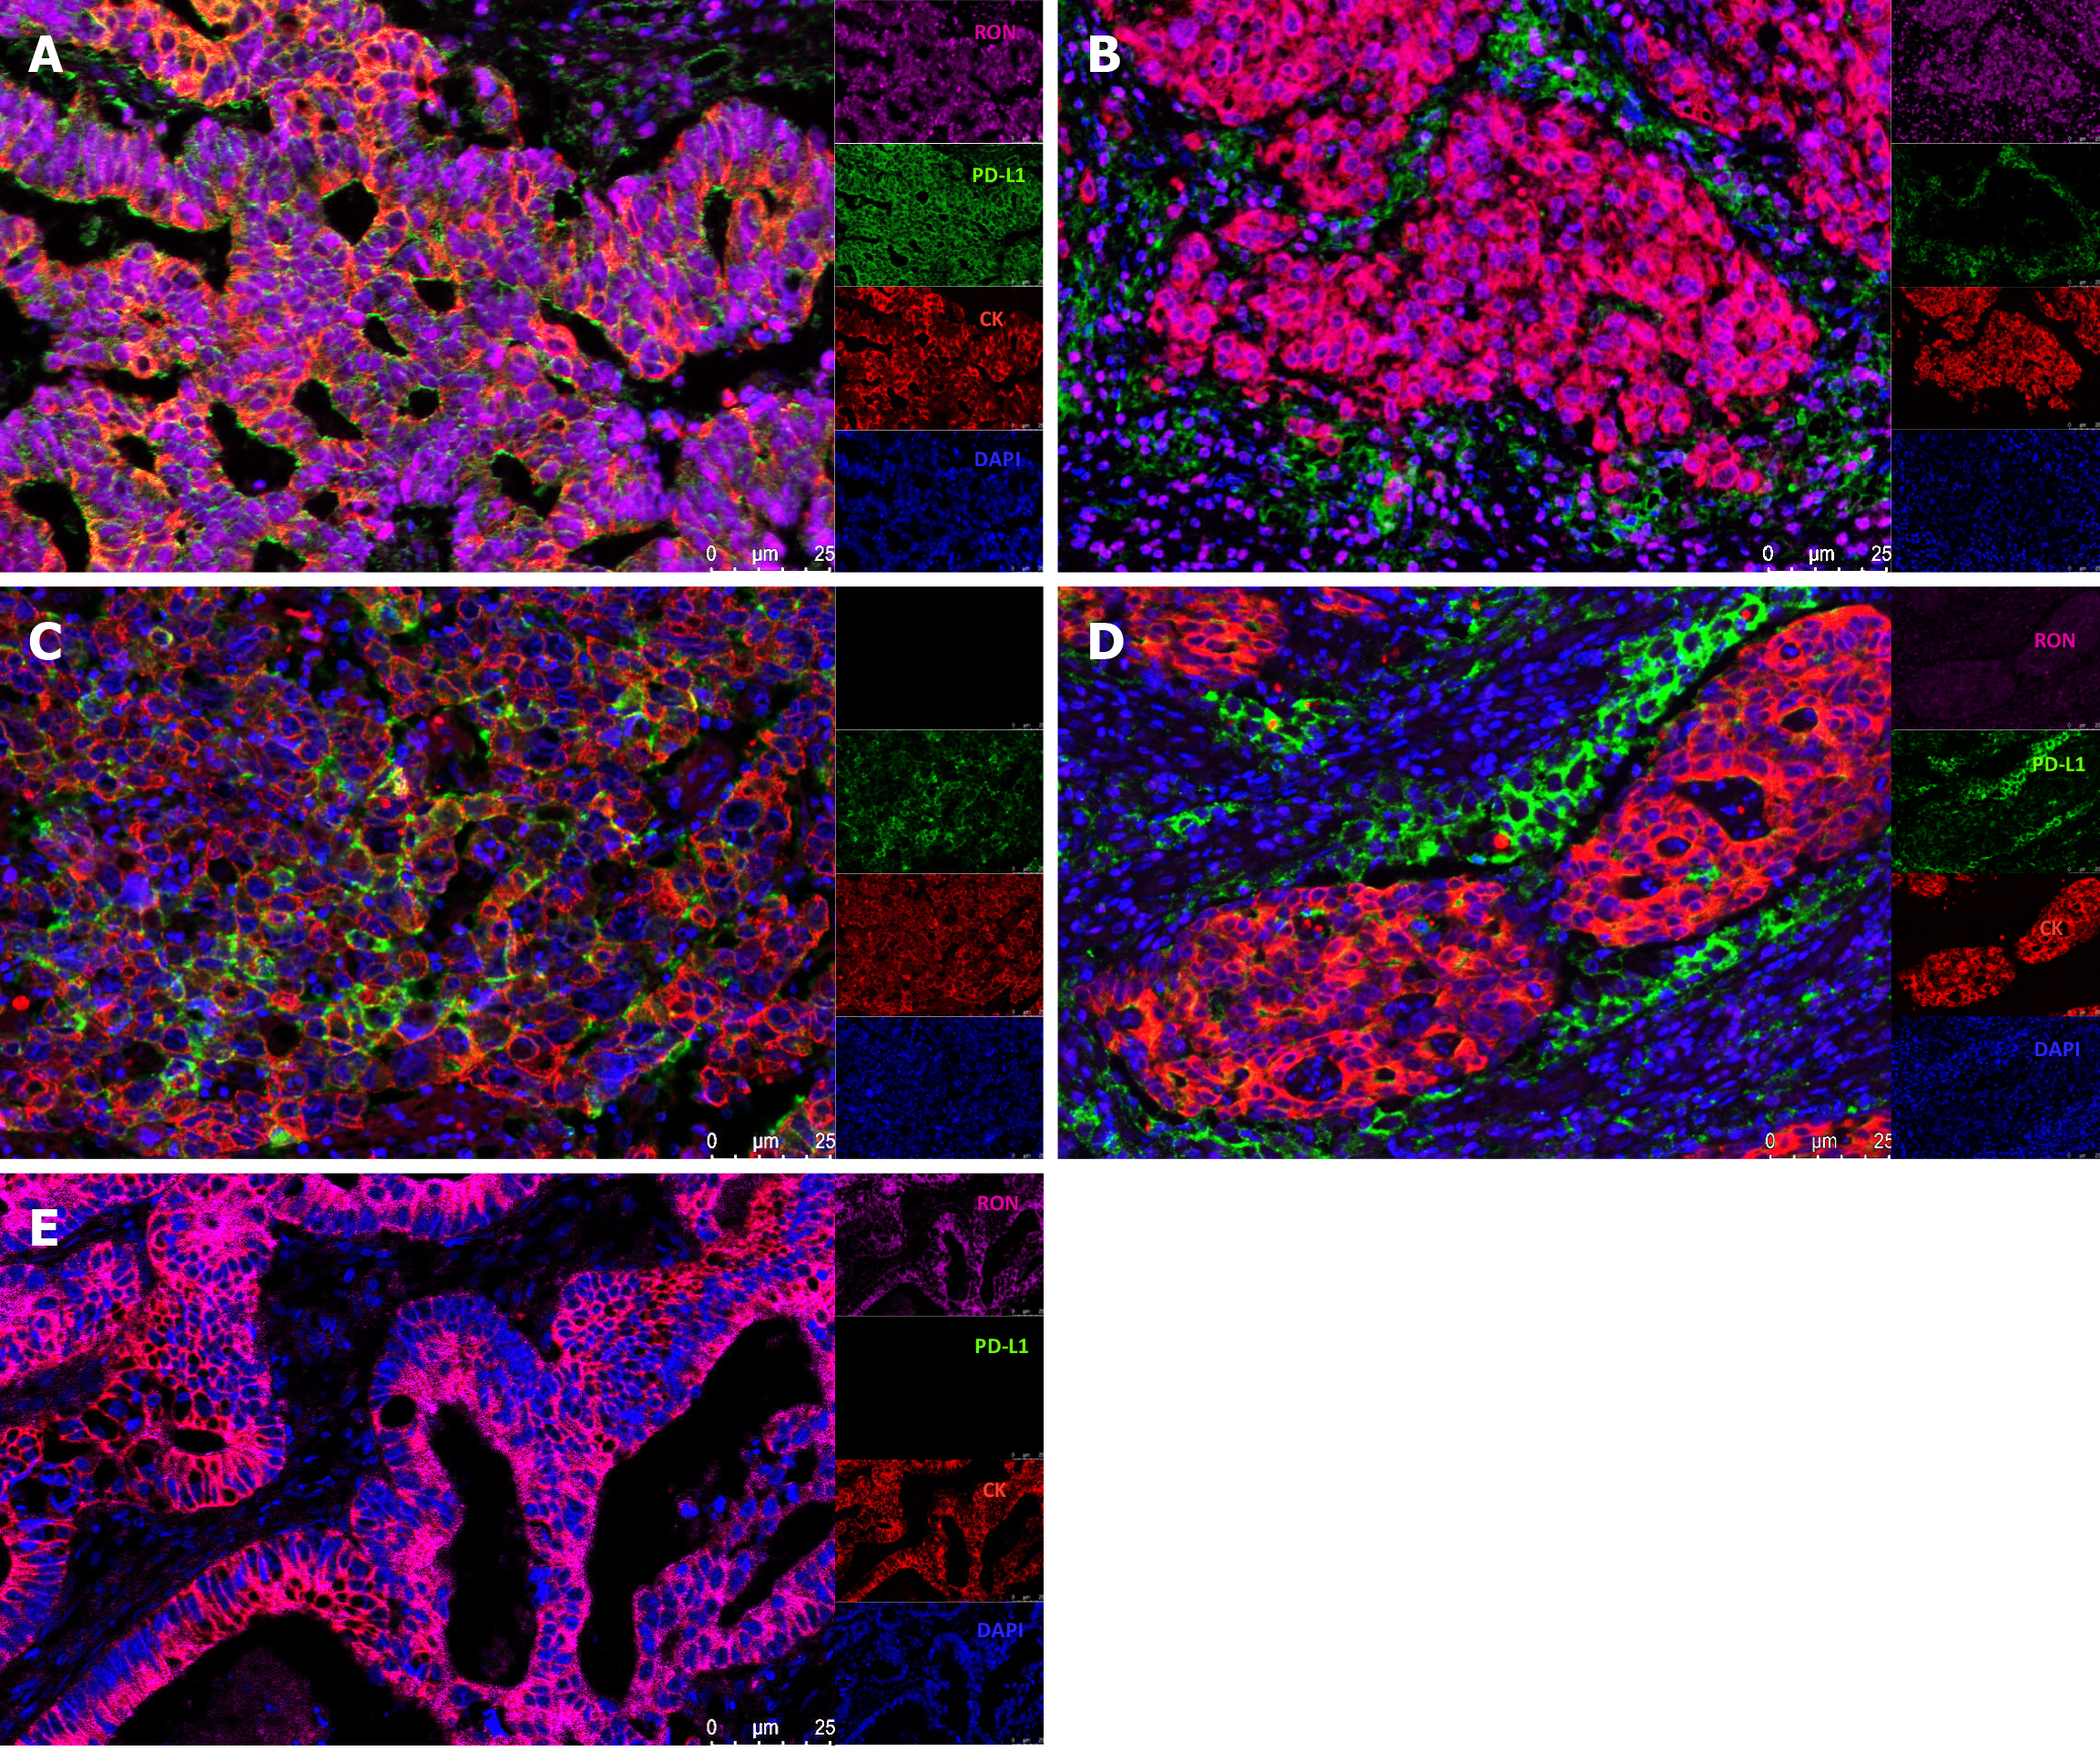
Figure 2 Four-color multiplex immunofluorescence staining of paraffin-embedded colorectal cancer tissues.
A: High expression of RON and PD-L1 in tumor cells (TCs); B: High expression of RON in TCs and high expression of PD-L1 in tumor-infiltrating mononuclear cells (TIMCs); C: Lack of RON expression and high PD-L1 expression in TCs; D: Low expression of RON in TC and high PD-L1 expression in TIMCs; E: High RON expression in TCs and no PD-L1 expression in either TCs or TIMCs. Blue (DAPI) shows nuclei, green shows PD-L1, pink indicates RON, and red displays CK.
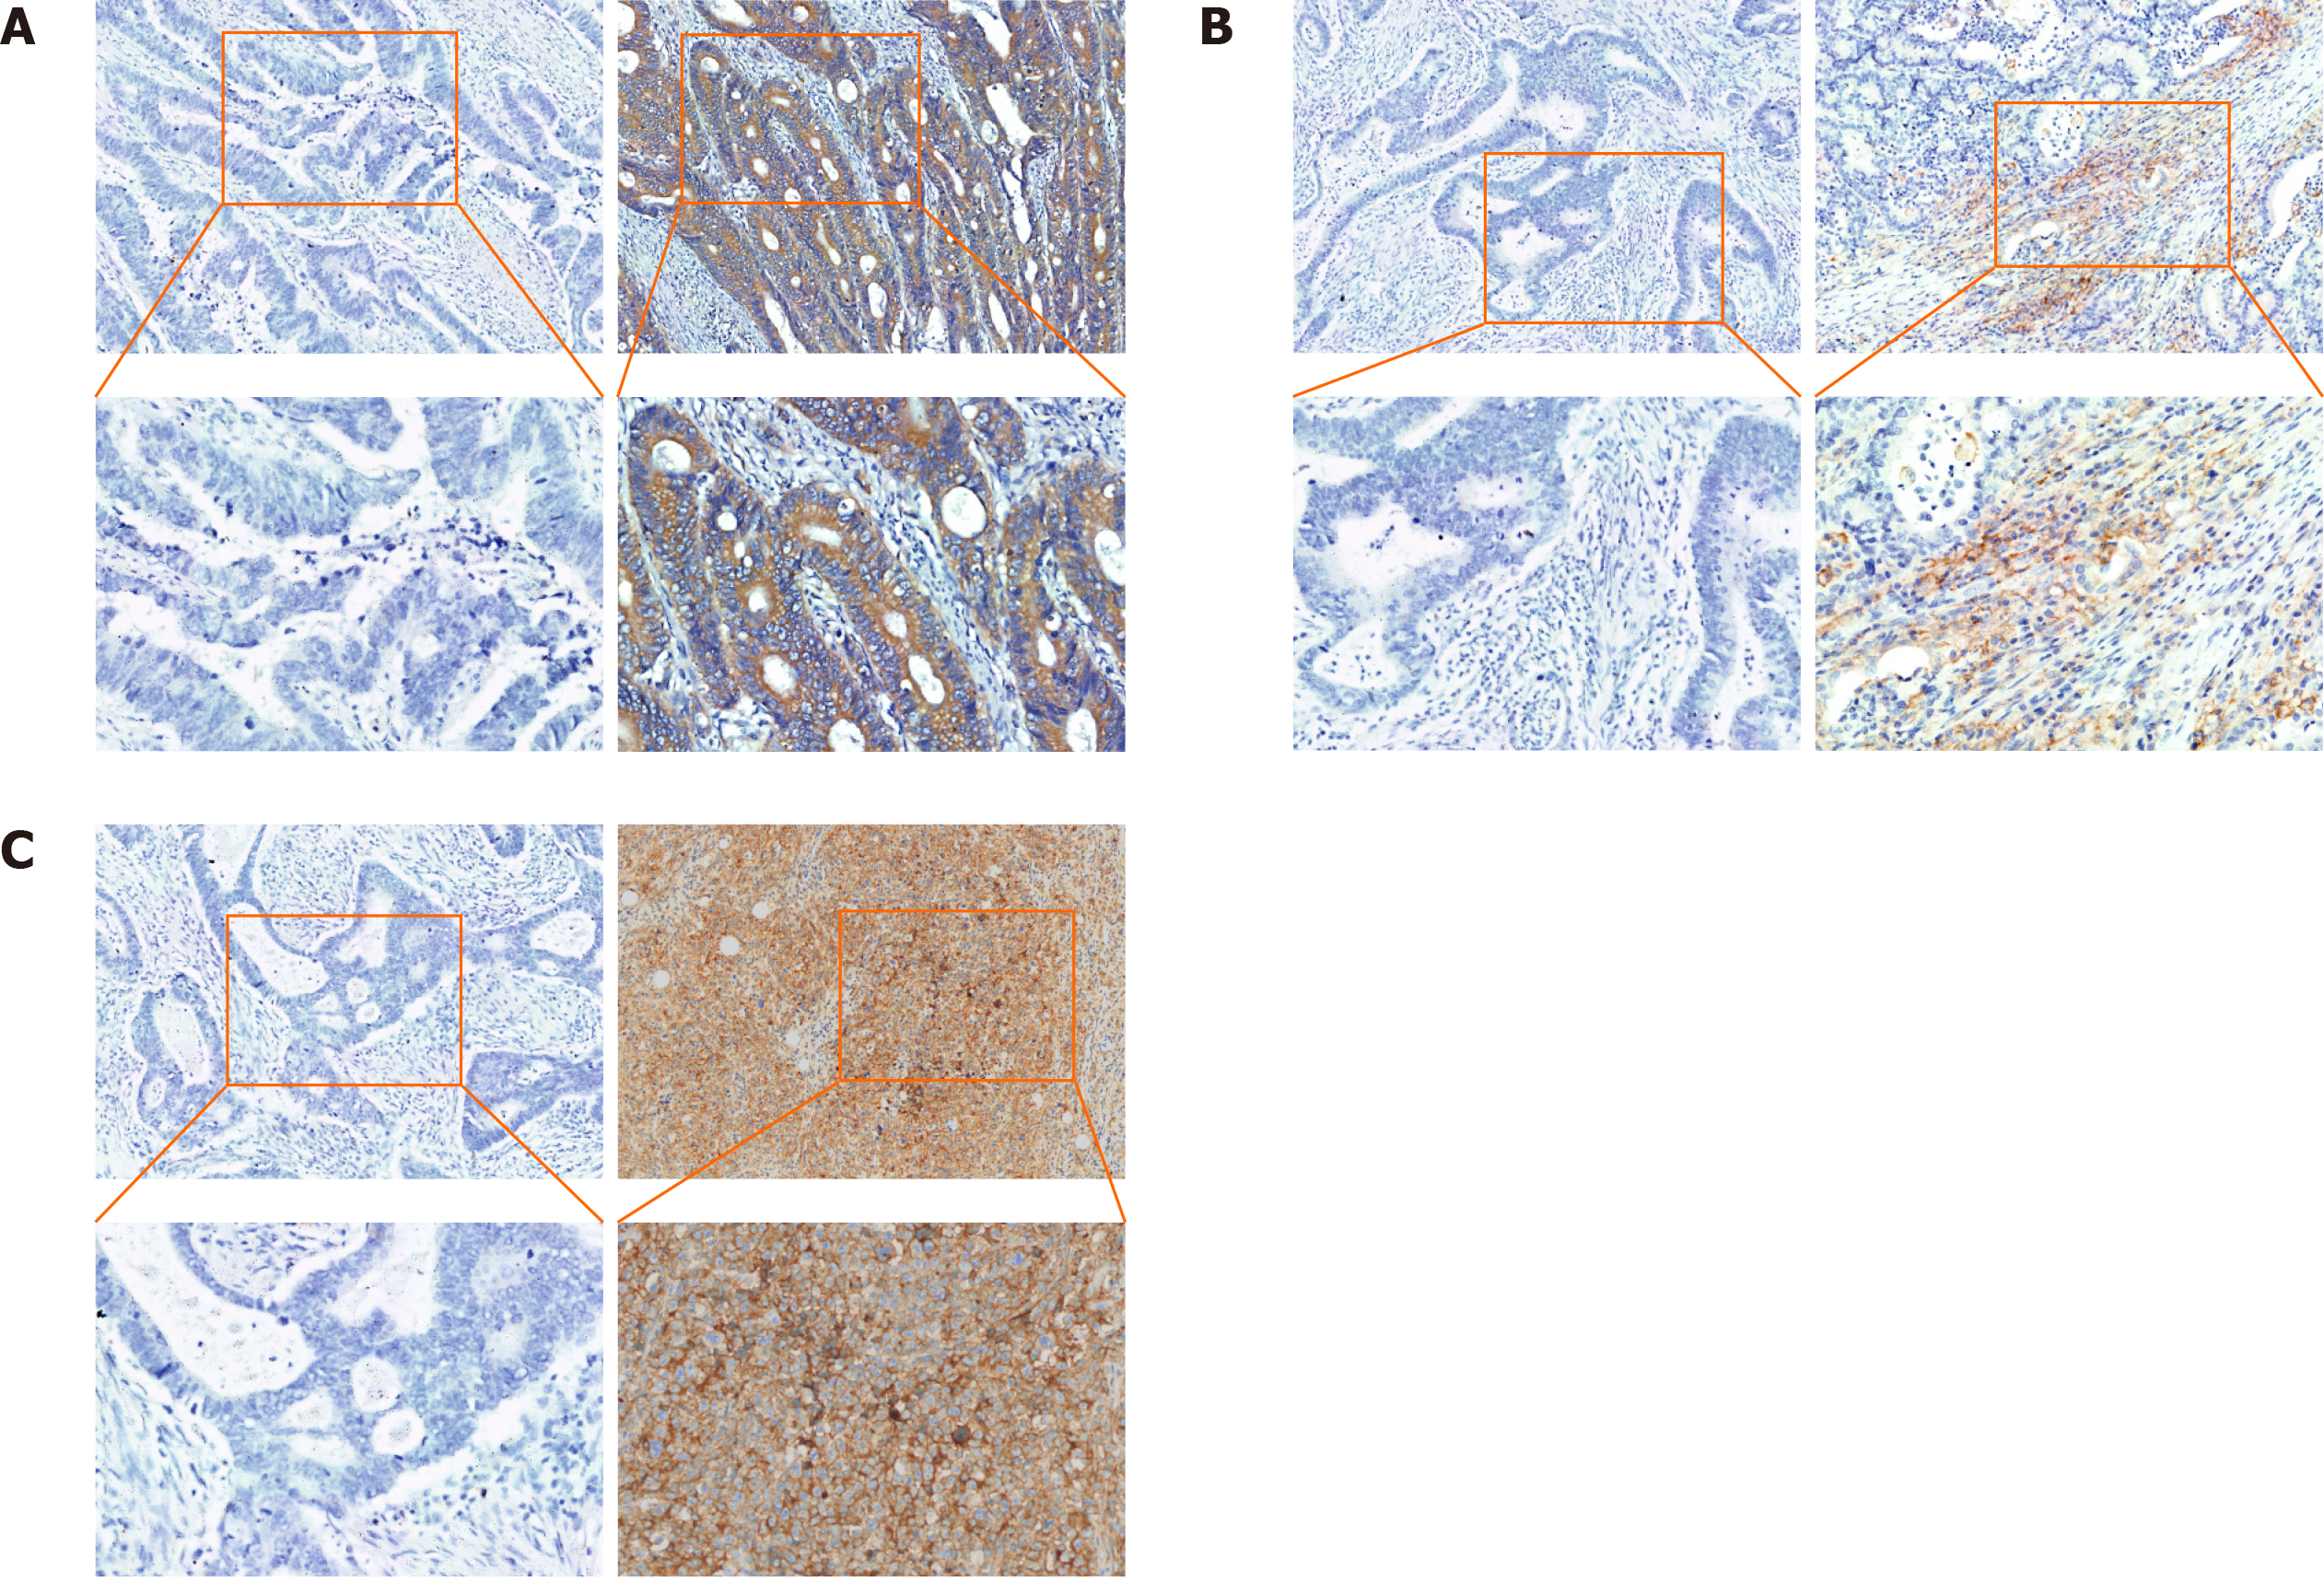
Figure 3 Immunohistochemical expression of RON and PD-L1 in colorectal cancer tissues.
A: High (right) and negative (left) expression of RON in tumor cells (TCs); B: High (right) and negative (left) expression of PD-L1 in tumor-infiltrating mononuclear cells; C: High and negative expression of PD-L1 in TCs (original magnification, × 100 and × 200).
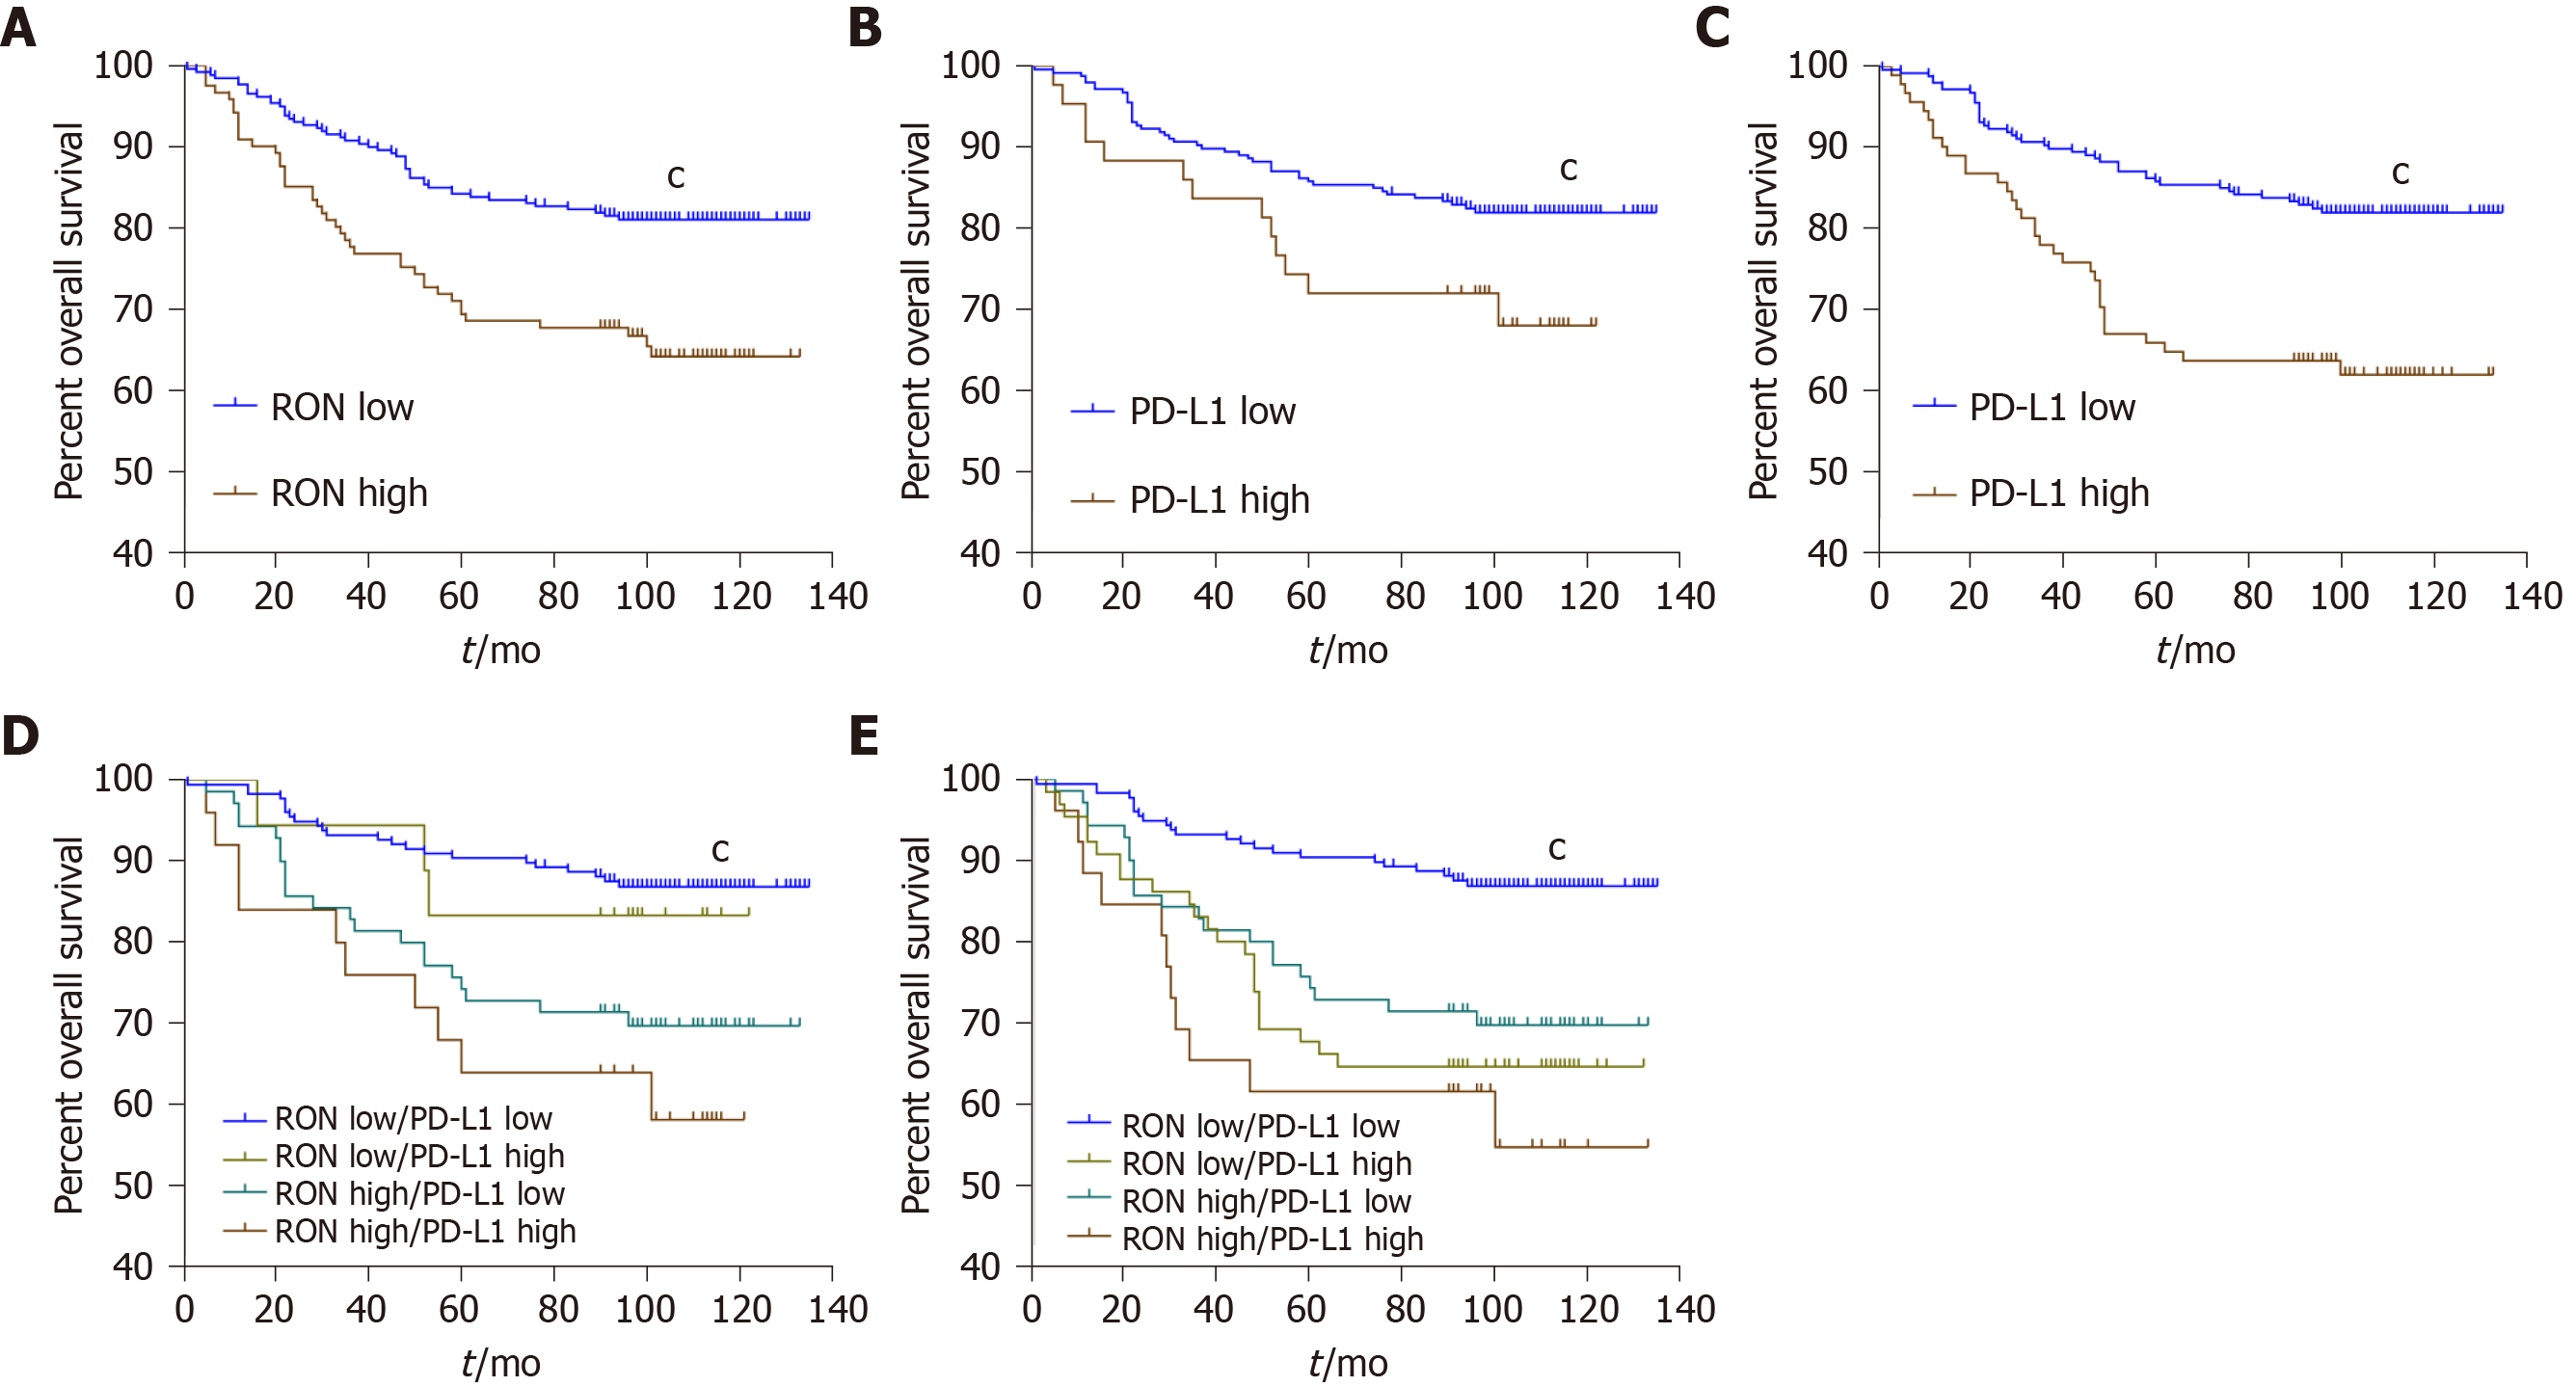
Figure 4 Kaplan-Meier analysis of overall survival of patients with colorectal cancer stratified by RON and/or PD-L1 expression.
A: Overall survival (OS) according to RON expression in tumor cells (TCs); B: OS according to PD-L1 expression in TCs; C: OS according to PD-L1 expression in tumor-infiltrating mononuclear cells (TIMCs); D: OS according to RON and PD-L1 expression in TCs; E: OS according to RON expression in TCs and PD-L1 expression in TIMCs. aP < 0.05, bP < 0.01, cP < 0.001.
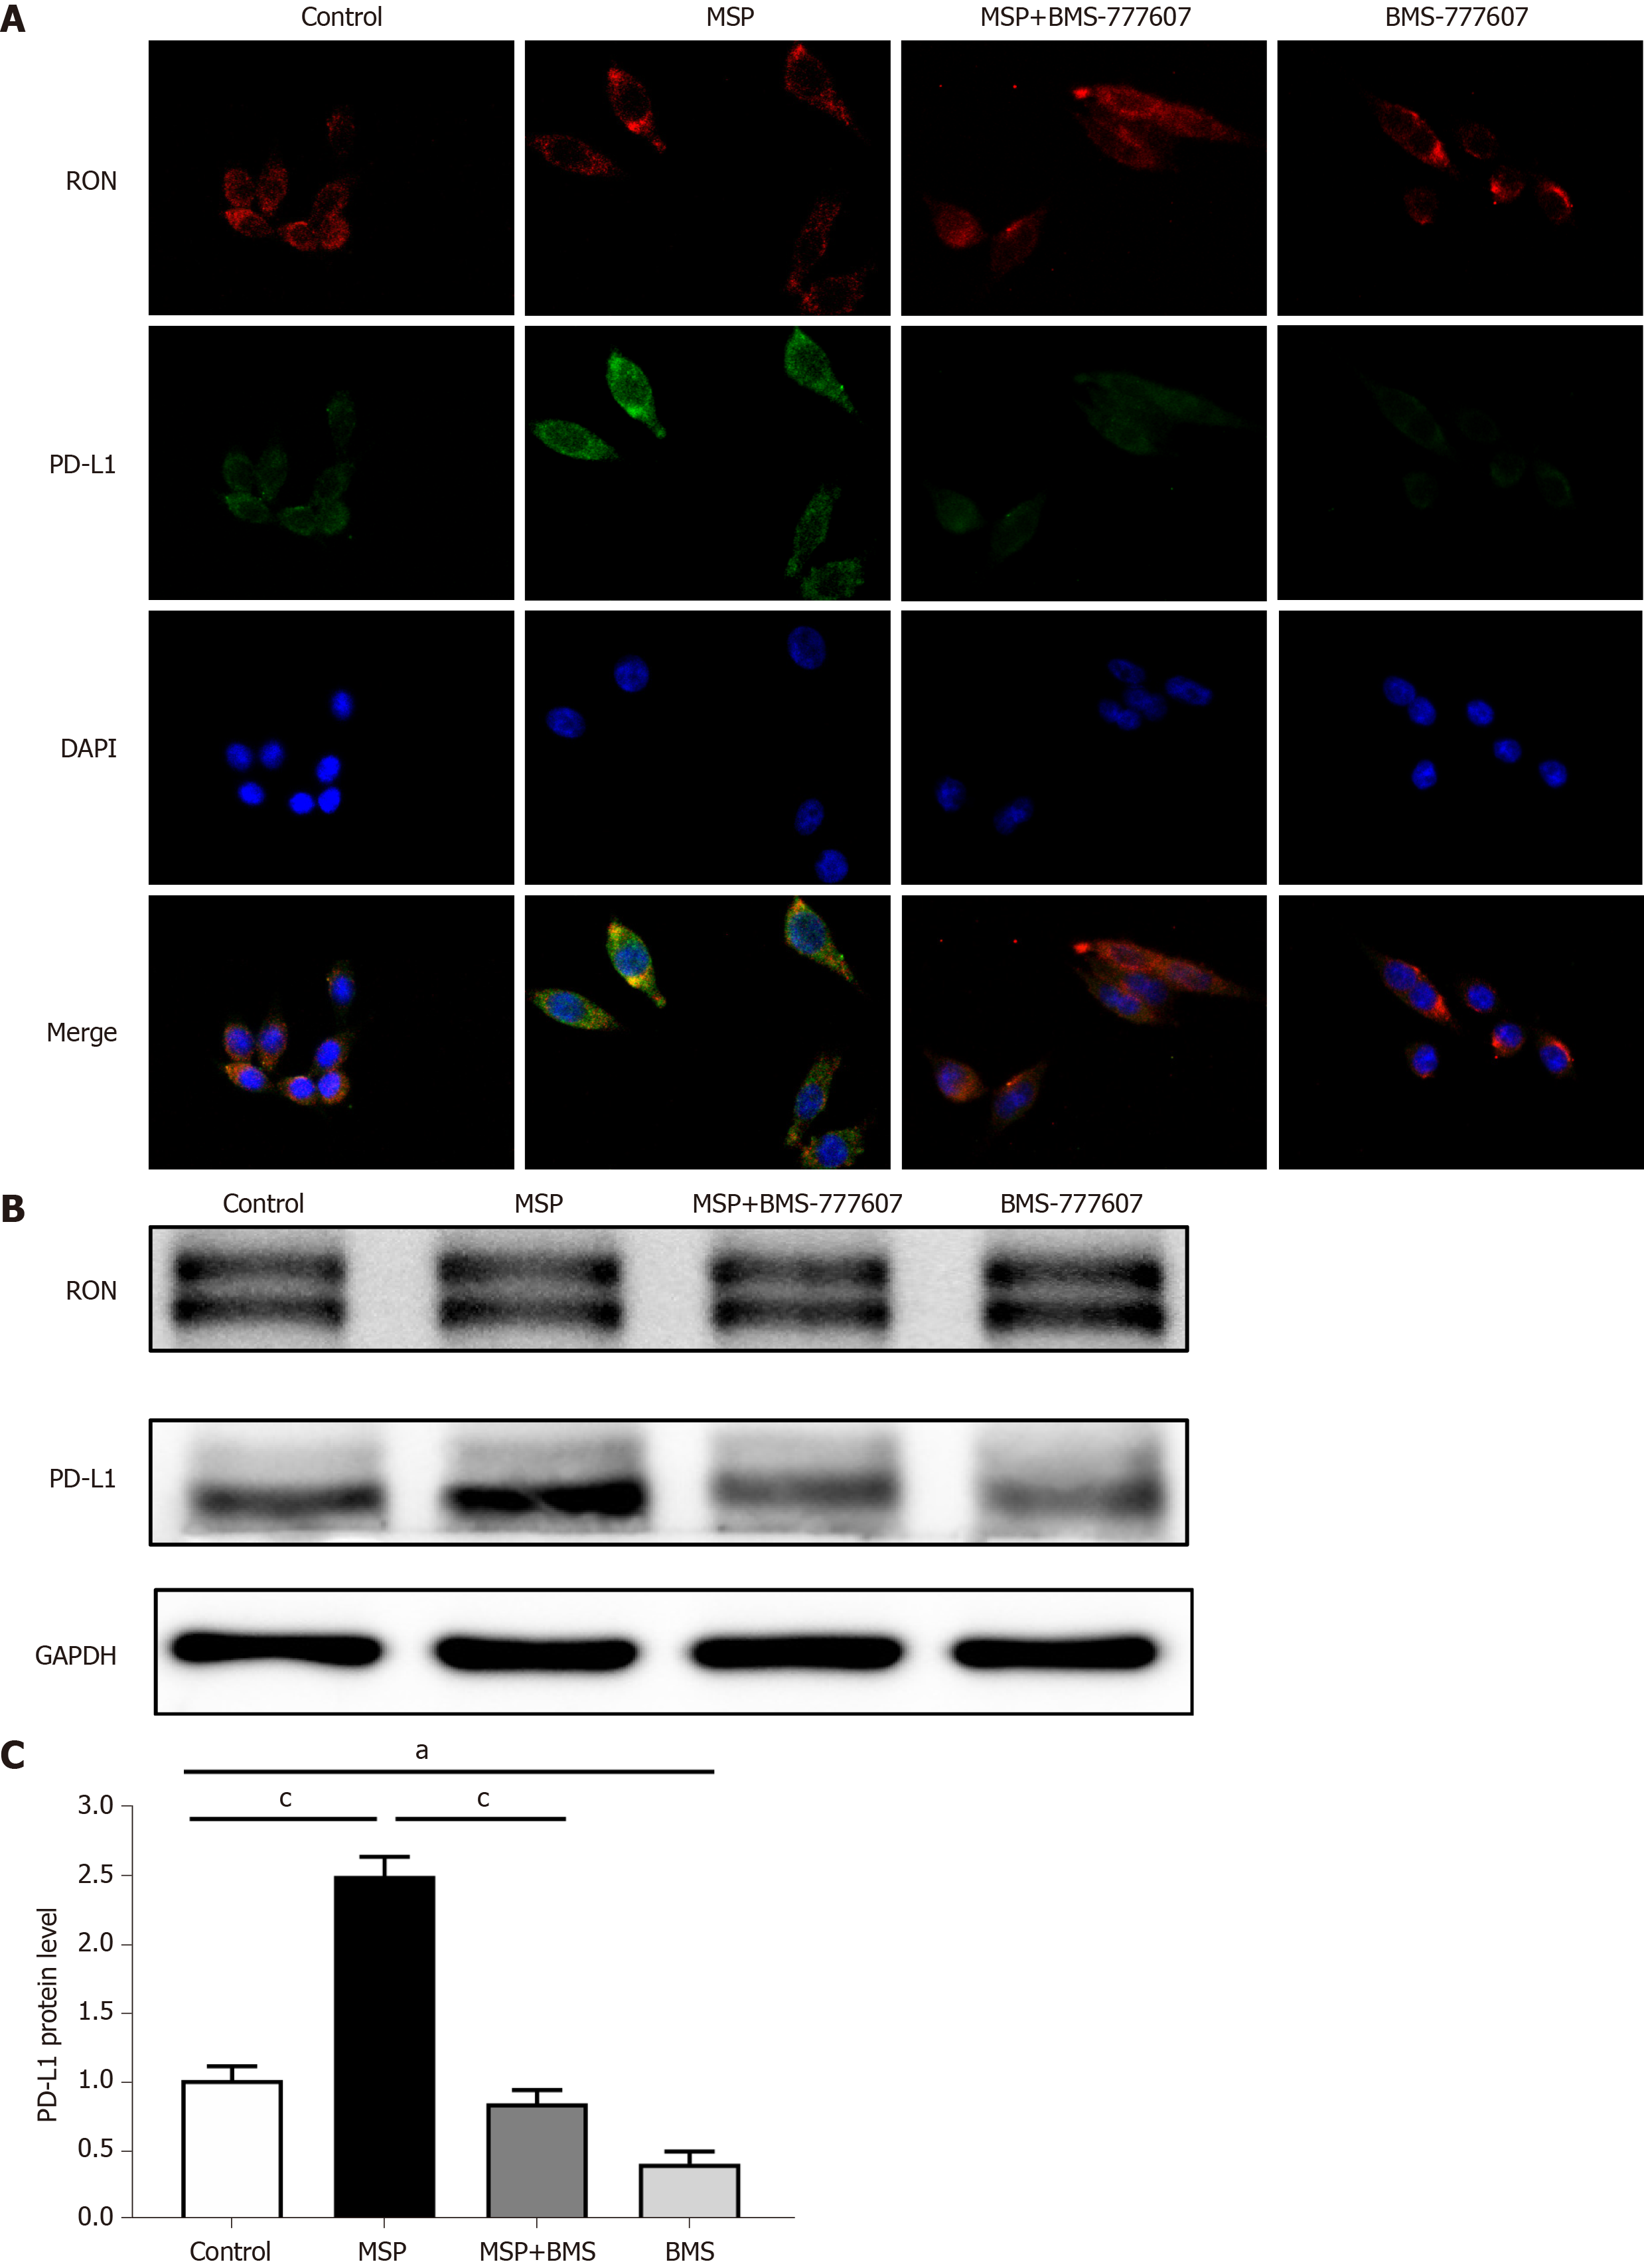
Figure 5 Expression of RON and PD-L1 in HT29 cells after treatment with 2 nmol/L MSP, 2 nmol/L MSP + 2 μmol/L BMS-777607, or 2 μmol/L BMS-777607.
A: Cellular immunofluorescence indicating the expression of RON and PD-L1 after treatment of HT29 cells with 2 nmol/L MSP, 2 nmol/L MSP + 2 μmol/L BMS-777607, or 2 μmol/L BMS-777607 for 24 h, respectively. DAPI indicates nuclei (blue color), FITC indicates PD-L1 (green color), and PE indicates RON (red color). Original magnification × 400 (all photomicrographs). B-C: HT29 cells were treated with 2 nmol/L MSP, 2 nmol/L MSP + 2 μmol/L BMS-777607, or 2 μmol/L BMS-777607 for 24 h, and the expression of RON and PD-L1 was detected by Western blot and quantified according to the immunoblots. aP < 0.05, bP < 0.01, cP < 0.001.
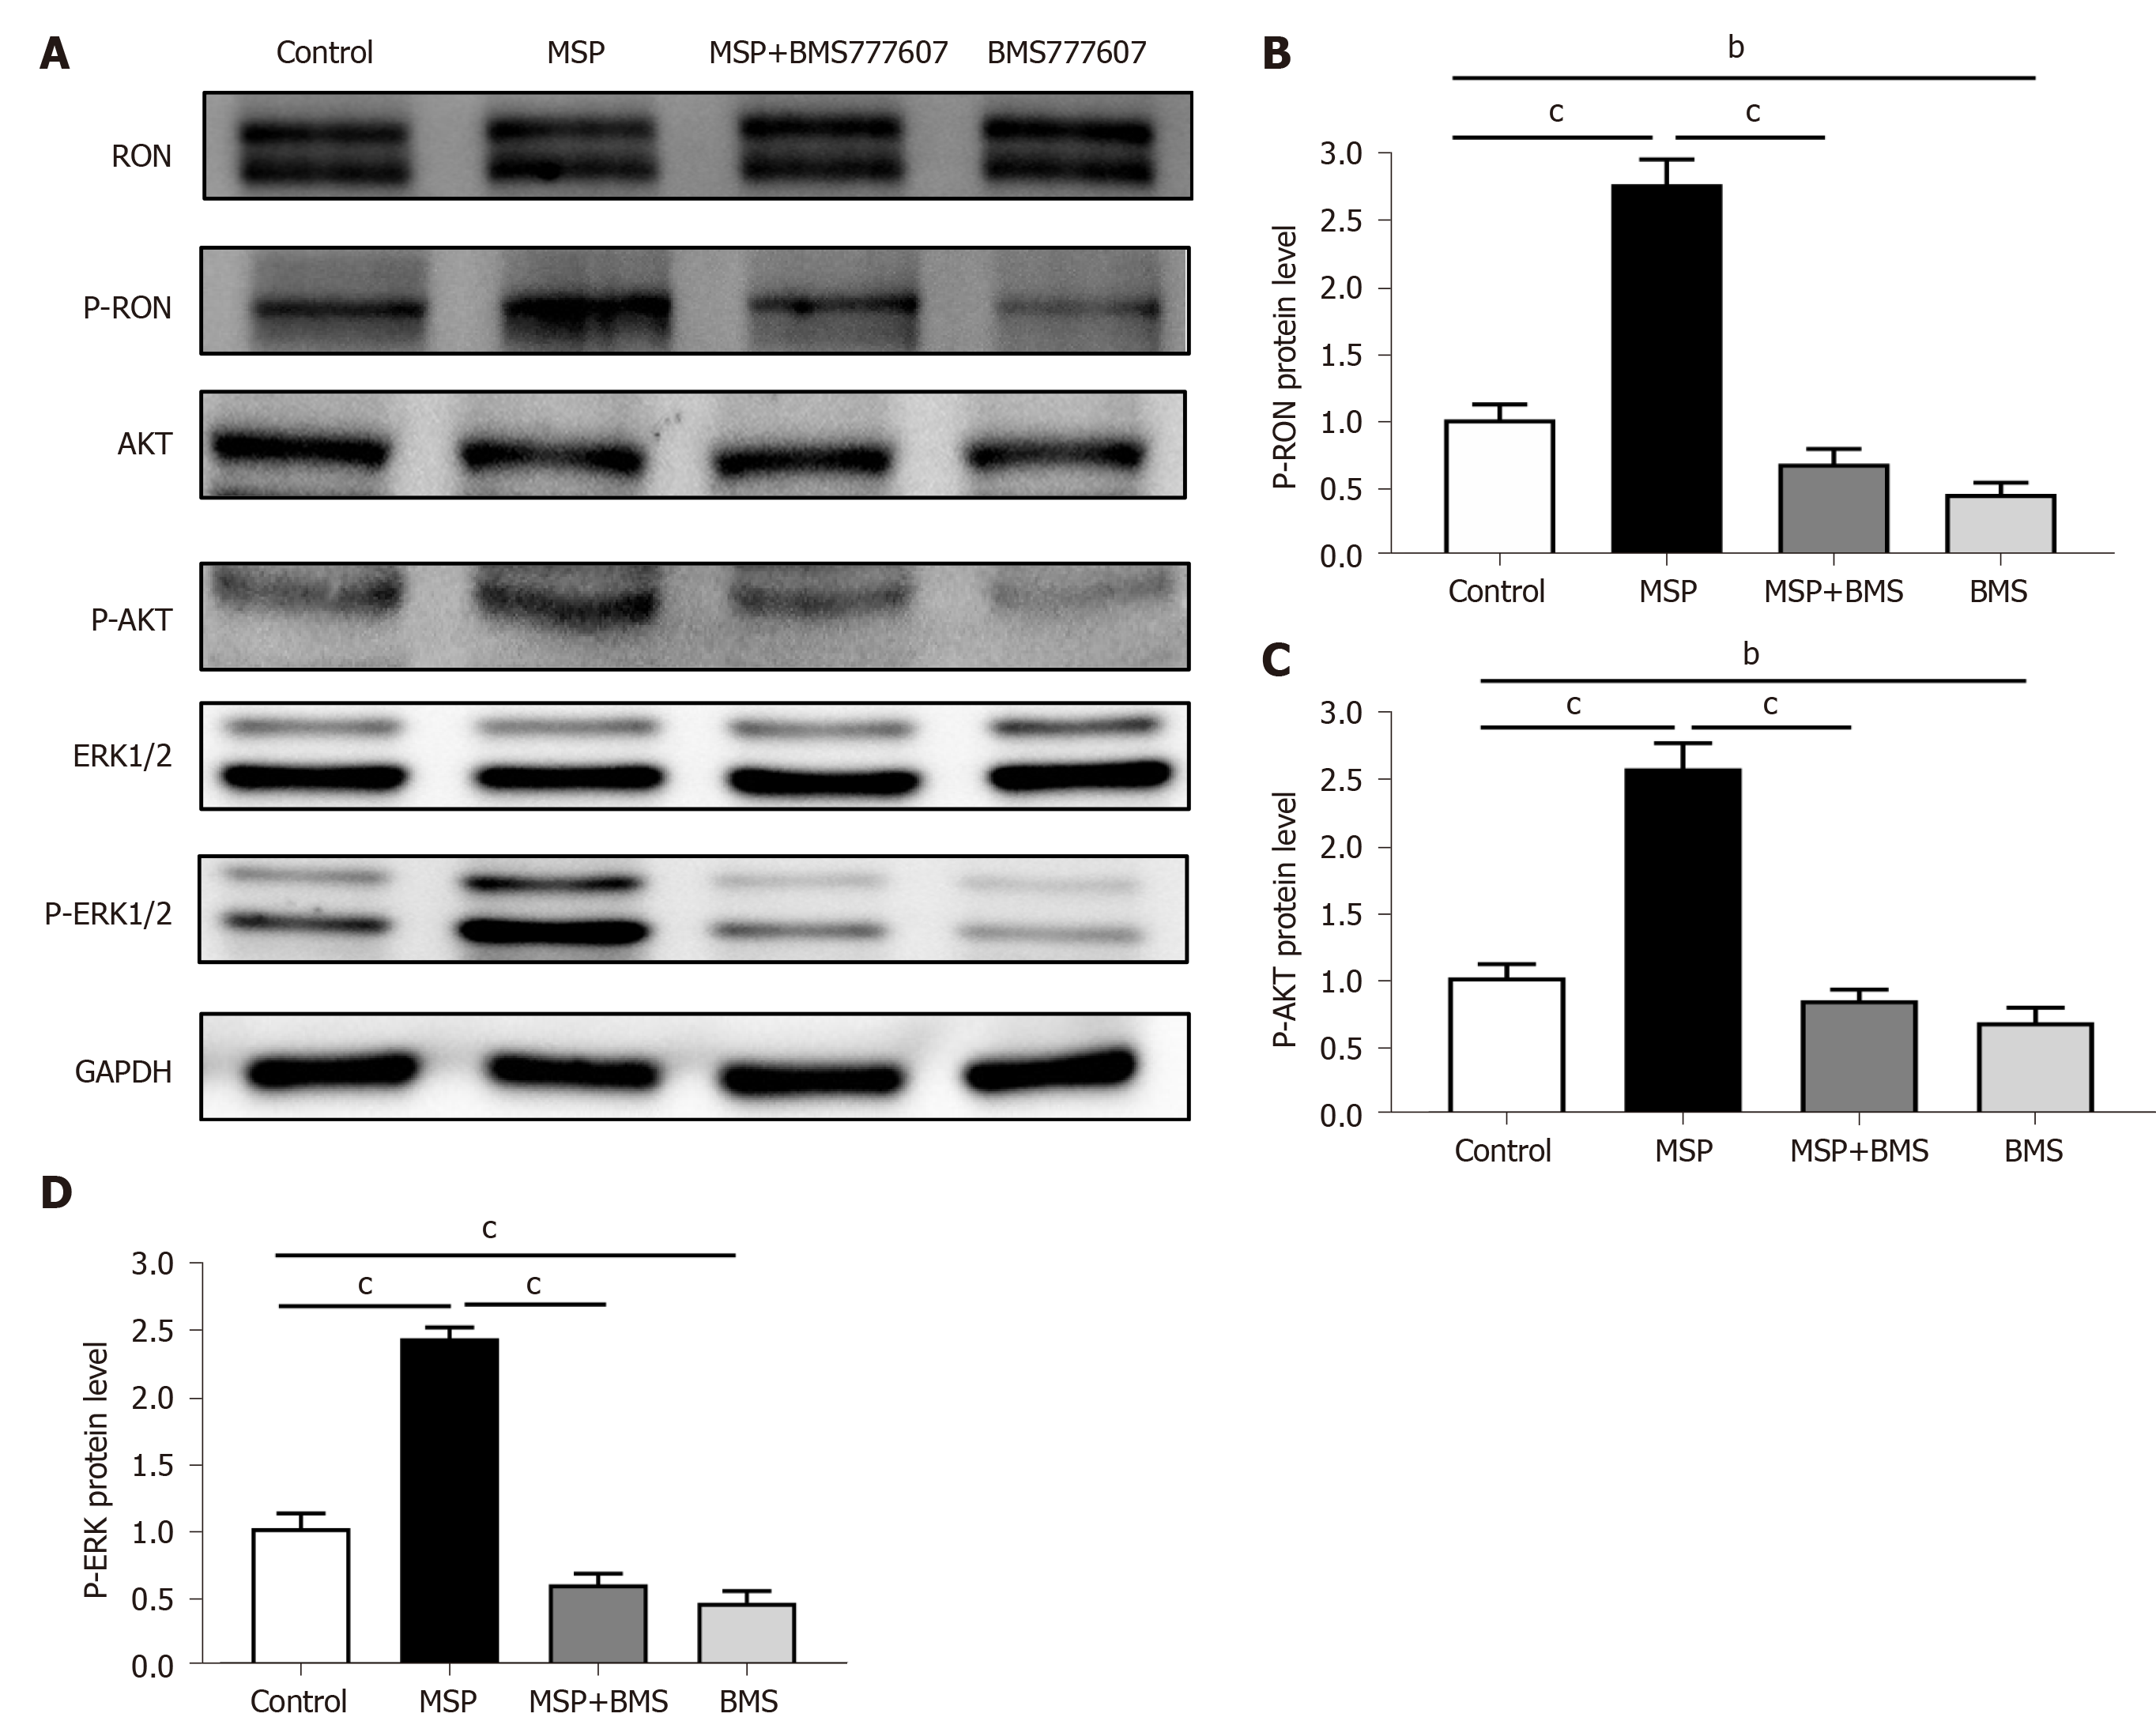
Figure 6 Expression of RON and PD-L1, and activation of signaling pathways in HT29 cells.
A: HT29 cells were treated with 2 nmol/L MSP, 2 nmol/L MSP + 2 μmol/L BMS-777607, or 2 μmol/L BMS-777607 for 1 h. The proteins analyzed include RON, phosphorylated RON, AKT, ERK1/2, phosphorylated AKT, and phosphorylated-ERK1/2. GAPDH was used as a loading control; B-D: The expression of p-RON, p-AKT, and p-ERK1/2 was detected by Western blot and quantified. aP < 0.05, bP < 0.01, cP < 0.001.
- Citation: Liu YZ, Han DT, Shi DR, Hong B, Qian Y, Wu ZG, Yao SH, Tang TM, Wang MH, Xu XM, Yao HP. Pathological significance of abnormal recepteur d’origine nantais and programmed death ligand 1 expression in colorectal cancer. World J Gastrointest Oncol 2020; 12(11): 1216-1236
- URL: https://www.wjgnet.com/1948-5204/full/v12/i11/1216.htm
- DOI: https://dx.doi.org/10.4251/wjgo.v12.i11.1216


