Copyright
©The Author(s) 2020.
World J Gastrointest Oncol. Oct 15, 2020; 12(10): 1104-1118
Published online Oct 15, 2020. doi: 10.4251/wjgo.v12.i10.1104
Published online Oct 15, 2020. doi: 10.4251/wjgo.v12.i10.1104
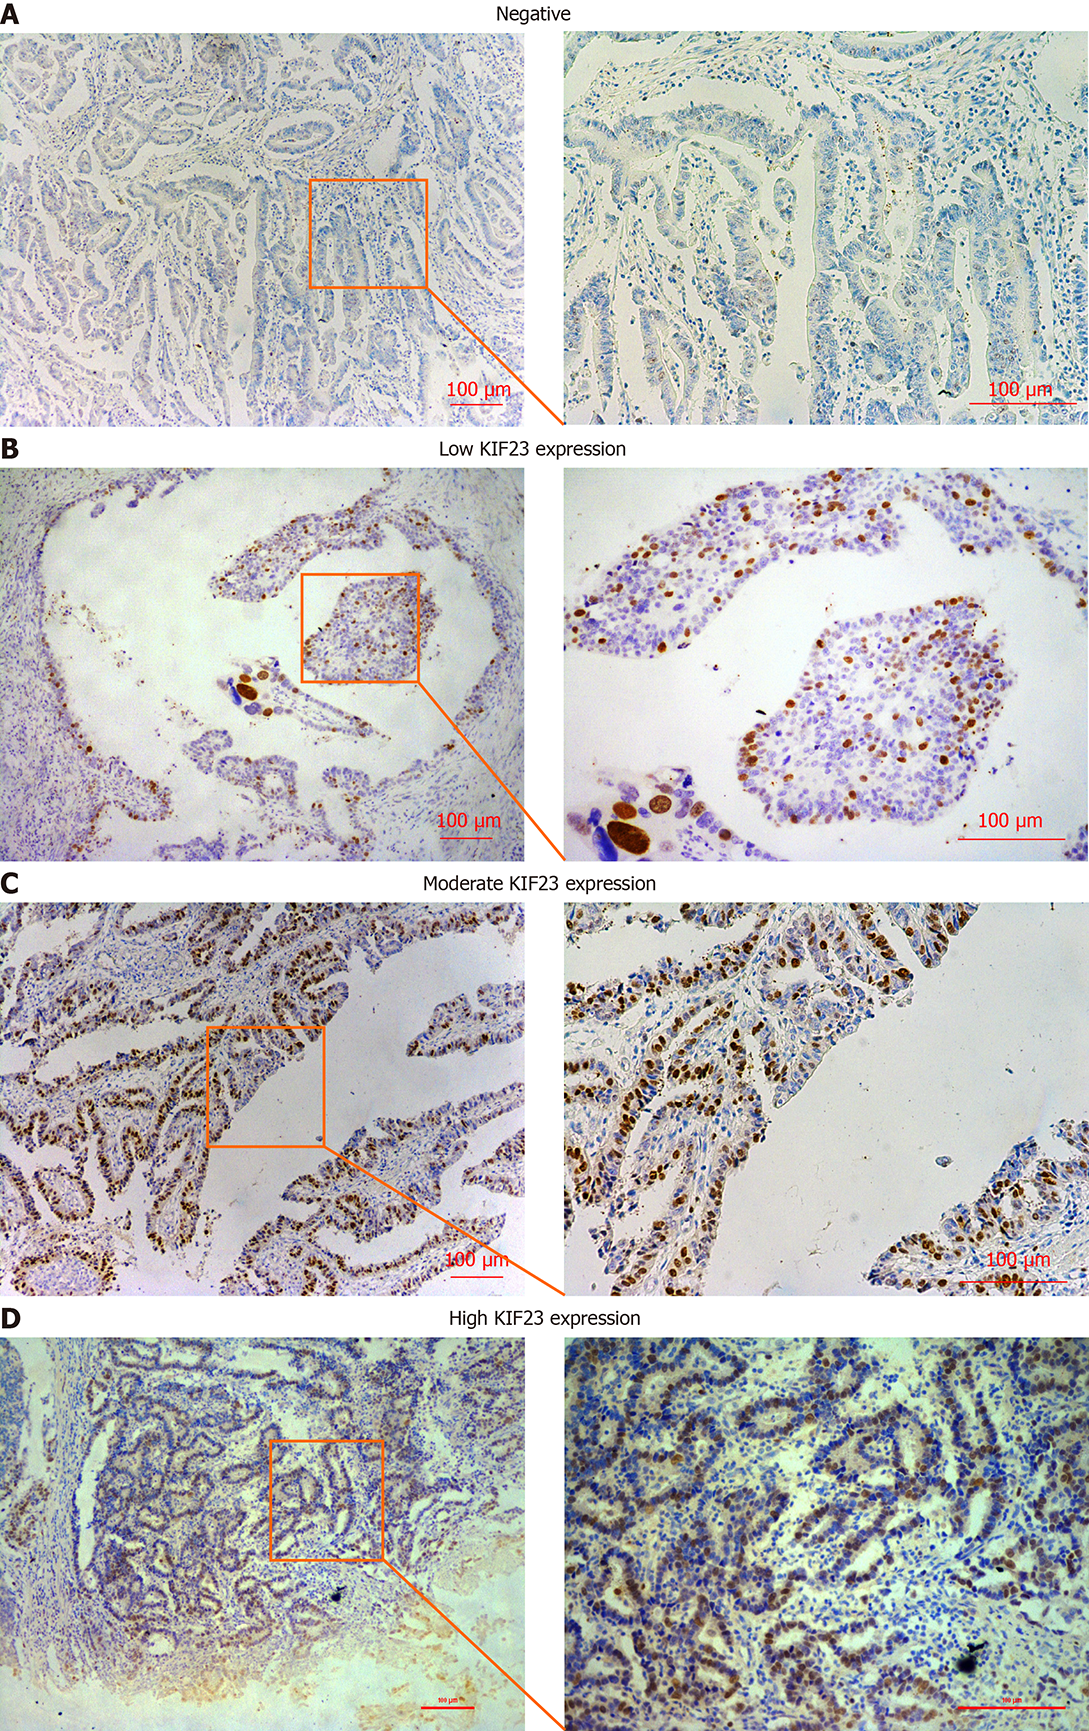
Figure 1 Immunohistochemical staining for KIF23 protein in gastric cancer.
A: Negative; B: Low expression; C: Medium expression; D: High expression.
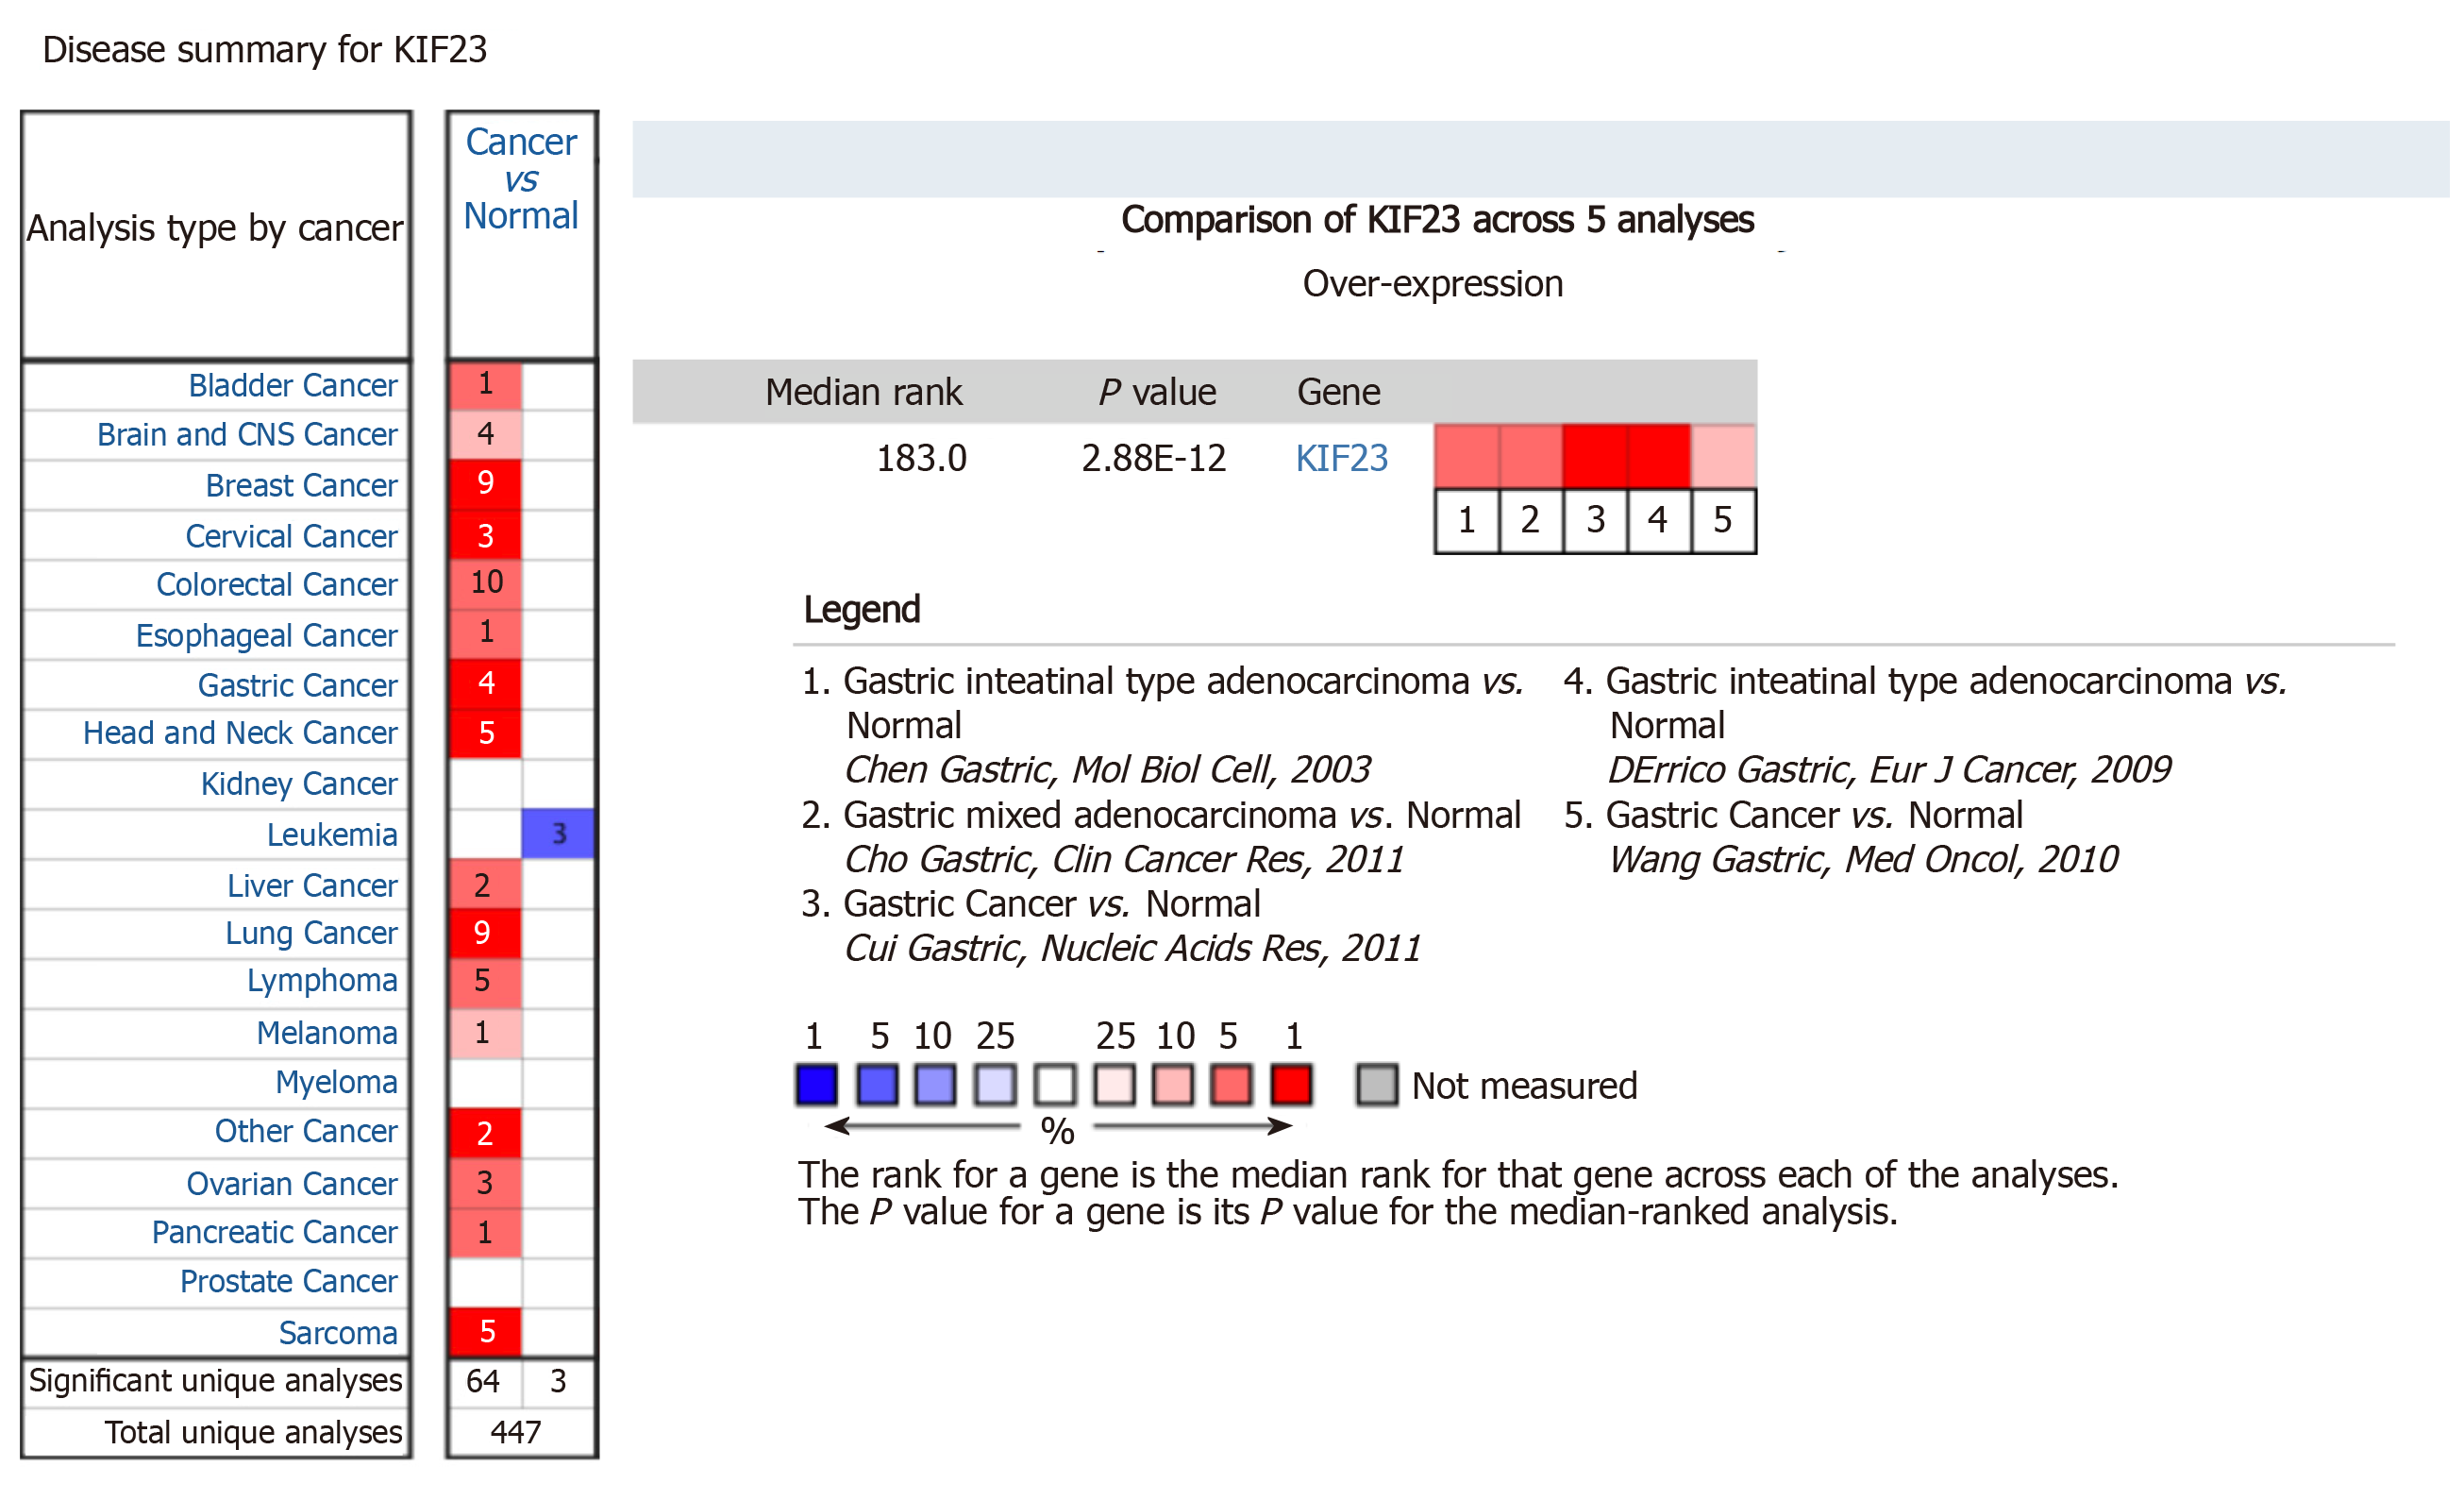
Figure 2 KIF23 mRNA expression in tumors according to Oncomine database.
A statistically significant dataset of high (red) or low (blue) KIF23 gene expression (cancer vs normal).
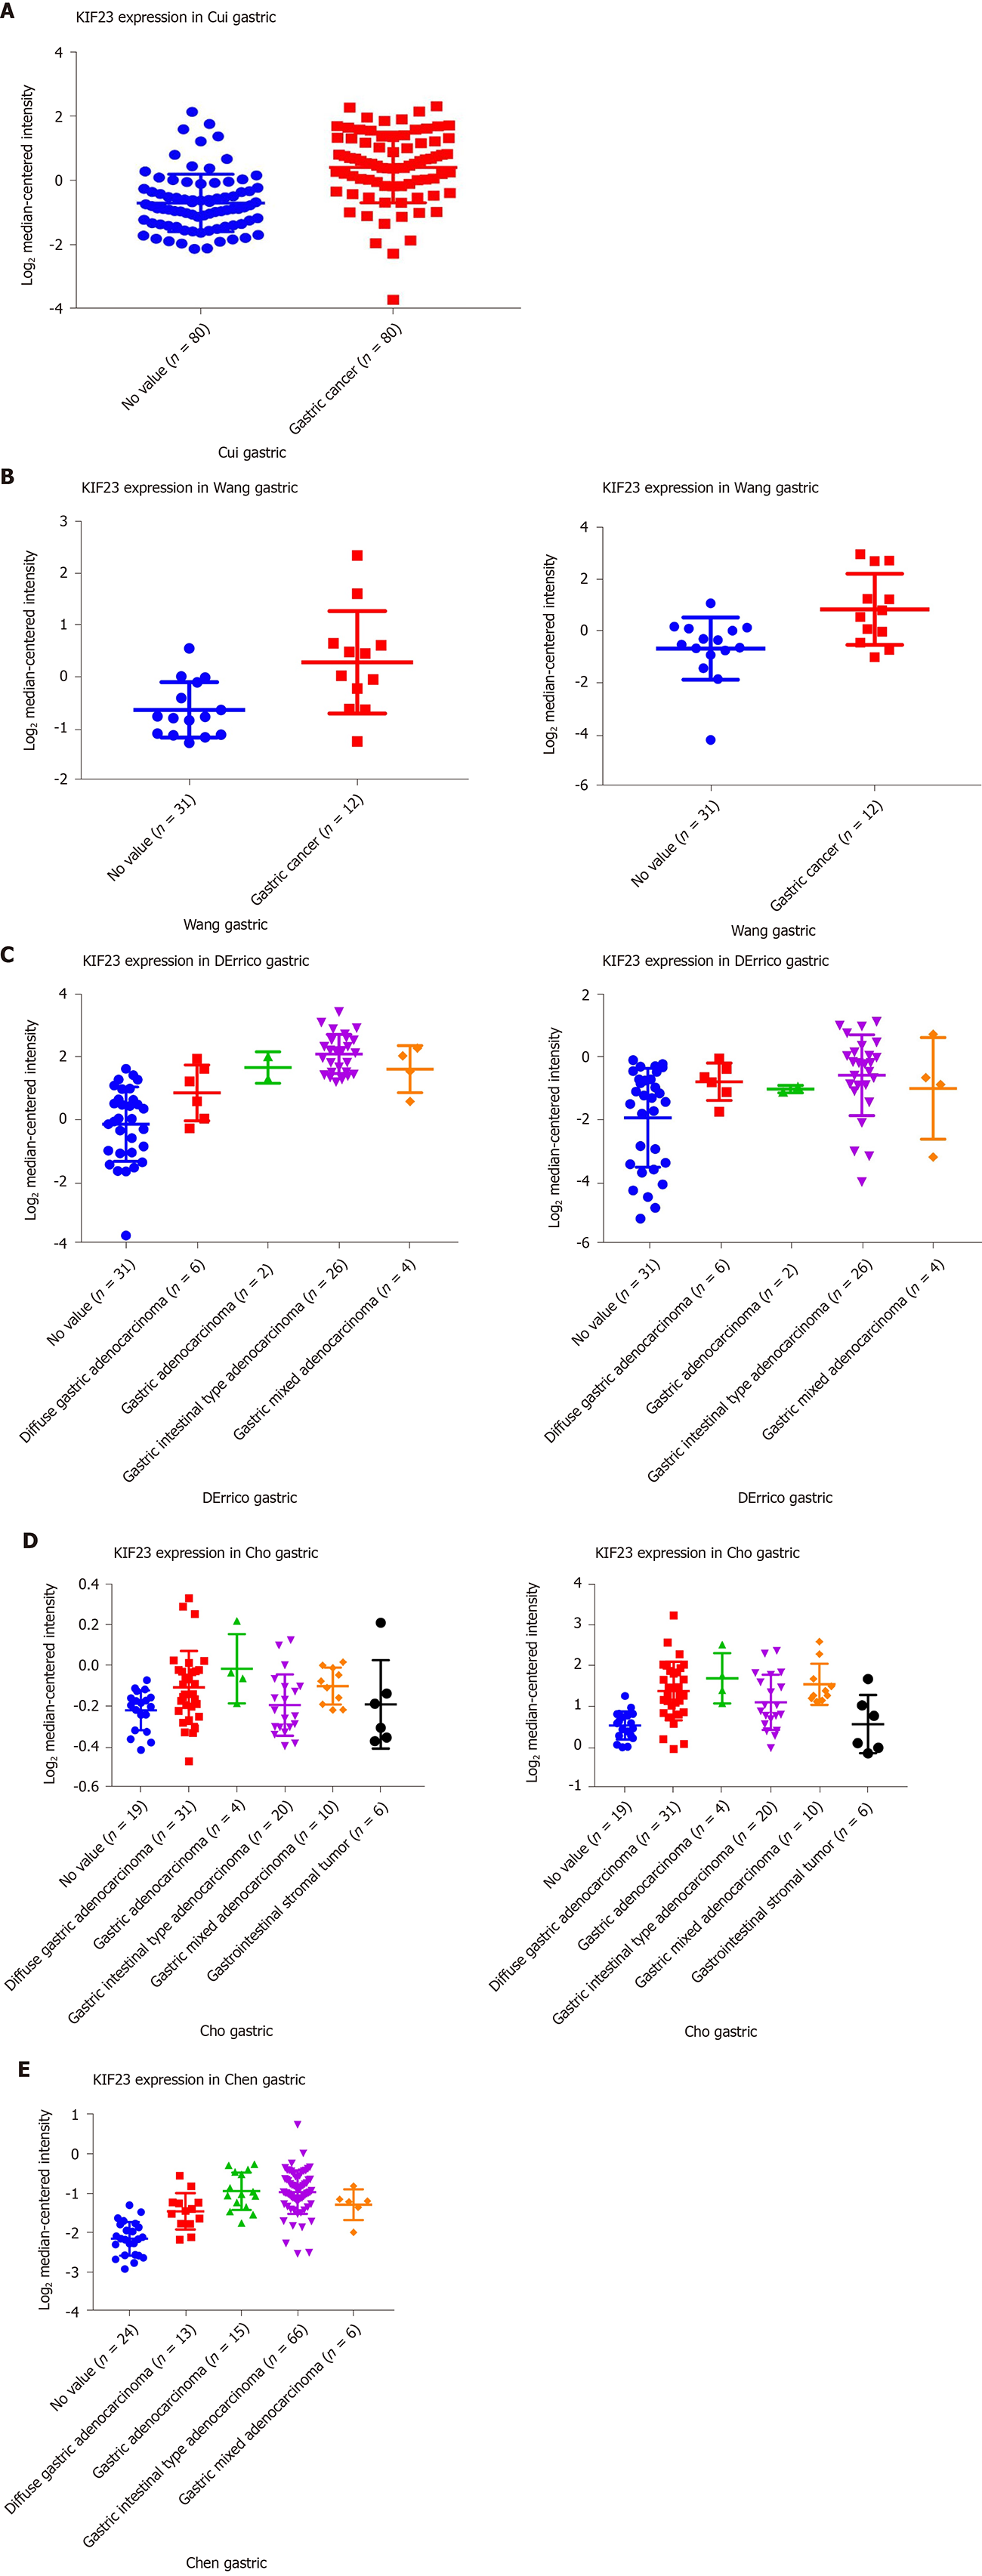
Figure 3 Expression of KIF23 in gastric cancer in Oncomine database.
A-E: The results of the five studies involved. The darker the red, the higher the expression of KIF23 in the chip.
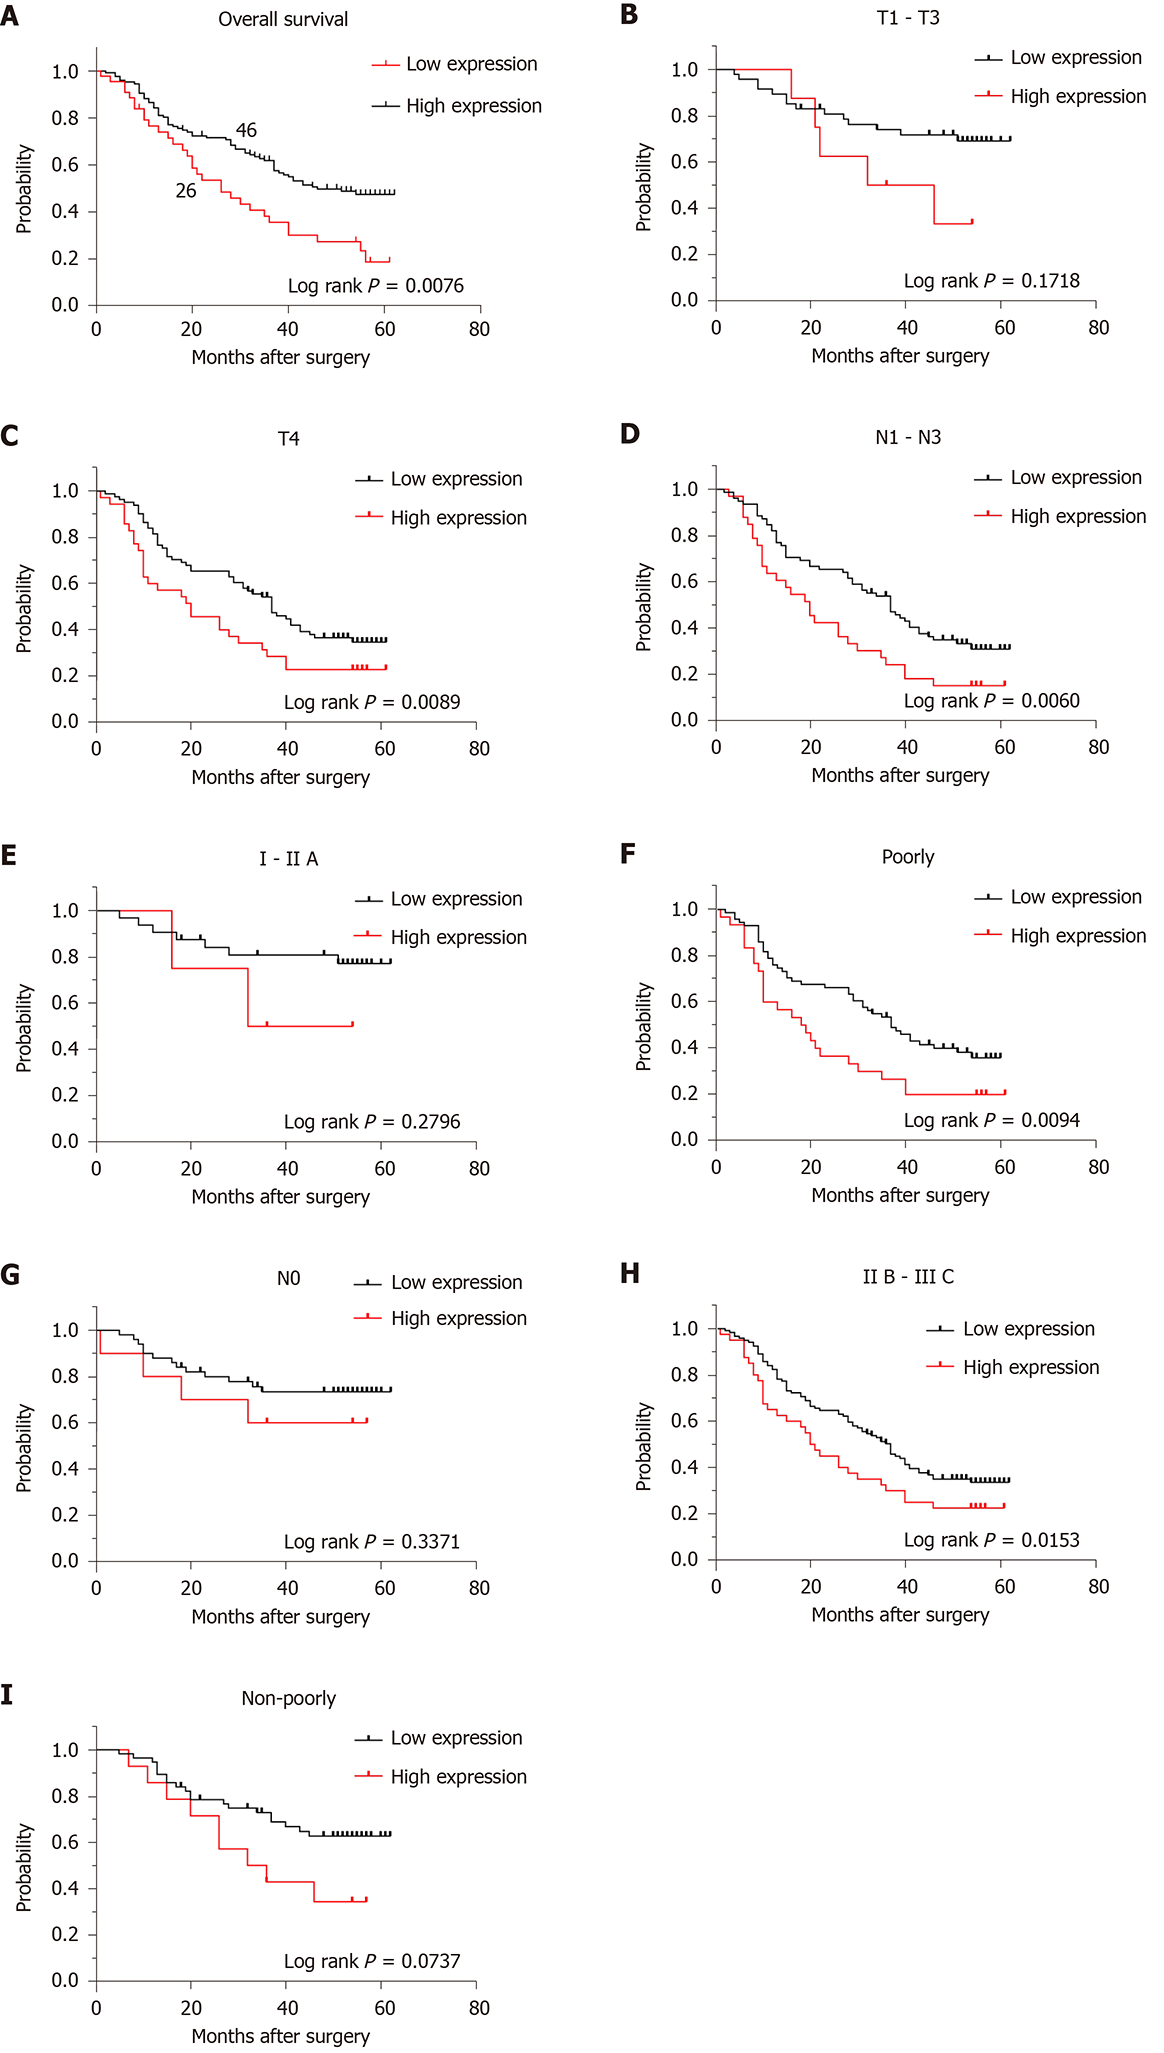
Figure 4 Prognostic effect of KIF23 expression in subgroups with different clinicopathological characteristics.
A: Kaplan–Meier analysis of the overall survival (OS) rate between the low- and high-KIF23 expression groups. Median OS in the low- and high-KIF23 expression groups was 41 and 26 mo, respectively; B–I: Kaplan–Meier analysis of OS rate between the low- and high-KIF23 expression groups in GC patients with different T, N, and tumor–node–metastasis stages, and differentiation types.
- Citation: Liang WT, Liu XF, Huang HB, Gao ZM, Li K. Prognostic significance of KIF23 expression in gastric cancer. World J Gastrointest Oncol 2020; 12(10): 1104-1118
- URL: https://www.wjgnet.com/1948-5204/full/v12/i10/1104.htm
- DOI: https://dx.doi.org/10.4251/wjgo.v12.i10.1104


