Copyright
©The Author(s) 2020.
World J Gastrointest Oncol. Jan 15, 2020; 12(1): 66-76
Published online Jan 15, 2020. doi: 10.4251/wjgo.v12.i1.66
Published online Jan 15, 2020. doi: 10.4251/wjgo.v12.i1.66
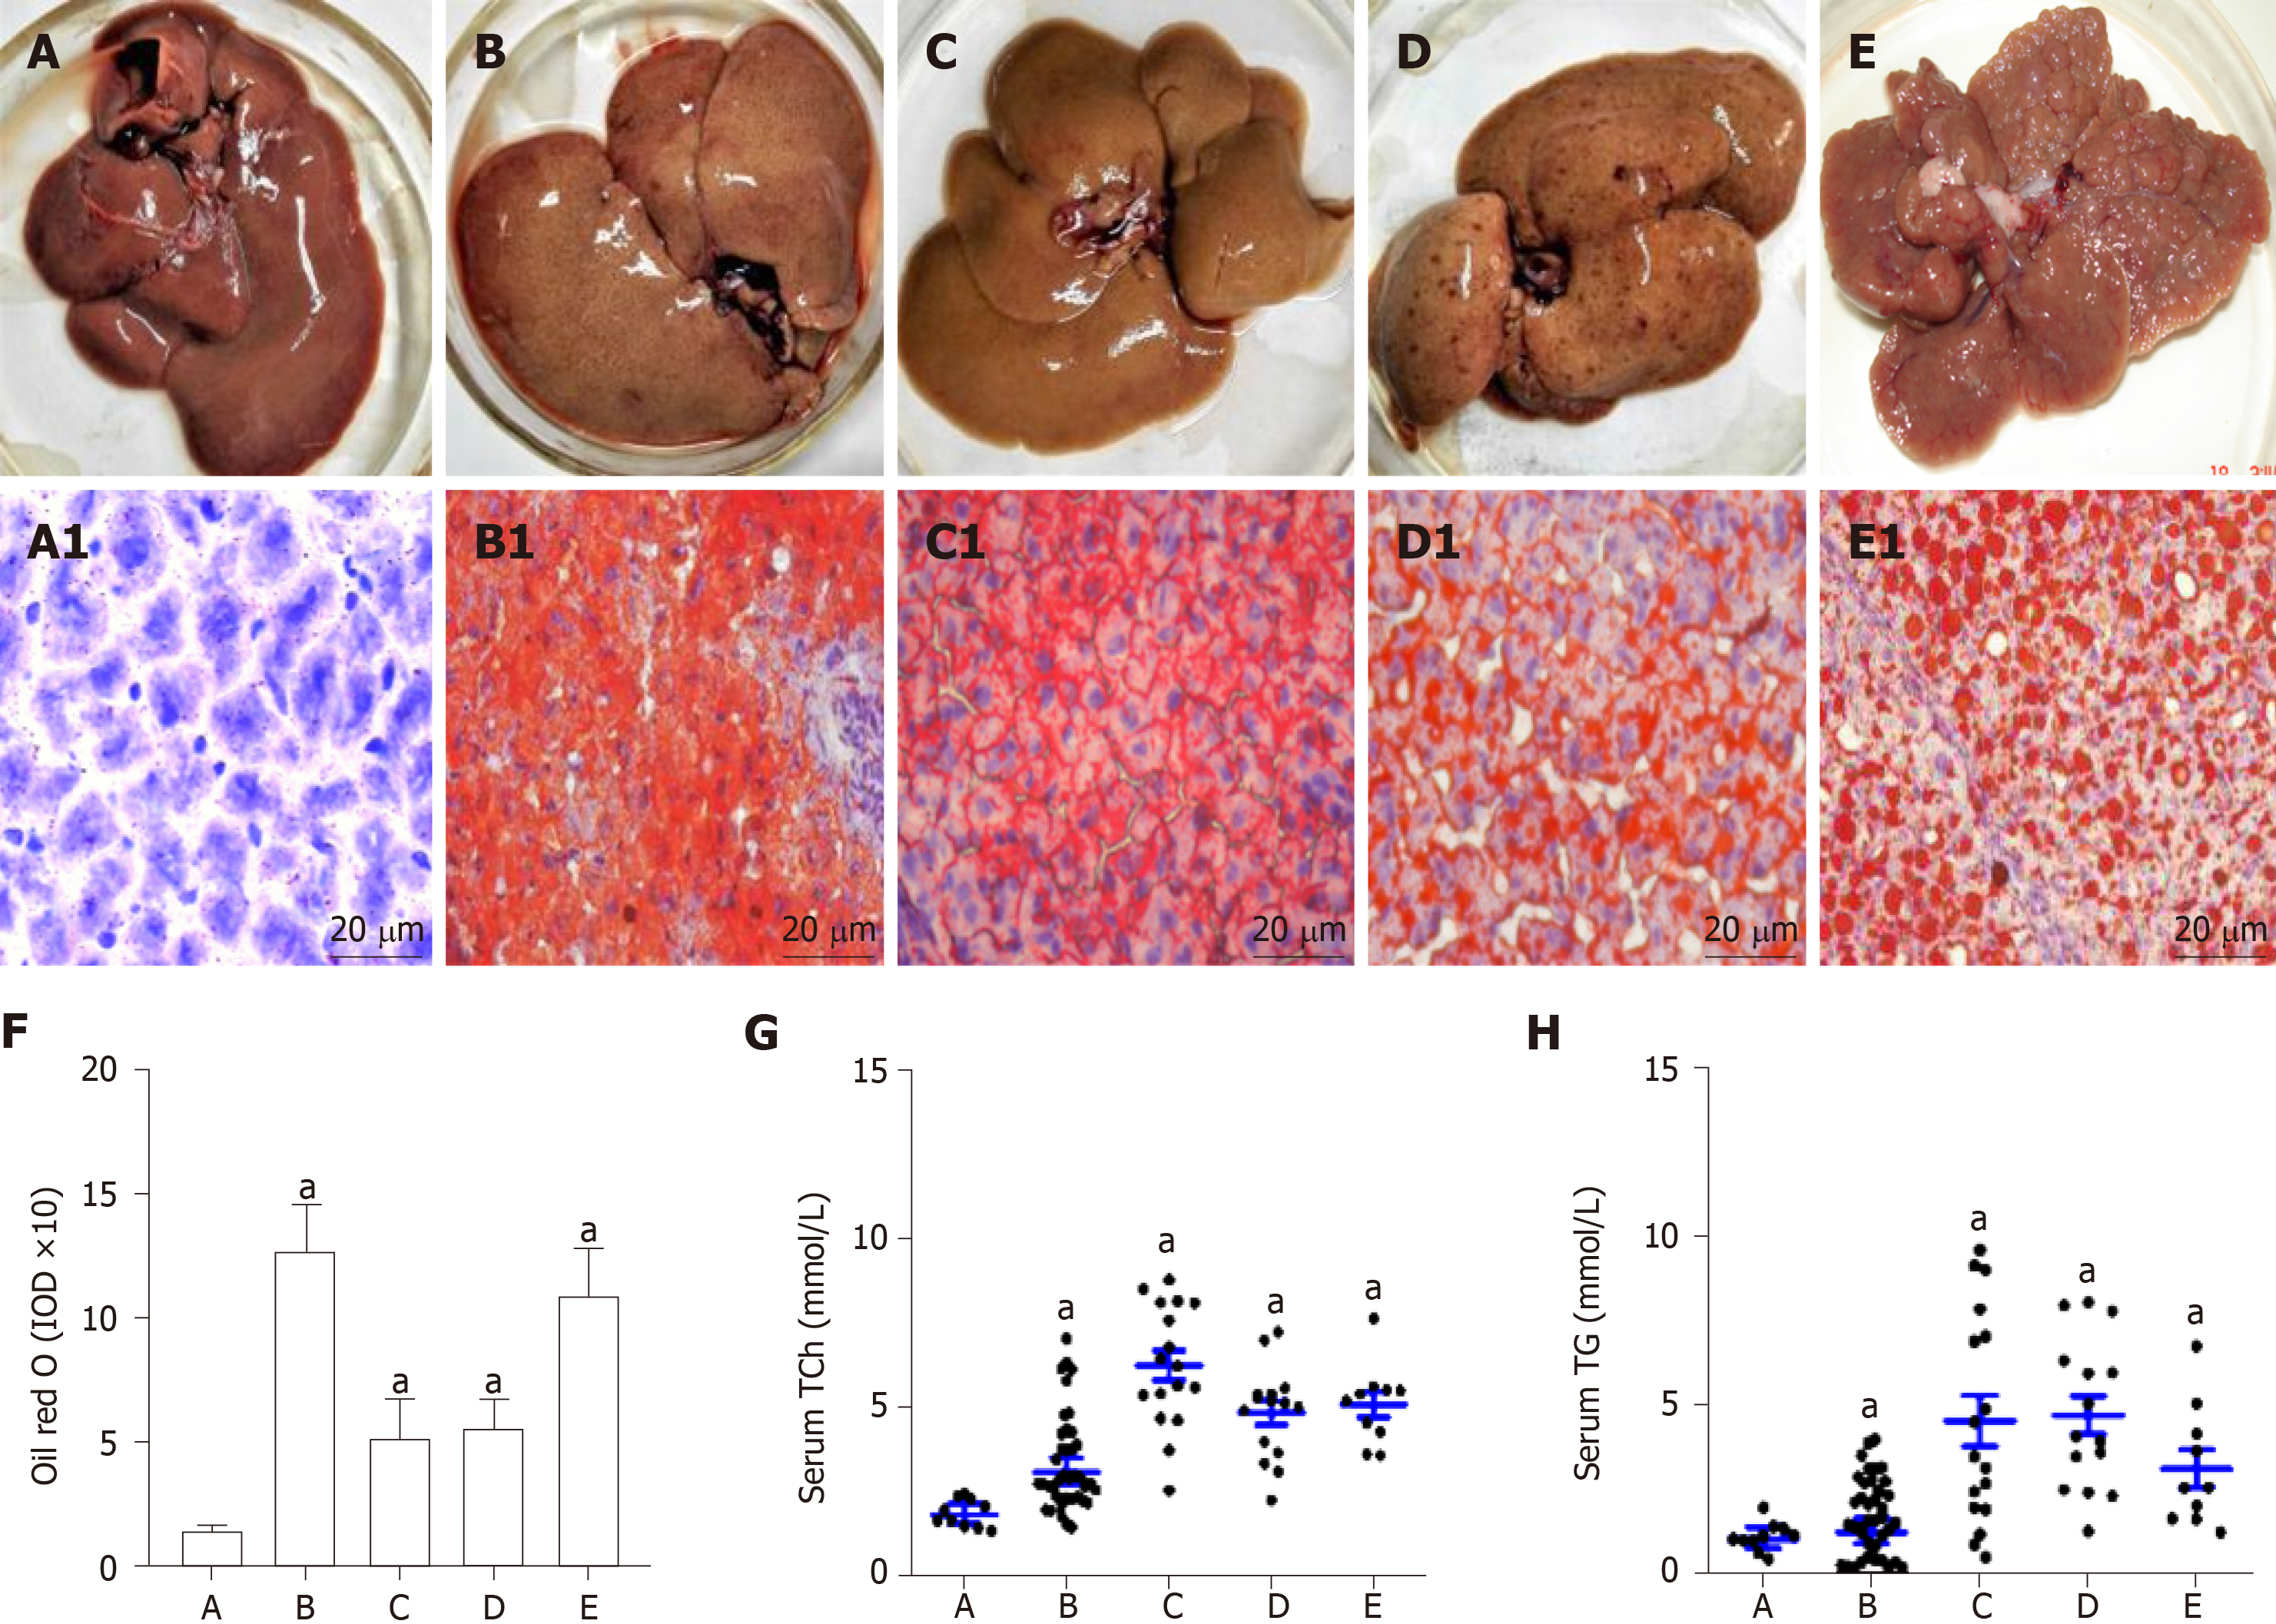
Figure 1 Rat livers with lipid accumulation and circulating lipid levels.
A: The livers of control rats with normal diet; B: The livers of the rats with high fat diet; C: The livers of the rats with high fat plus 2-fluorenylacetamide (2-FAA) diet at the early stage; D: The livers of the rats with high fat plus 2-FAA diet at the middle early stage; and E: The livers of the rats with high fat plus 2-FAA diet at the last stage; A1: Normal controls; B1-E1: The sections of the corresponding to above livers were stained with the Oil red O assay, and over lipid accumulation in rat hepatocytes; F: The integral optic density values represented hepatic lipid levels of the corresponding to above livers; G: The alterations of serum total cholesterol level; and H: The alterations of serum triglycerides level. Original magnification of liver sections (× 400) from Figure 1A1 to Figure 1E1. aP < 0.05 vs control group. IOD: Integral optic density; Tch: Total cholesterol; TG: Triglycerides.
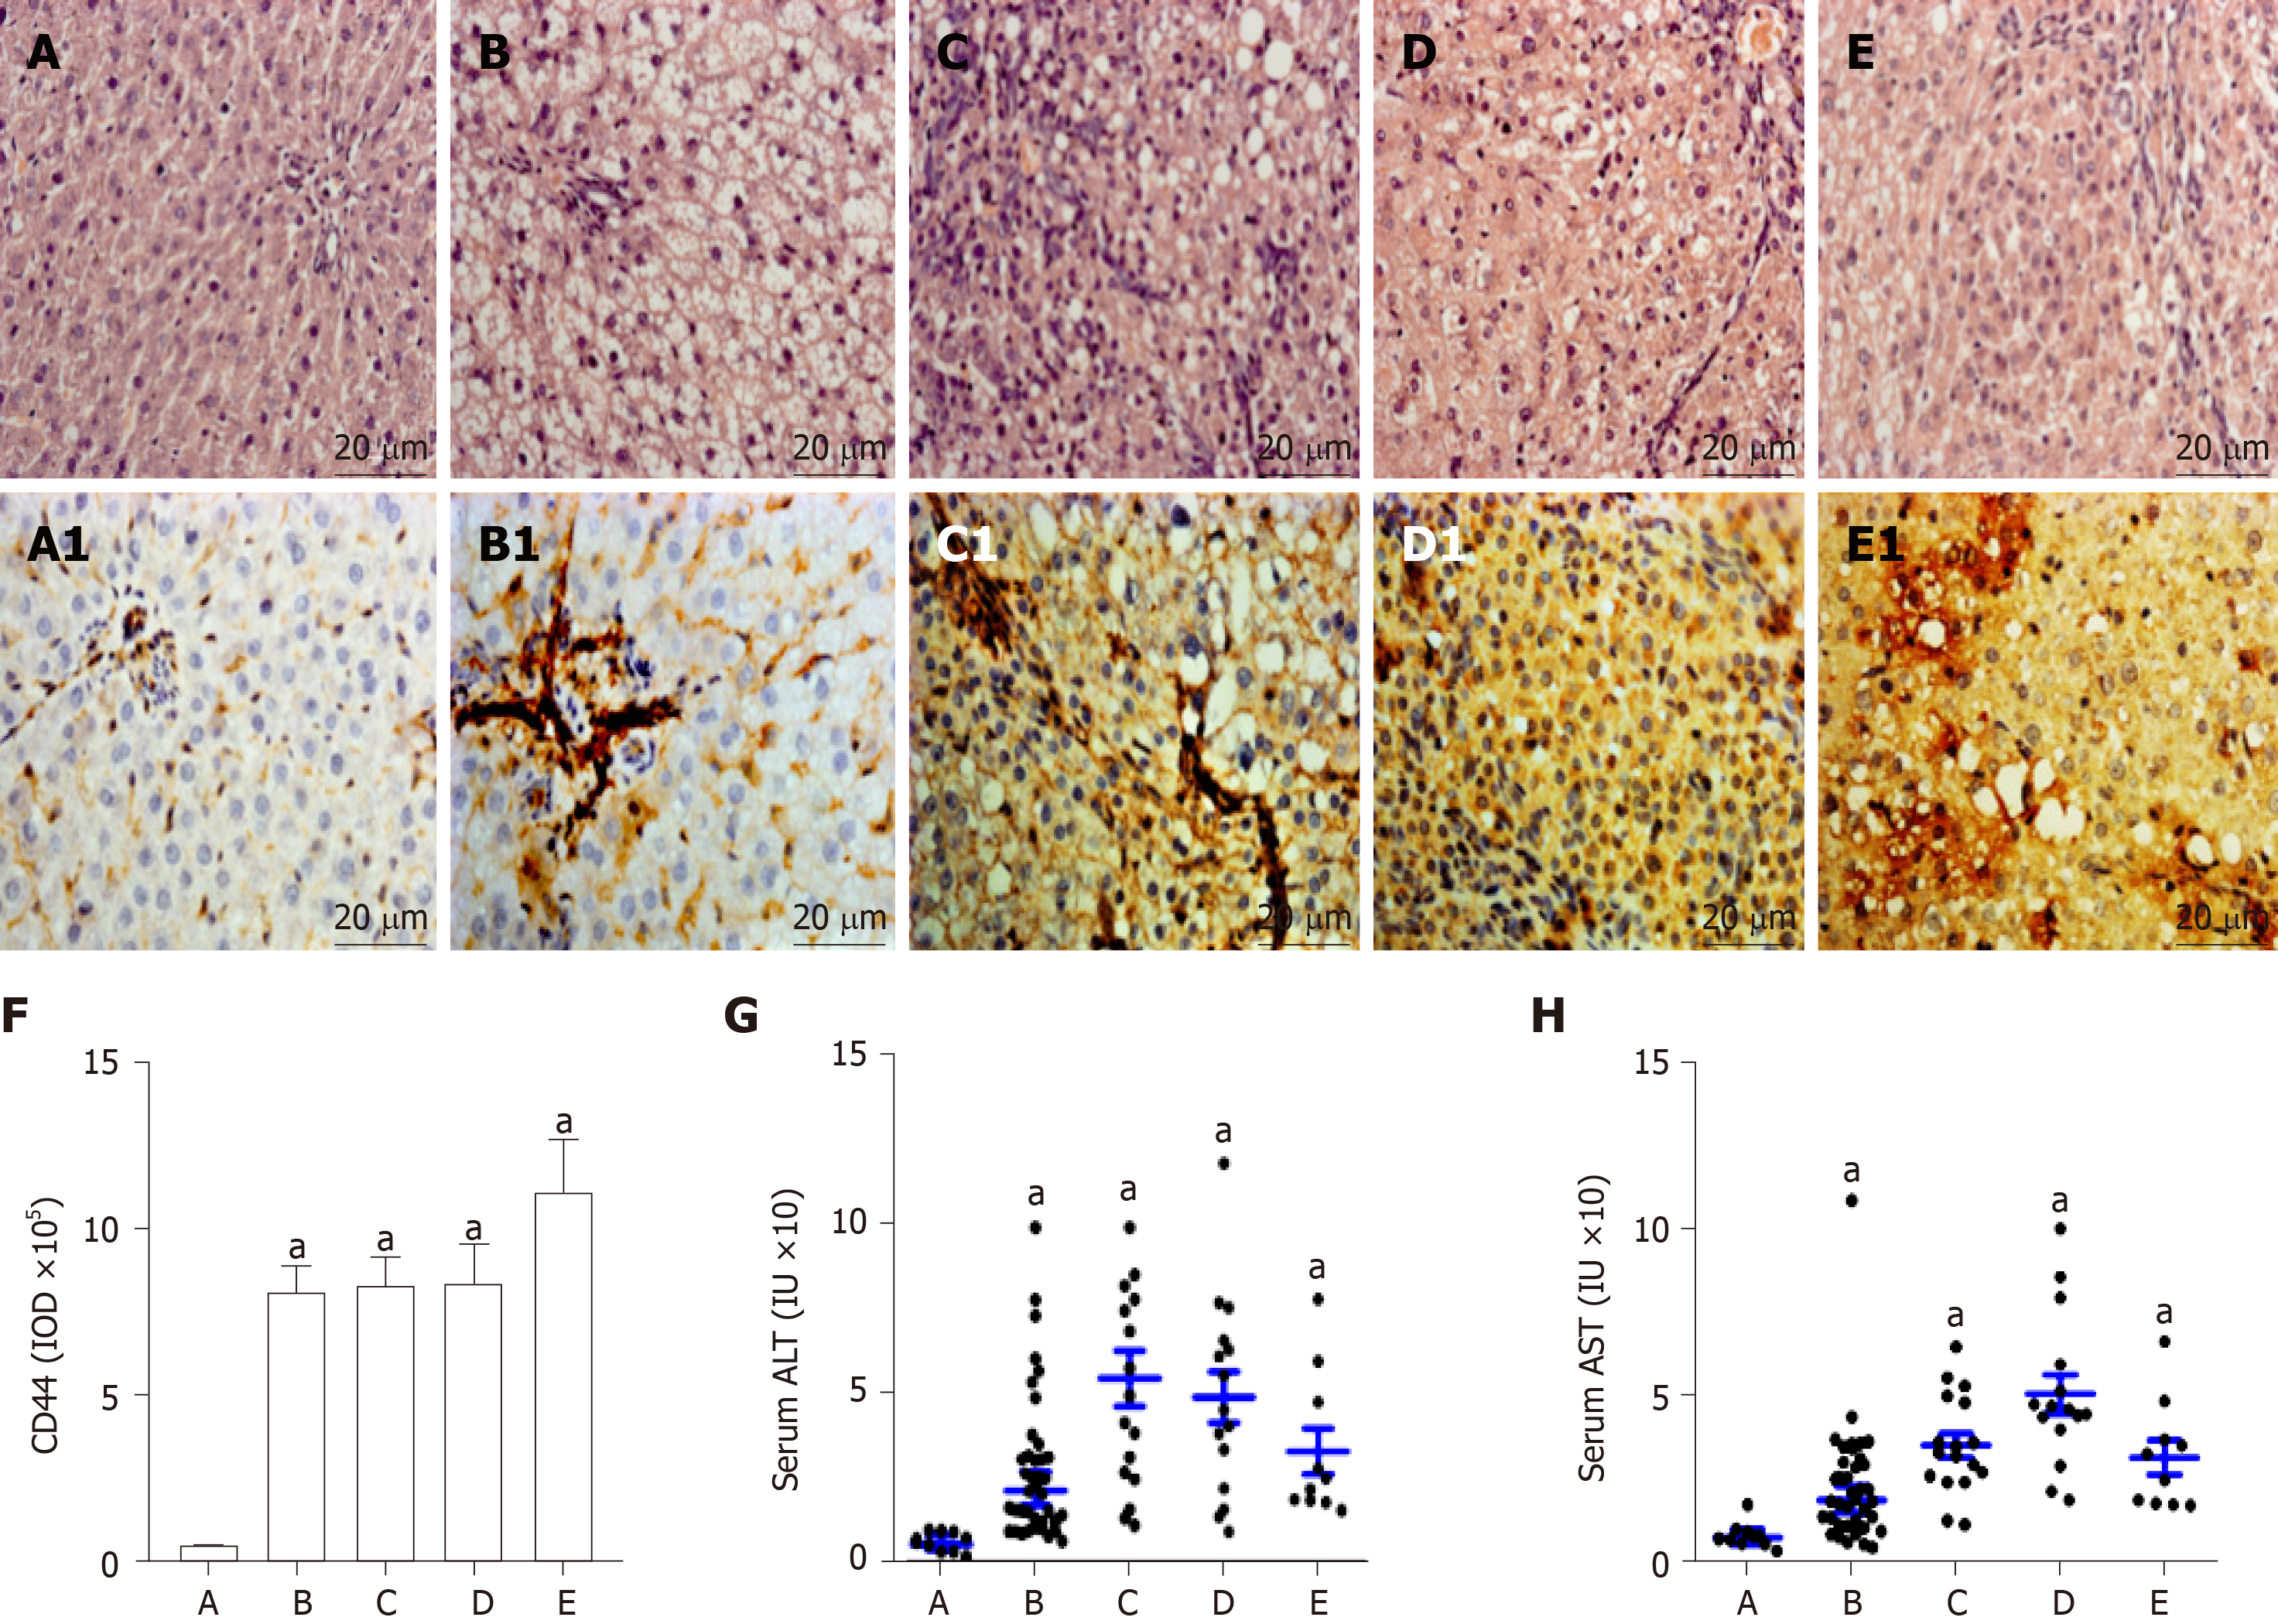
Figure 2 Pathohistology and hepatic CD44 in rat hepatocarcinogenesis.
According to pathohistological examination with H and E staining, the rat livers were divided into five groups. A: The normal controls (A1); B: The nonalcoholic fatty liver disease formation (B1); C: The hepatocytes damage (denaturation, C1); D: The precancerosis (D1); and E: The HCC formation (E1); A1: Normal controls; B1-E1: The sections of the corresponding to above livers were analyzed by CD44 immunohistochemistry with anti-rat CD44 antibody, and the overexpression of CD44 in rat hepatocytes; F: The IOD values represented hepatic CD44 expression levels; G: The alterations of serum alanine aminotransferase (ALT) activity; and H: The alterations of serum AST activity. Original magnification of liver sections (× 400) from Figure 2A1 to Figure 2E1. aP < 0.05 vs control group. IOD: Integral optic density.
- Citation: Fang M, Yao M, Yang J, Zheng WJ, Wang L, Yao DF. Abnormal CD44 activation of hepatocytes with nonalcoholic fatty accumulation in rat hepatocarcinogenesis. World J Gastrointest Oncol 2020; 12(1): 66-76
- URL: https://www.wjgnet.com/1948-5204/full/v12/i1/66.htm
- DOI: https://dx.doi.org/10.4251/wjgo.v12.i1.66


