Copyright
©The Author(s) 2019.
World J Gastrointest Oncol. May 15, 2019; 11(5): 377-392
Published online May 15, 2019. doi: 10.4251/wjgo.v11.i5.377
Published online May 15, 2019. doi: 10.4251/wjgo.v11.i5.377
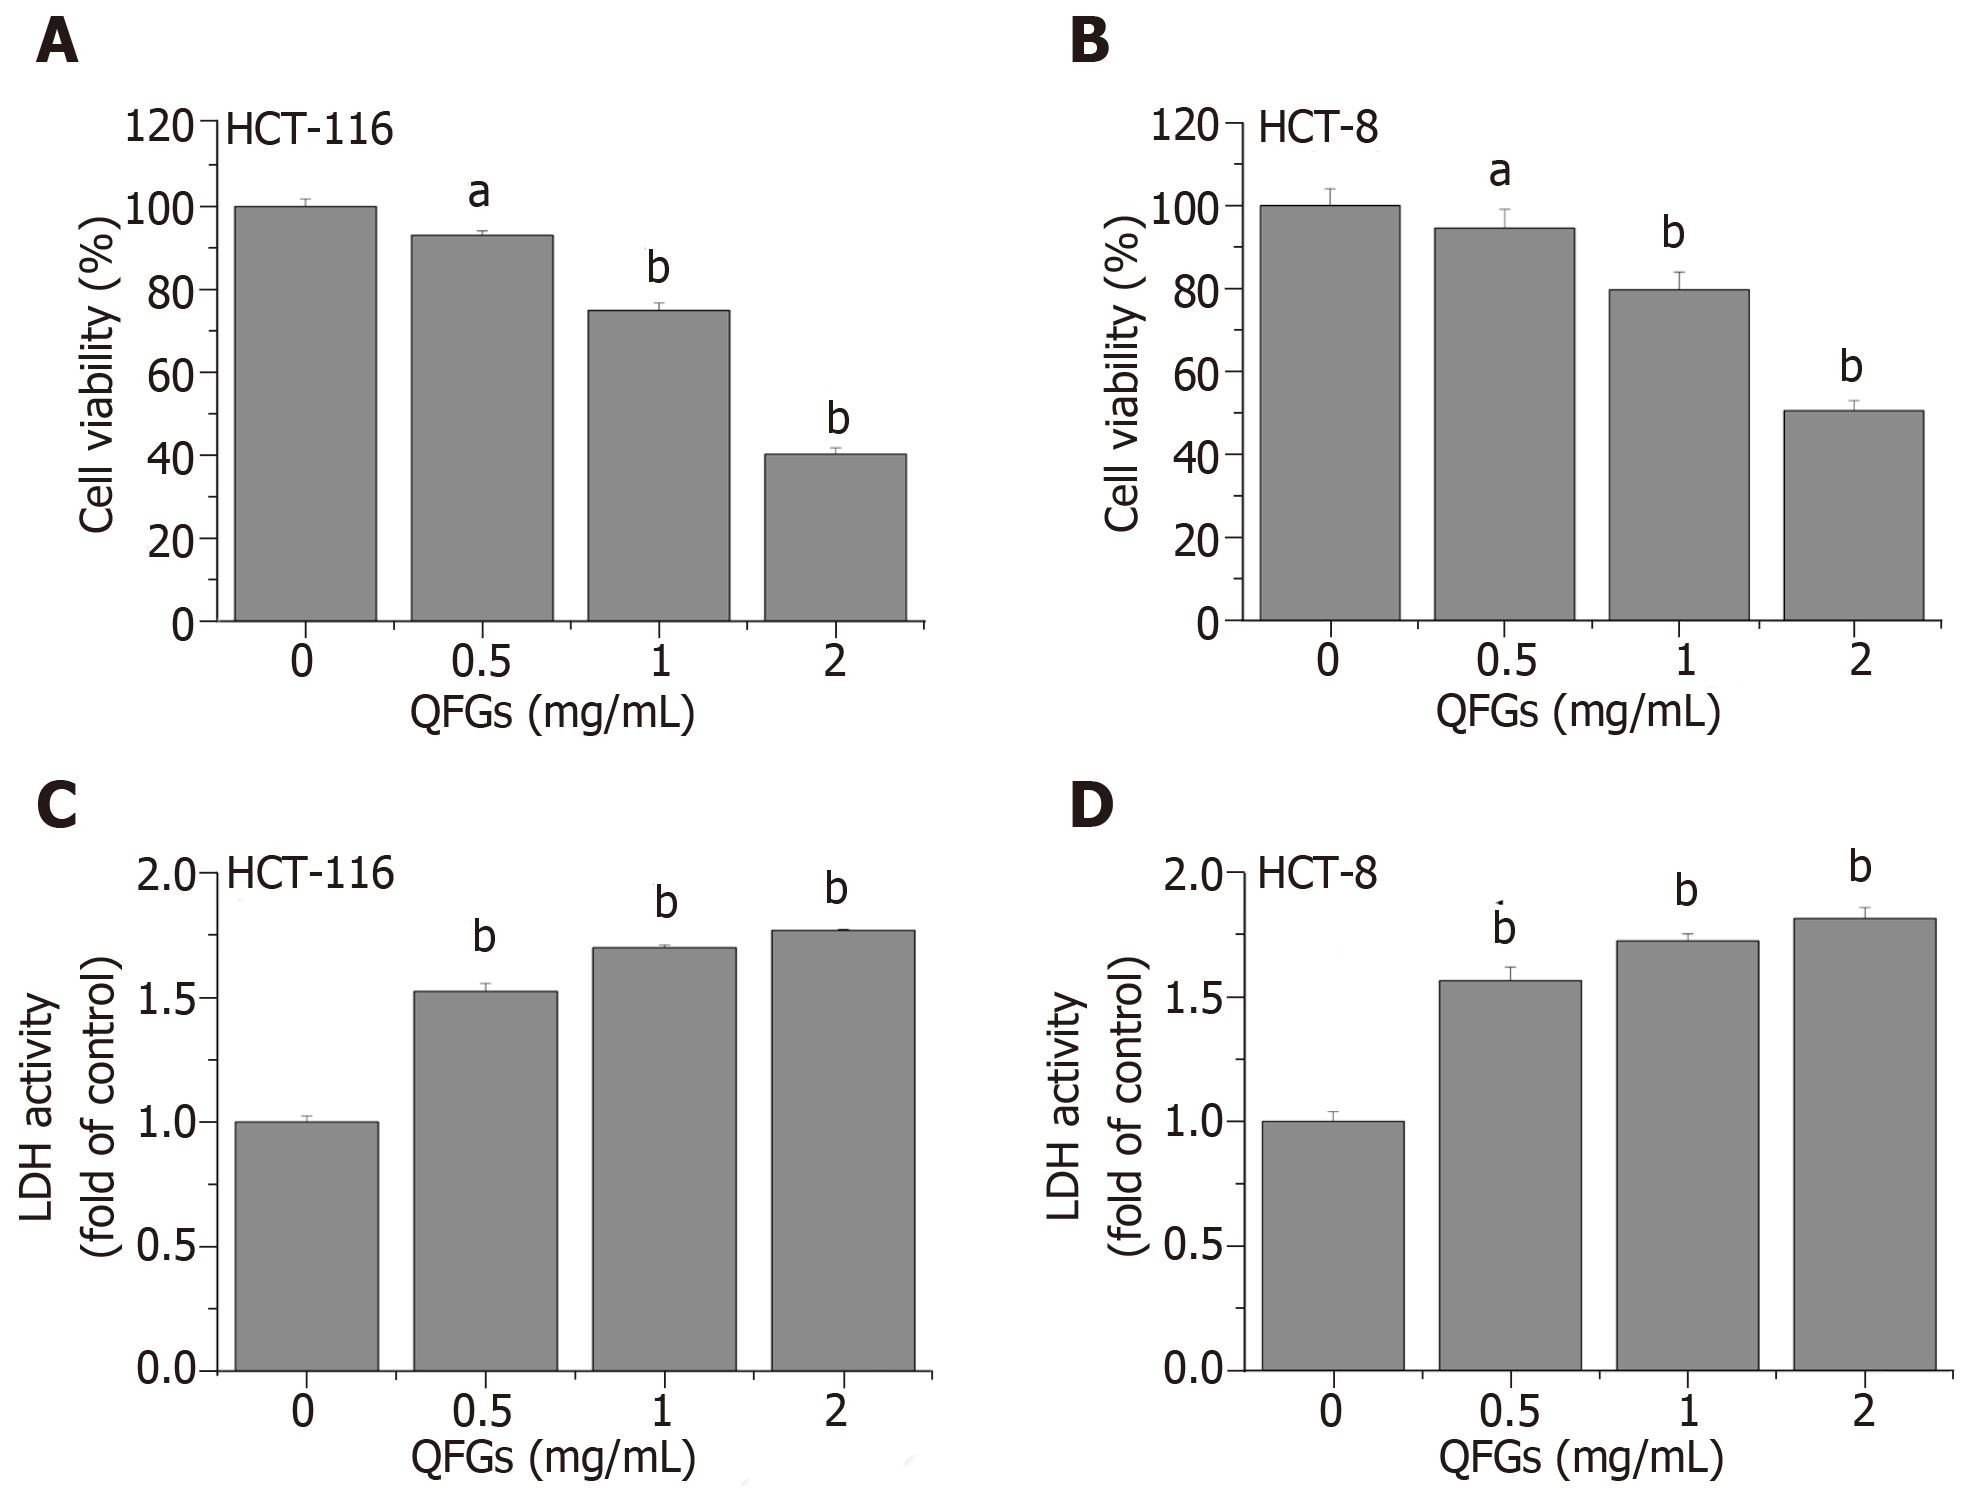
Figure 1 Effect of QFGs on the viability and cytotoxicity of HCT-116 and HCT-8 cells.
A, B: Cell viability was measured by MTT assay; C, D: Cytotoxicity was measured by LDH assay. aP < 0.05, bP < 0.01 vs the control group. QFGs: Qingjie Fuzheng granules; LDH: Lactate dehydrogenase.
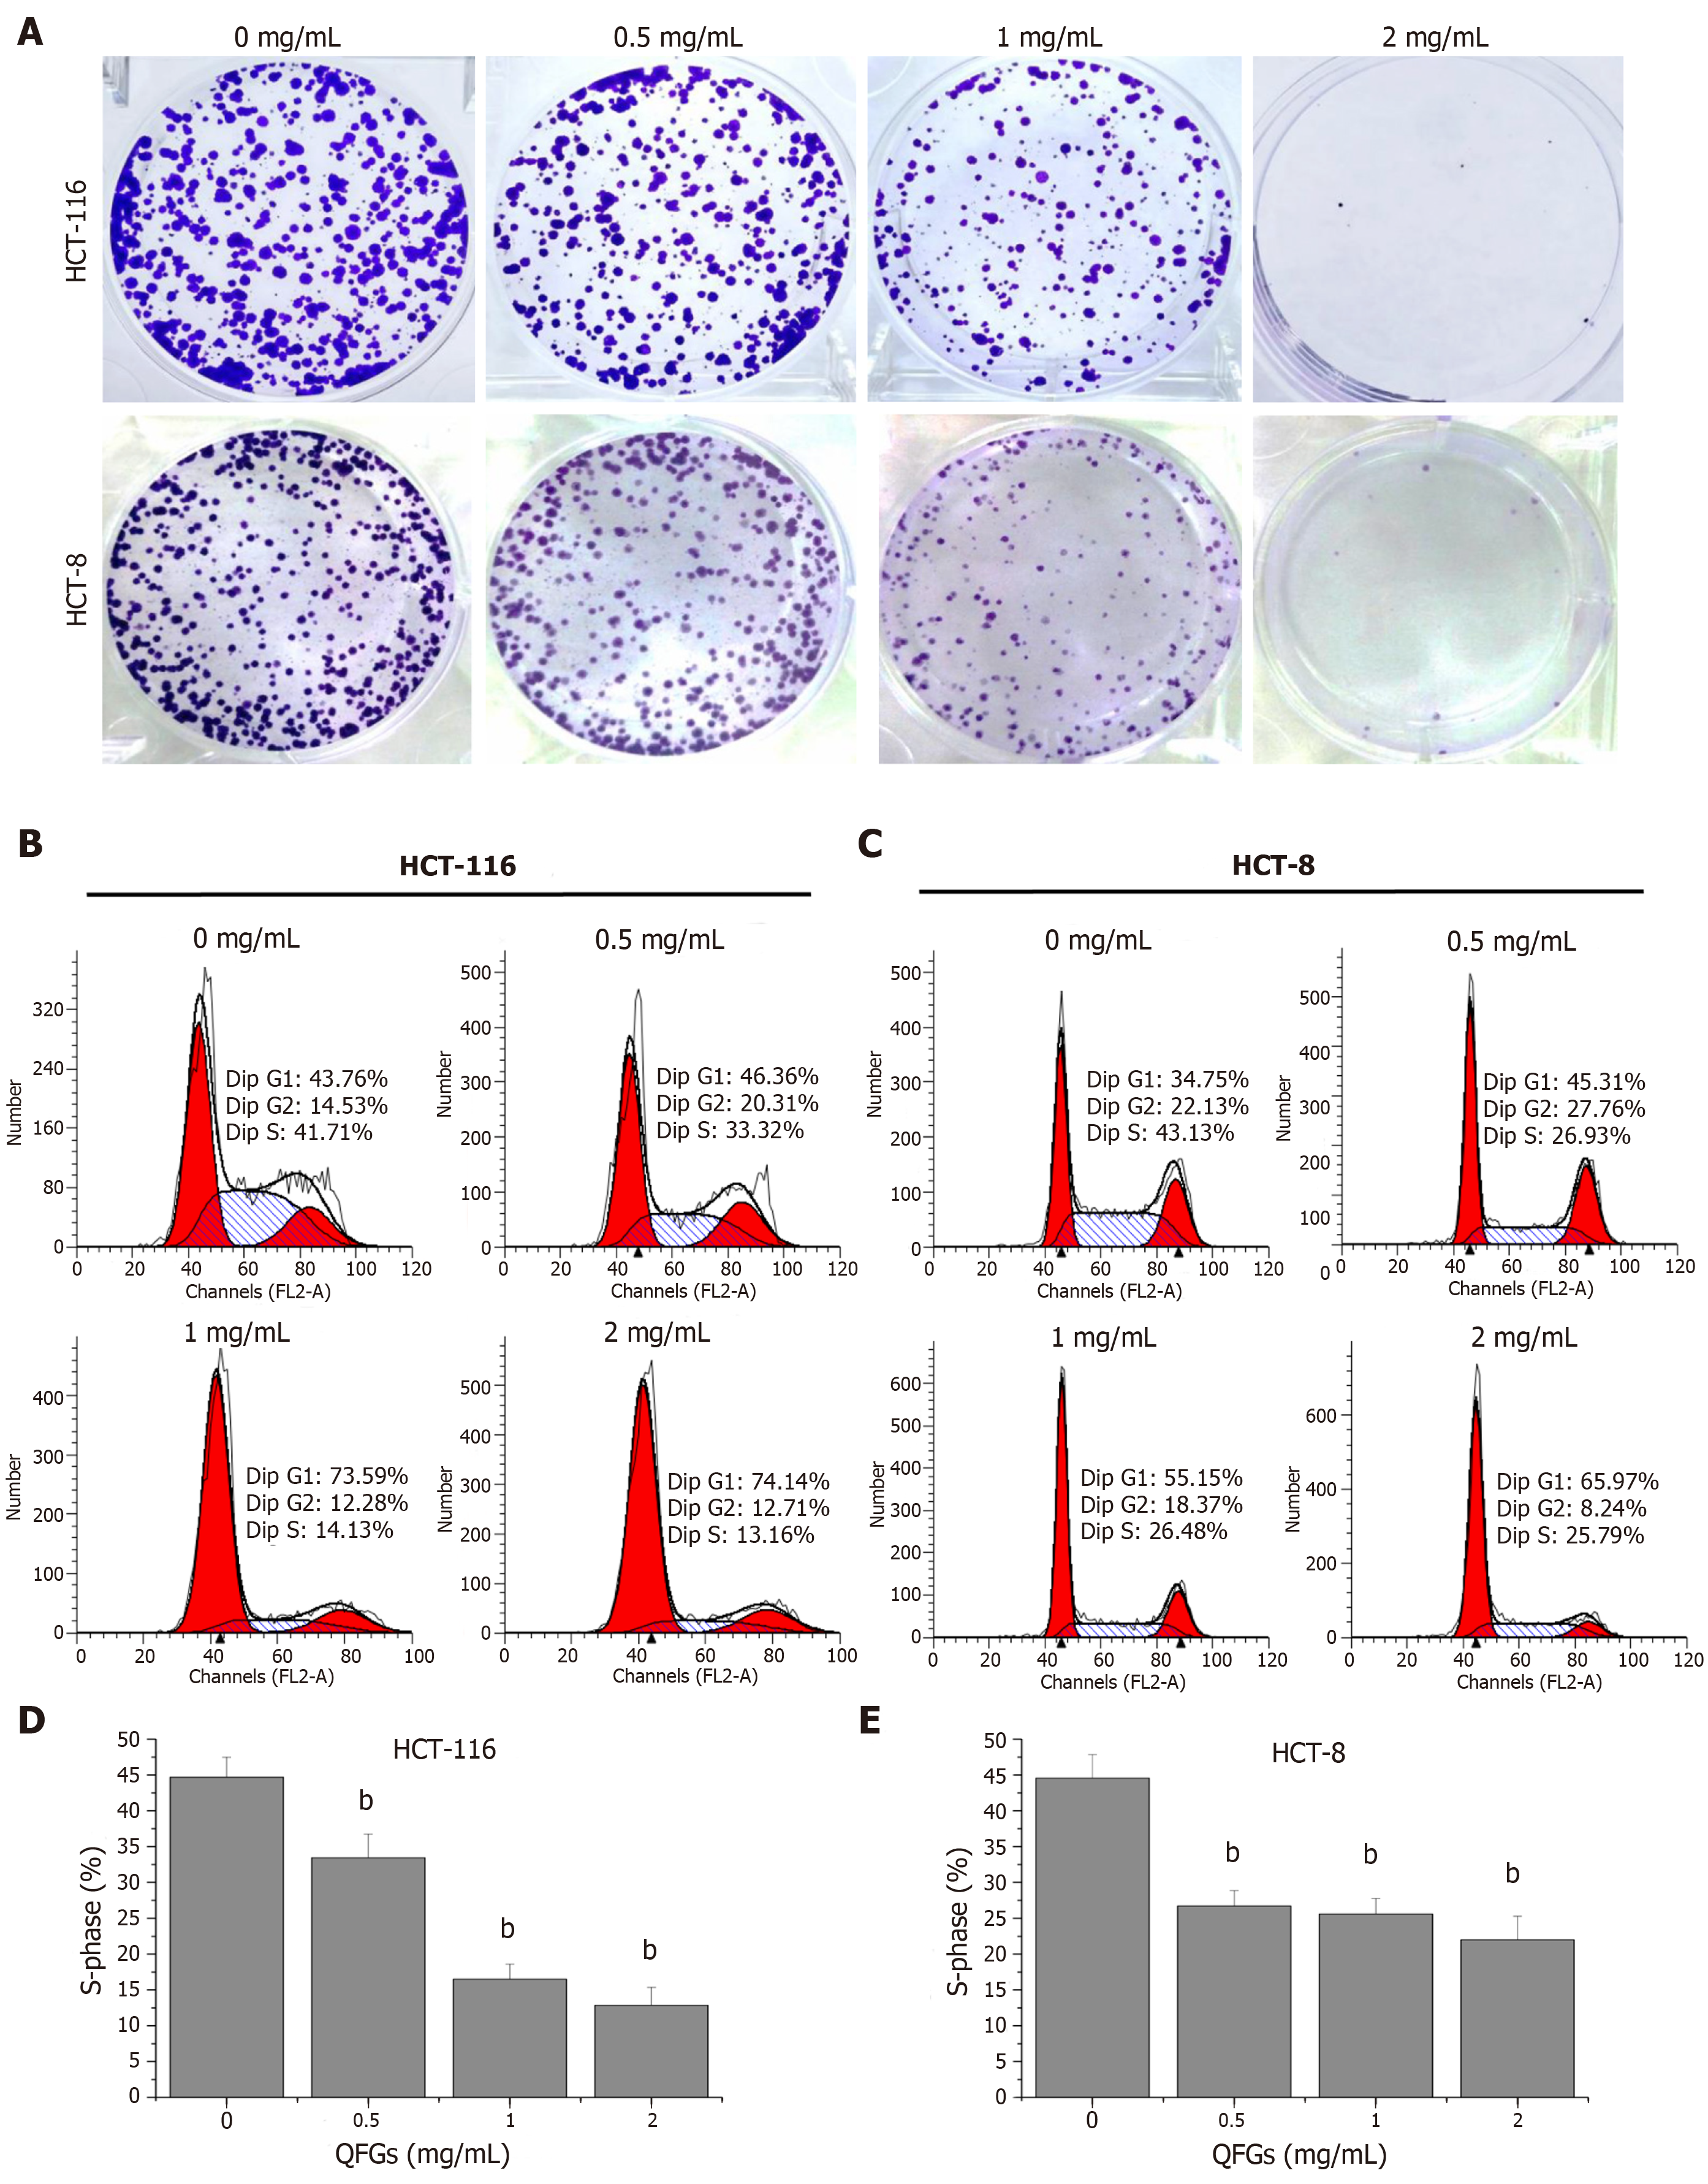
Figure 2 Effect of QFGs on the proliferation of HCT-116 and HCT-8 cells.
A: Cell growth ability was measured by colony formation assays; B, C: Cell proliferation was detected by cell cycle assays with flow cytometry analysis; D, E: Quantification of FACS analysis. bP < 0.01 vs the control group. QFGs: Qingjie Fuzheng granules; FACS: Fluorescence activated cell sorting.
Figure 3 Effect of QFGs on HCT-116 and HCT-8 cells apoptosis.
A: Cell apoptosis was detected by Hoechst 33258 staining and visualized under a fluorescent microscope (200 ×); B: Cell apoptosis was detected by Annexin V-FITC/PI staining with flow cytometry analysis, and the analysis results were quantified; C, D: The expression of cleaved caspase-3, caspase-8 and caspase-9 were determined by western blot. β-actin was used as an internal control. Each band is representative of triplicate experiments. The band densities of western blots were quantitatively analyzed; E, F: The activities of caspase-3, caspase-8 and caspase-9 were determined by using a caspase activity assay kit. bP < 0.01 vs the control group. QFGs: Qingjie Fuzheng granules; PI: Propidium iodide; FITC: Fluorescein isothiocyanate.
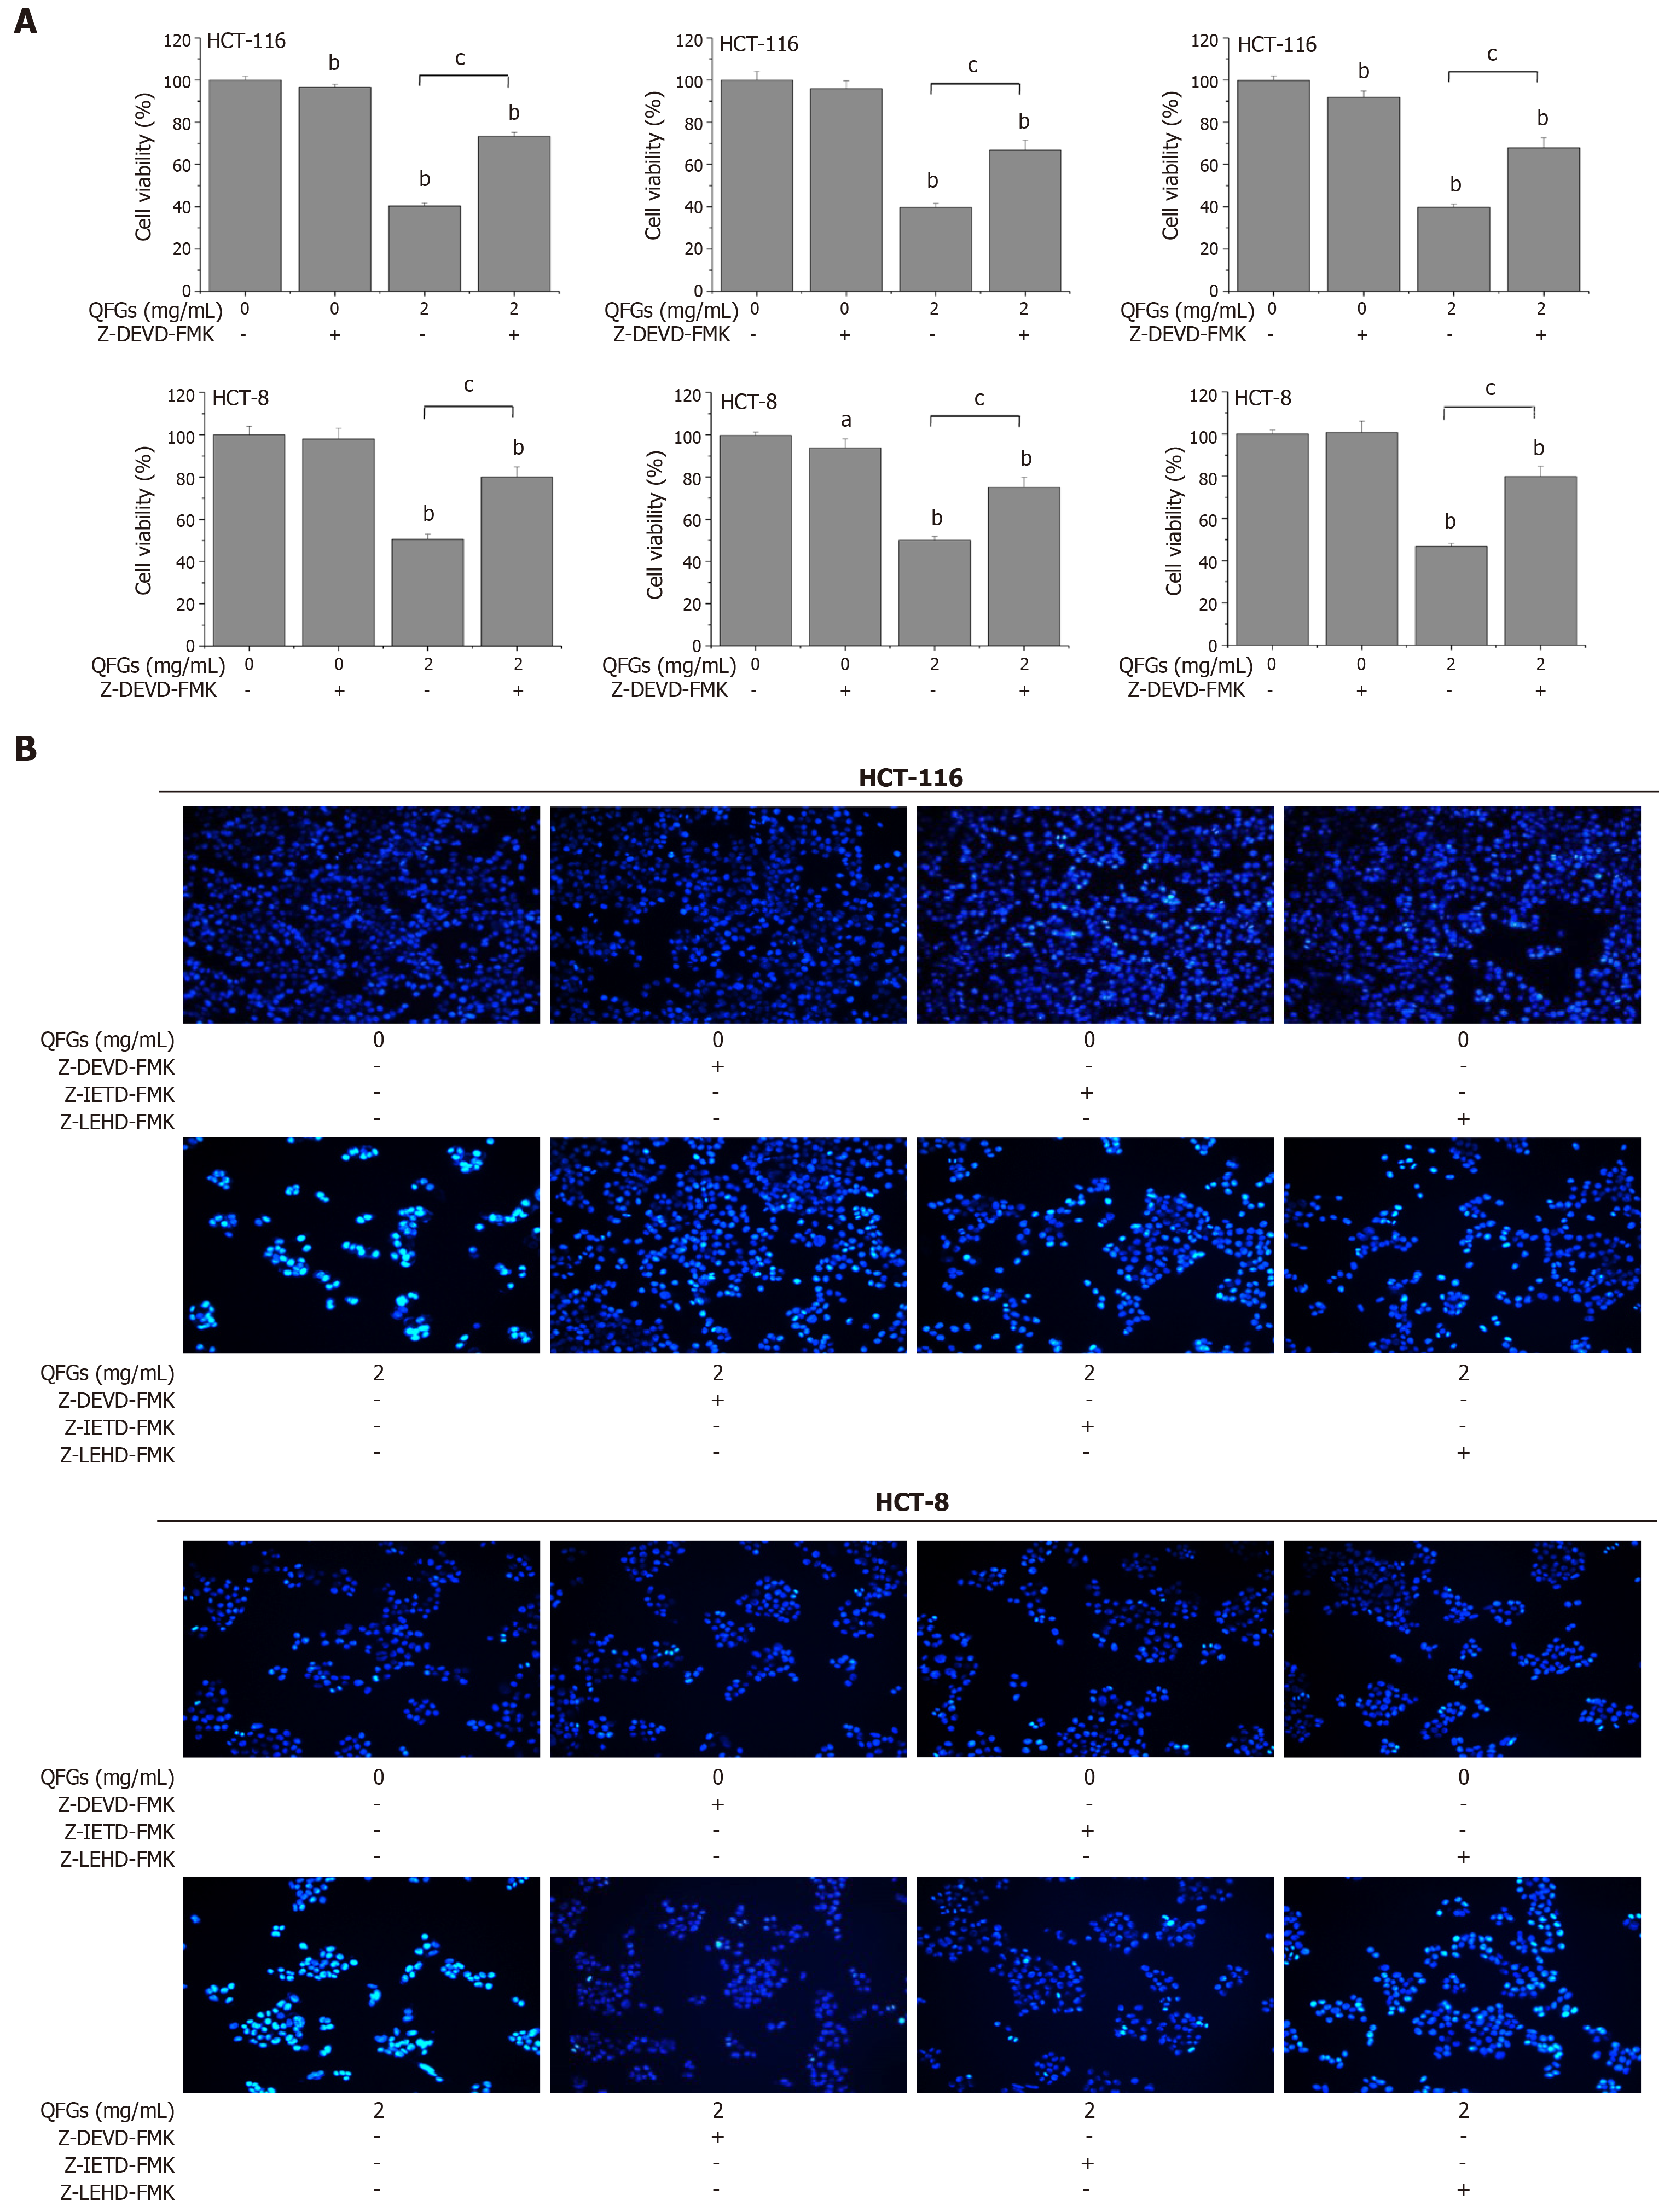
Figure 4 Effect of QFGs on the mitochondria-dependent and death receptor pathways in HCT-116 and HCT-8 cells.
A: The cells were treated with or without QFGs (2 mg/mL) in combination with different caspase inhibitors (Z-DEVD-FMK, Z-IETD-FMK, Z-LEHD-FMK) for 24 h, and then cell viability was measured by MTT assay for each combination. aP < 0.05, bP < 0.01 vs the control group, cP < 0.01 vs the inhibitor group; B: Cells were treated with or without QFGs (2 mg/mL) in combination with different caspase inhibitors (Z-DEVD-FMK, Z-IETD-FMK, Z-LEHD-FMK) for 24 h, and then apoptosis in the HCT-116 and HCT-8 cells was detected by Hoechst 33258 staining and visualized under a fluorescent microscope (200 ×). QFGs: Qingjie Fuzheng granules; Z-DEVD-FMK: Inhibitor of caspase-3; Z-IETD-FMK: Inhibitor of caspase-8; Z-LEHD-FMK: Inhibitor of caspase-9.
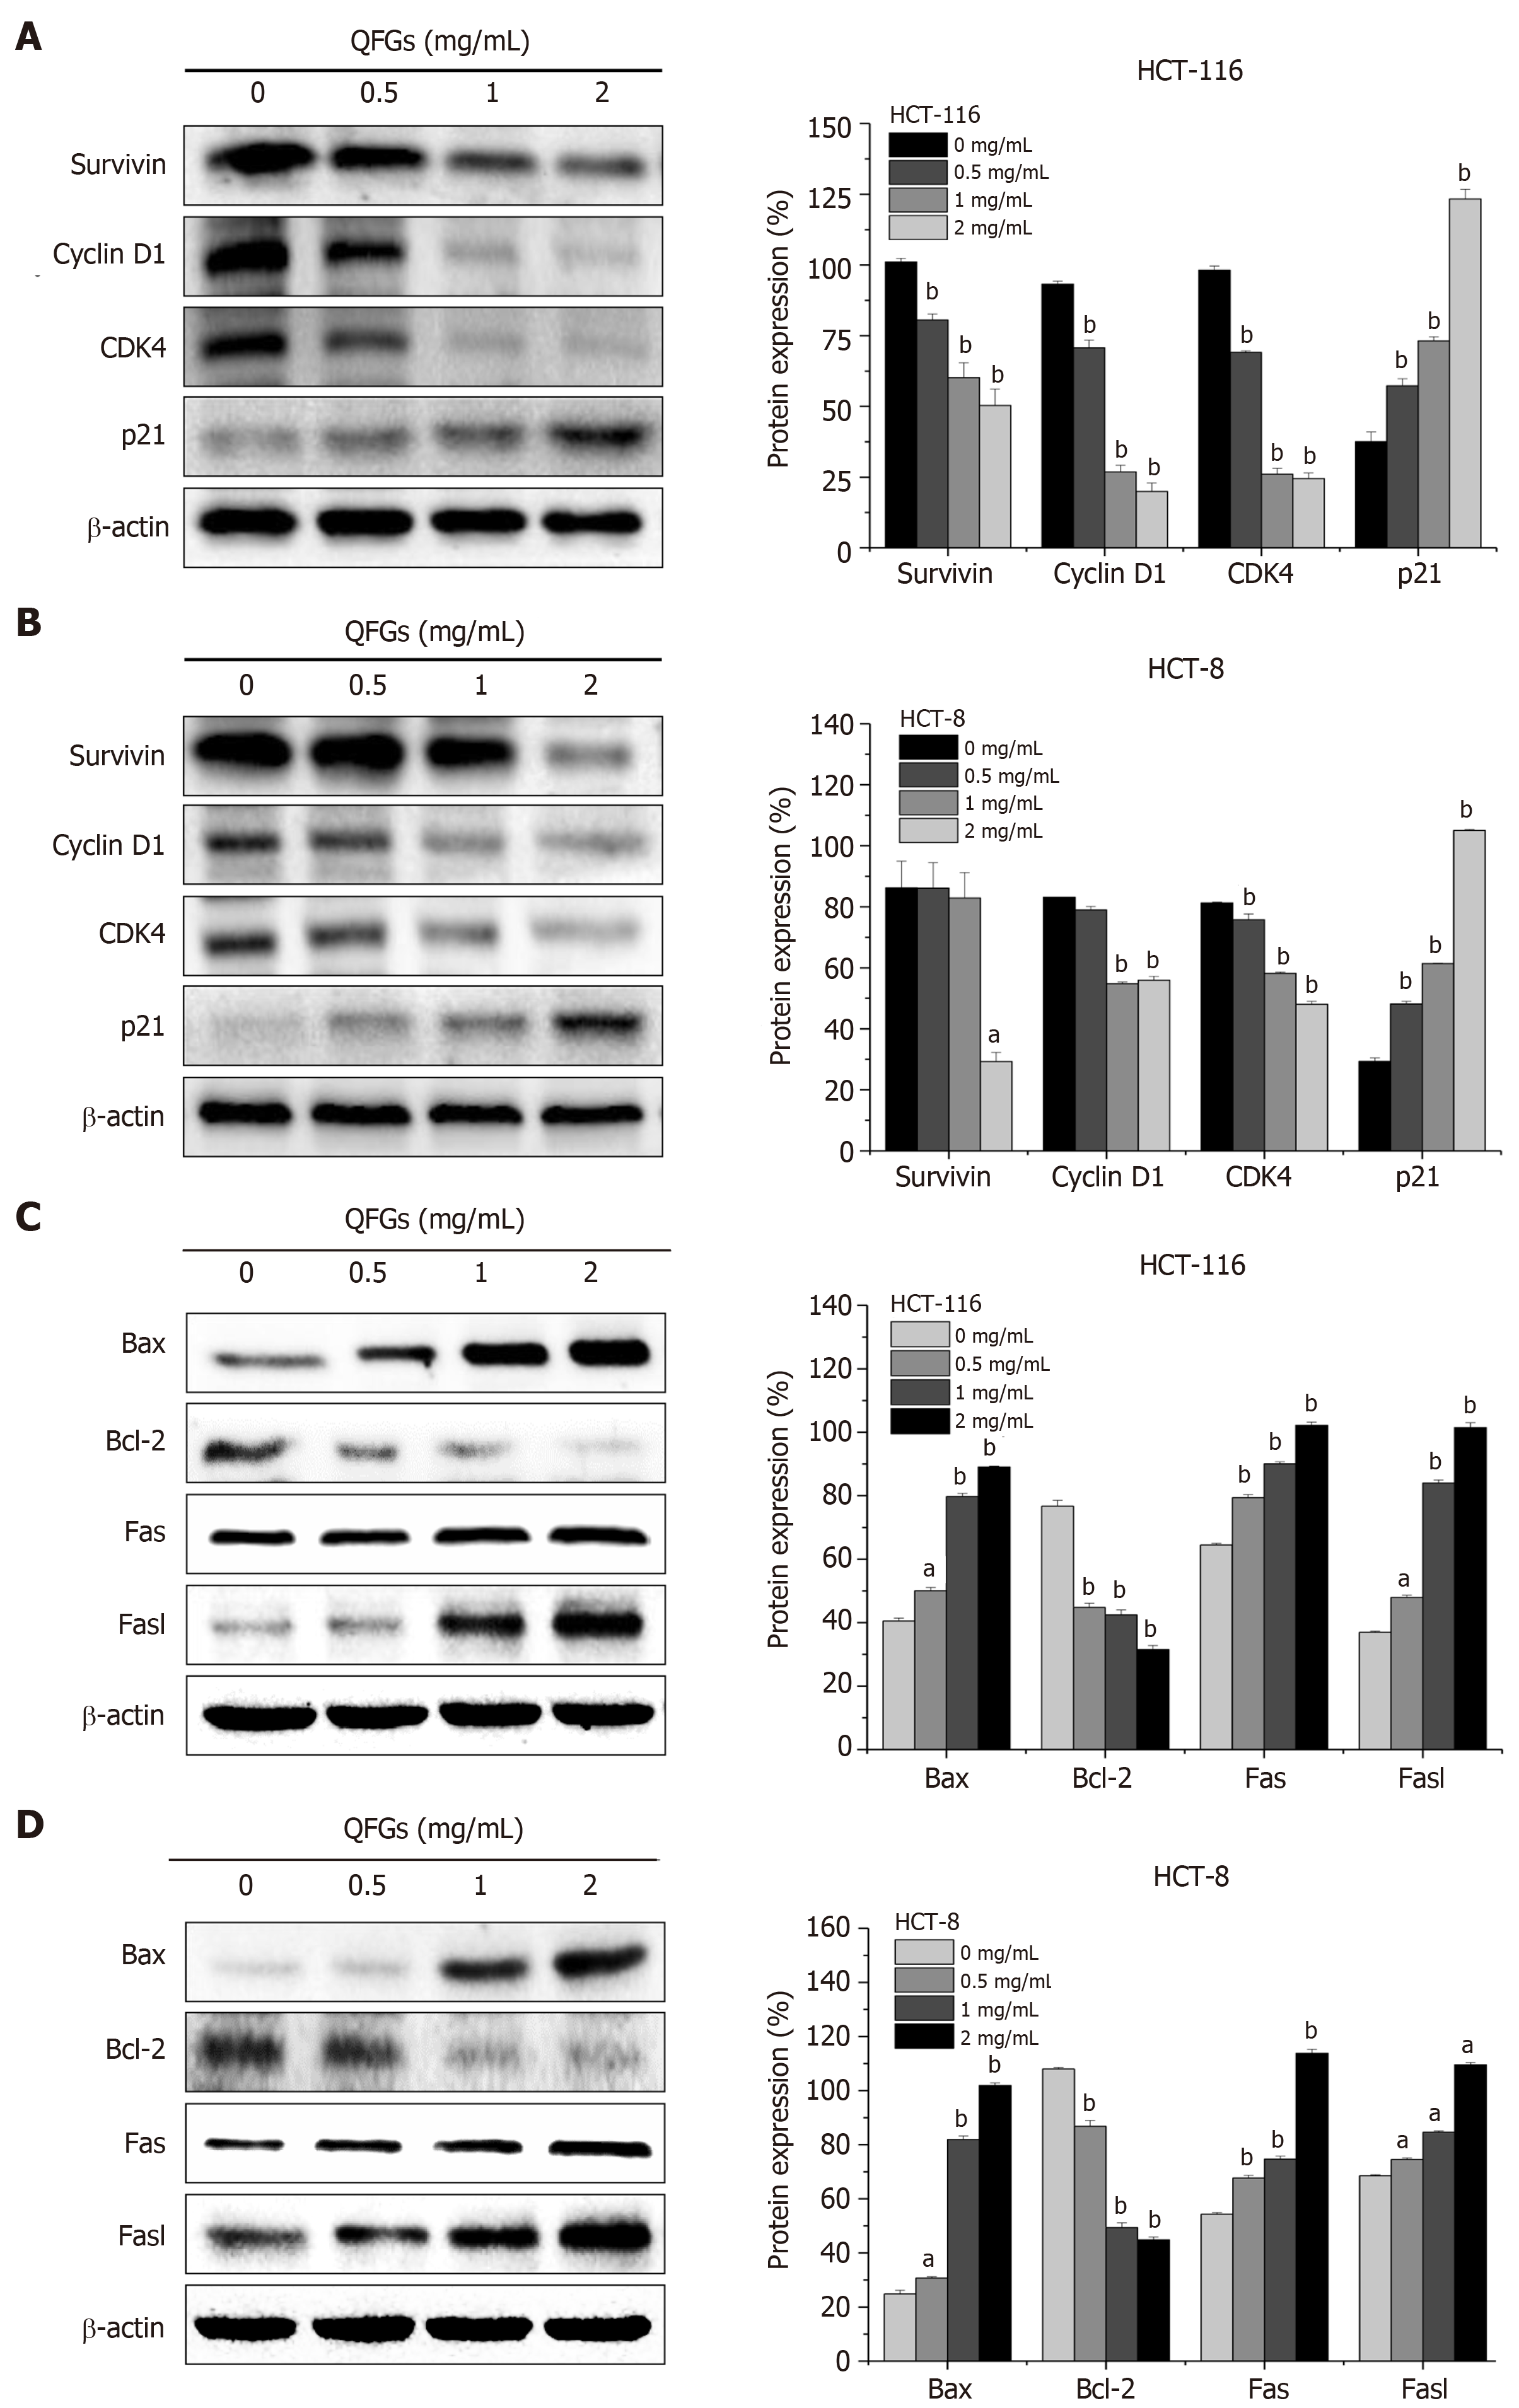
Figure 5 Effects of QFGs on the expression of survivin, cyclin D1, CDK4, p21, Bax, Bcl-2, Fas, and FasL in HCT-116 and HCT-8 cells.
A, B: The expression levels of survivin, cyclin D1, CDK4, and p21 were determined by western blot. β-actin was used as an internal control. Each band is representative of triplicate experiments. The band densities of western blots were quantitatively analyzed; C, D: The expressions of Bax, Bcl-2, Fas, and FasL were determined by western blot. β-actin was used as an internal control. Each band is representative of triplicate experiments. The band densities of western blots were quantitatively analyzed. aP < 0.05, bP < 0.01 vs the control group. QFGs: Qingjie Fuzheng granules; CDK4: Cyclin-dependent kinase 4; Bcl-2: B cell leukemia/lymphoma 2; Bax: Bcl2 associated X; FasL: Fas ligand.
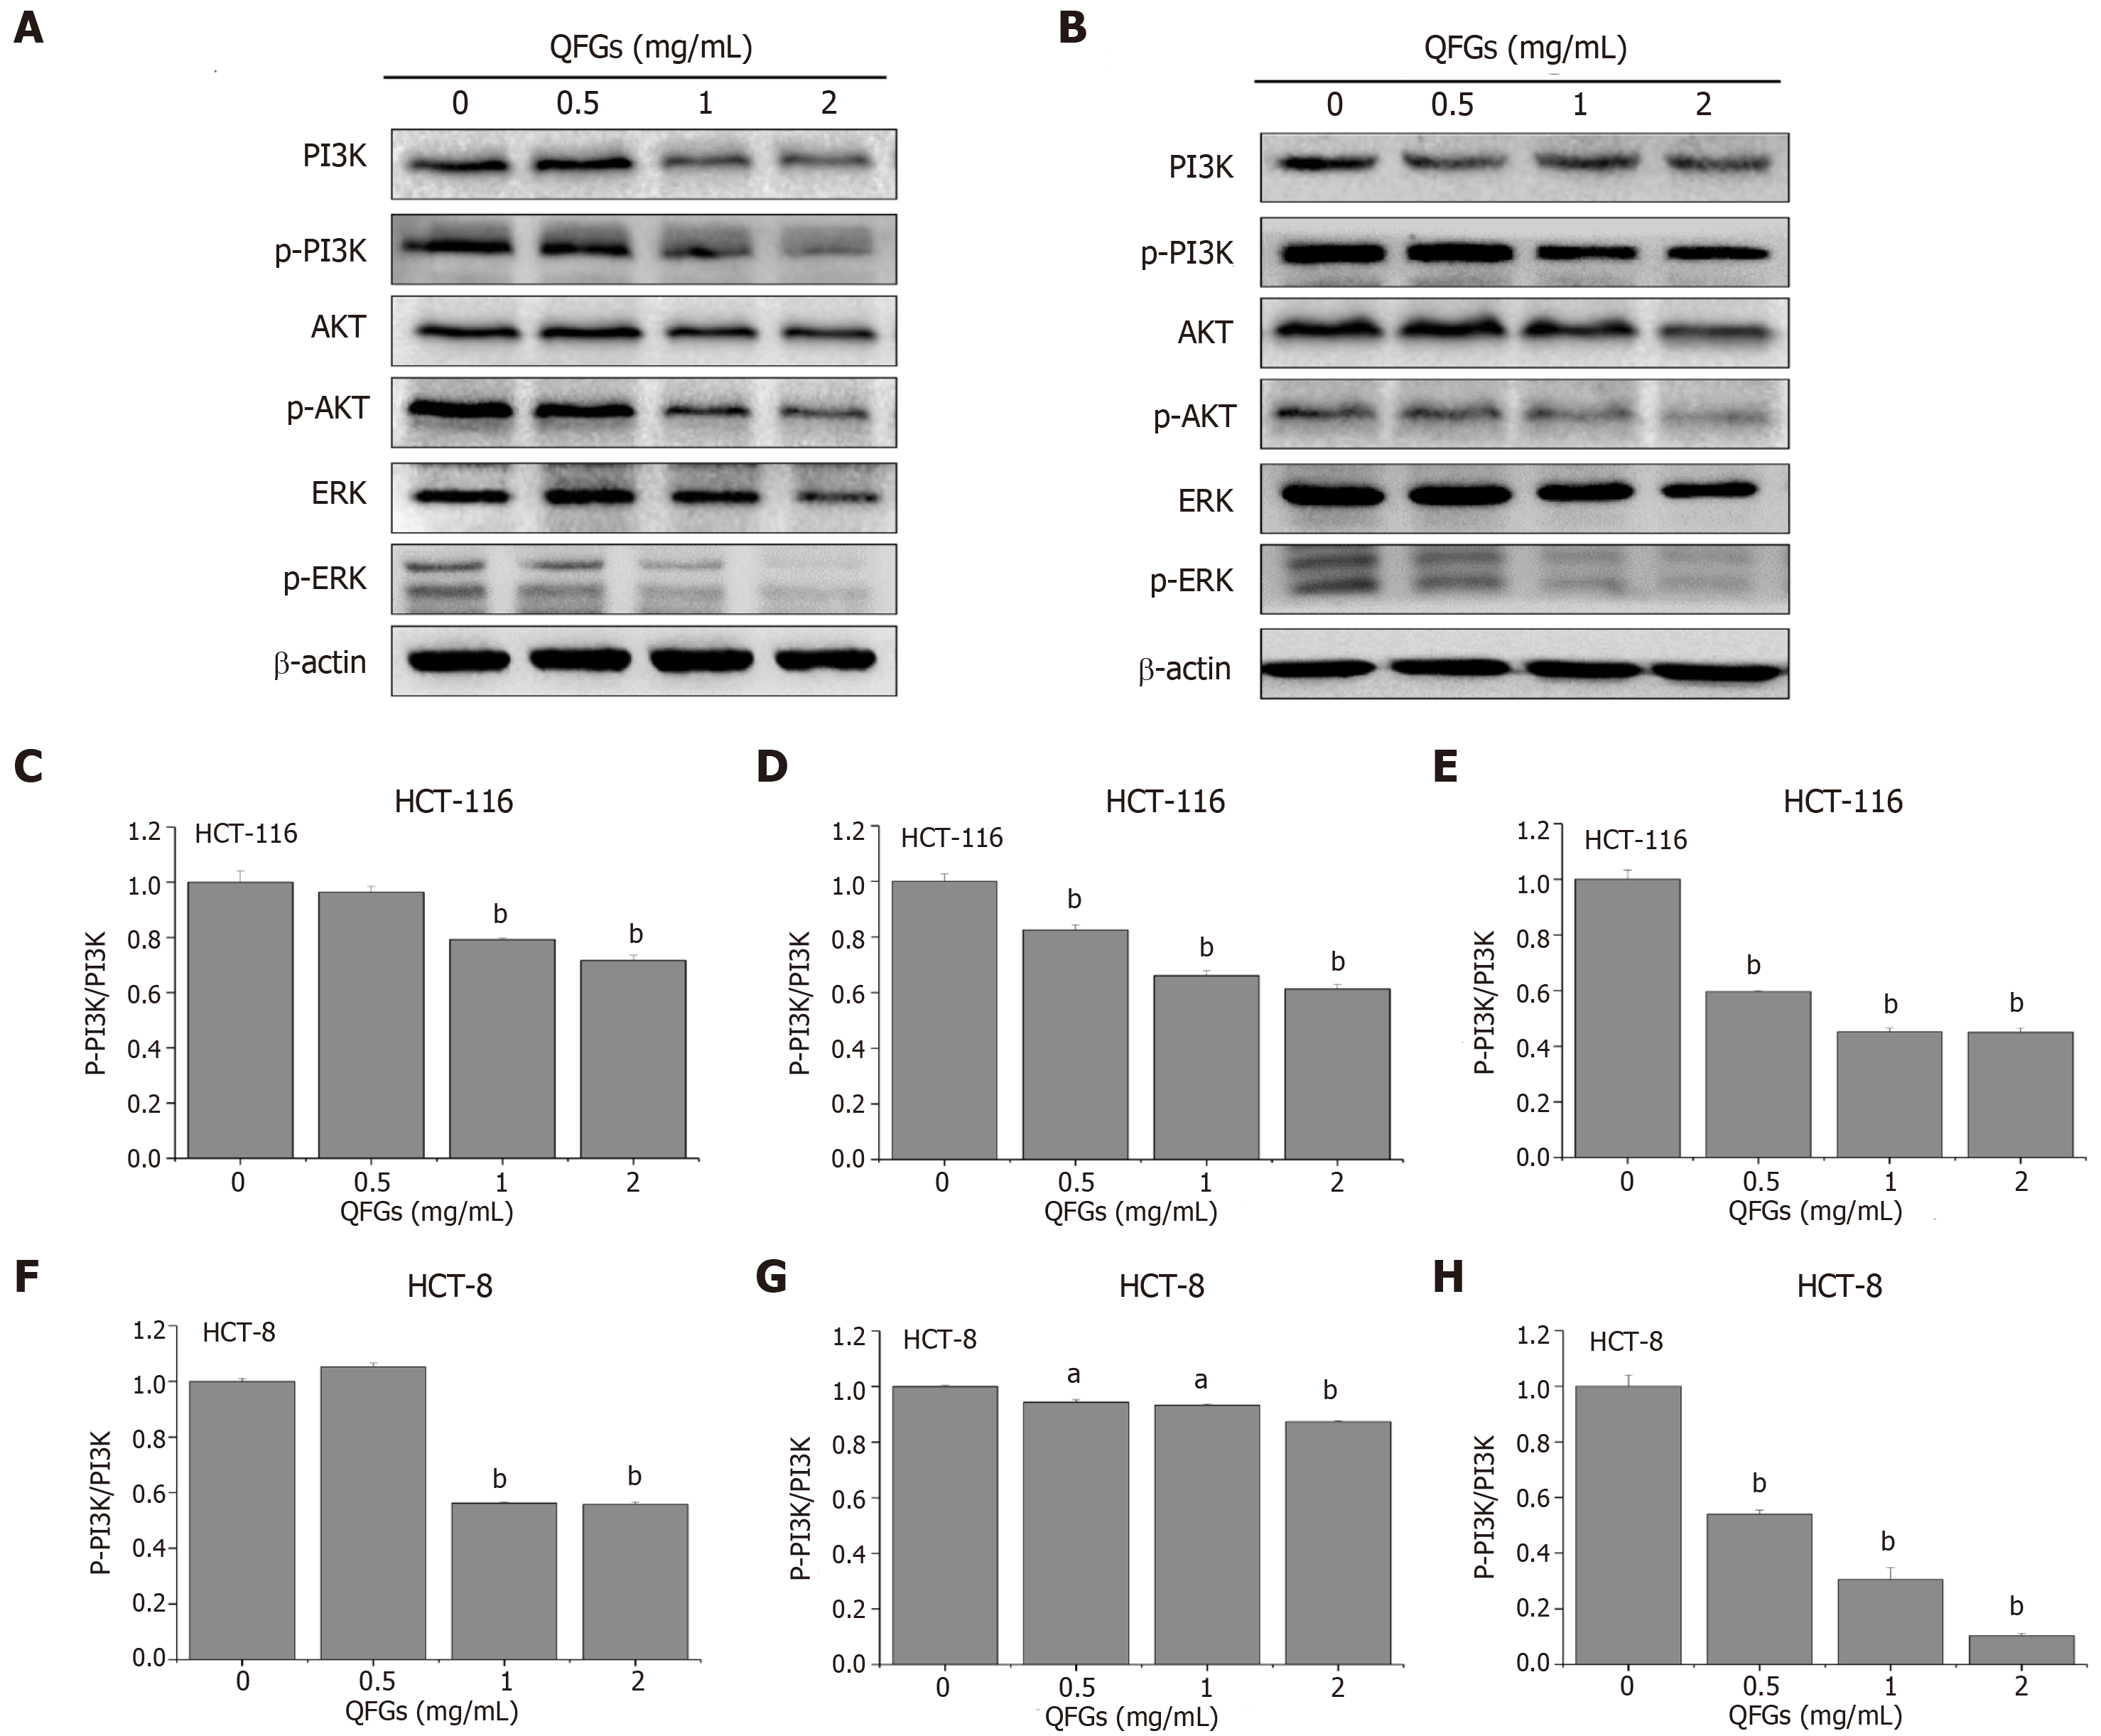
Figure 6 Effect of QFGs on the regulation of PI3K/AKT and ERK signaling pathways in HCT-116 and HCT-8 cells.
A, B: The expression and phosphorylation levels of PI3K, AKT and ERK in cells were determined by western blot. β-actin was used as an internal control. Each band is representative of triplicate experiments; C-H: The ratio of phosphorylation expression level/total expression level was quantitatively analyzed. aP < 0.05, bP < 0.01 vs the control group. QFGs: Qingjie Fuzheng granules; PI3K: Phosphatidylinositol 3-kinase; p‑PI3K, Phosphorylated‑PI3K; AKT: Protein kinase B; p‑AKT: Phosphorylated‑AKT; ERK: Extracellular regulated protein kinases.
- Citation: Yang H, Liu JX, Shang HX, Lin S, Zhao JY, Lin JM. Qingjie Fuzheng granules inhibit colorectal cancer cell growth by the PI3K/AKT and ERK pathways. World J Gastrointest Oncol 2019; 11(5): 377-392
- URL: https://www.wjgnet.com/1948-5204/full/v11/i5/377.htm
- DOI: https://dx.doi.org/10.4251/wjgo.v11.i5.377


