Copyright
©2013 Baishideng Publishing Group Co.
World J Gastrointest Endosc. Feb 16, 2013; 5(2): 74-78
Published online Feb 16, 2013. doi: 10.4253/wjge.v5.i2.74
Published online Feb 16, 2013. doi: 10.4253/wjge.v5.i2.74
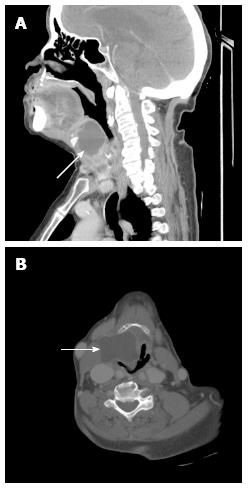
Figure 1 Computed tomography neck soft tissue.
A: Sagittal view of neck soft tissue (arrow); B: Transverse view of neck soft tissue (arrow).
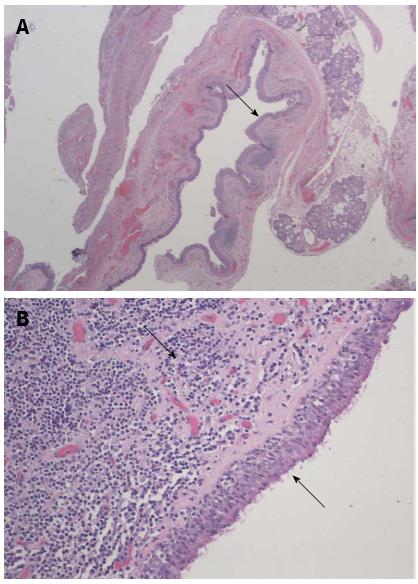
Figure 2 Hematoxylin and eosin stain.
A: The respiratory epithelium lined membranous fibrous tissue (arrow) consistent with laryngocele (low power magnification); B: The laryngocele wall showing focal chronic inflammation and reactive lymphoid aggregates (arrows, high power magnification).
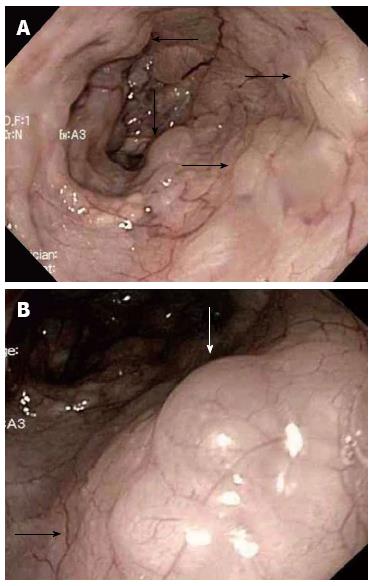
Figure 3 Endoscopic view of the esophagus.
A: Endoscopic view of the esophagus showing the submucosal air blebs (arrows) throughout the esophagus; B: Magnified view of the pneumatosis of the esophagus on endoscopy. These air blebs (arrows) were seen throughout the esophagus.
- Citation: Chelimilla H, Makker JS, Dev A. Incidental finding of esophageal pneumatosis. World J Gastrointest Endosc 2013; 5(2): 74-78
- URL: https://www.wjgnet.com/1948-5190/full/v5/i2/74.htm
- DOI: https://dx.doi.org/10.4253/wjge.v5.i2.74


