Copyright
©The Author(s) 2025.
World J Gastrointest Endosc. May 16, 2025; 17(5): 106690
Published online May 16, 2025. doi: 10.4253/wjge.v17.i5.106690
Published online May 16, 2025. doi: 10.4253/wjge.v17.i5.106690
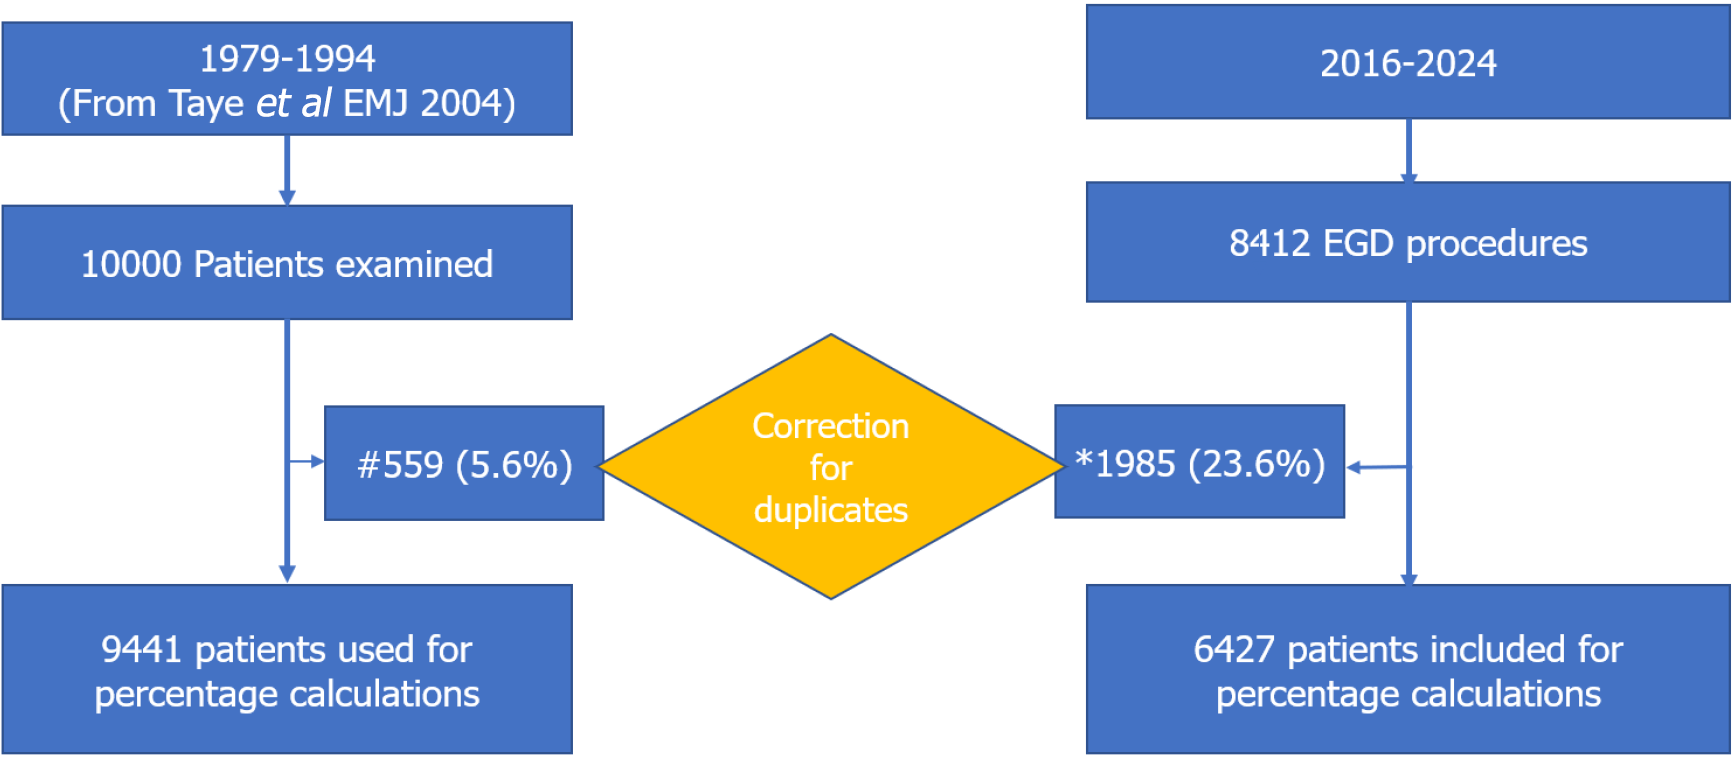
Figure 1 Flow chart of patient selection.
#5.6% had multiple diagnosis or multiple procedures per patient. Duplicates removed to match documentation of the 2016-2024 where only one major diagnosis is recorded per patient on the database for percentage calculation. *23.6% of patients had multiple procedures mostly therapeutic endoscopy for the same diagnosis e.g. repeated stricture dilatation and variceal band ligations. EGD: Esophagoastroduodenoscopy.
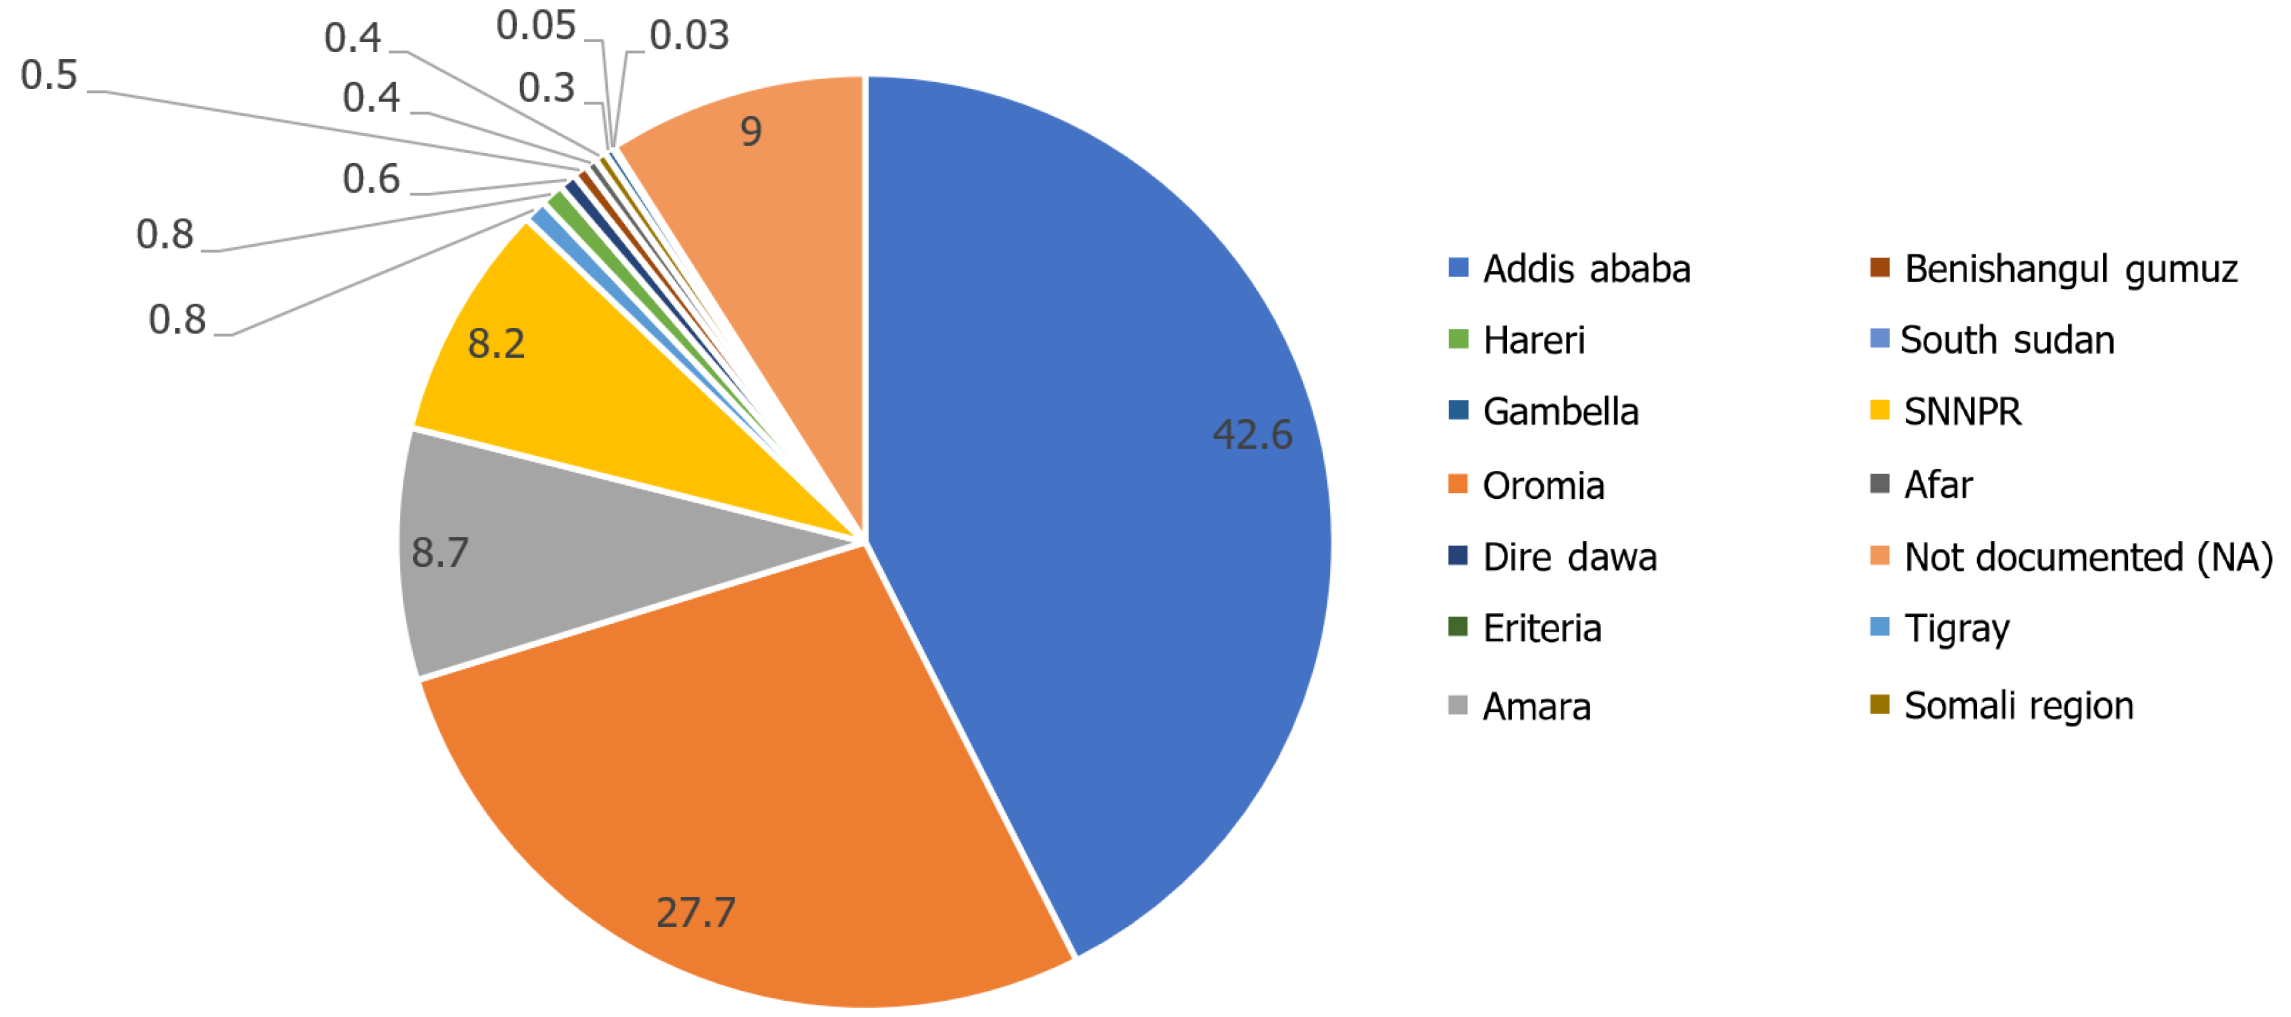
Figure 2 Regional distribution of patients (percentage) attending upper gastrointestinal endoscopy services at Tikur Anbessa Specialized Hospital in Ethiopia 2016-2024 (n = 6427).
SNNPR: Southern Nation Nationality Region.
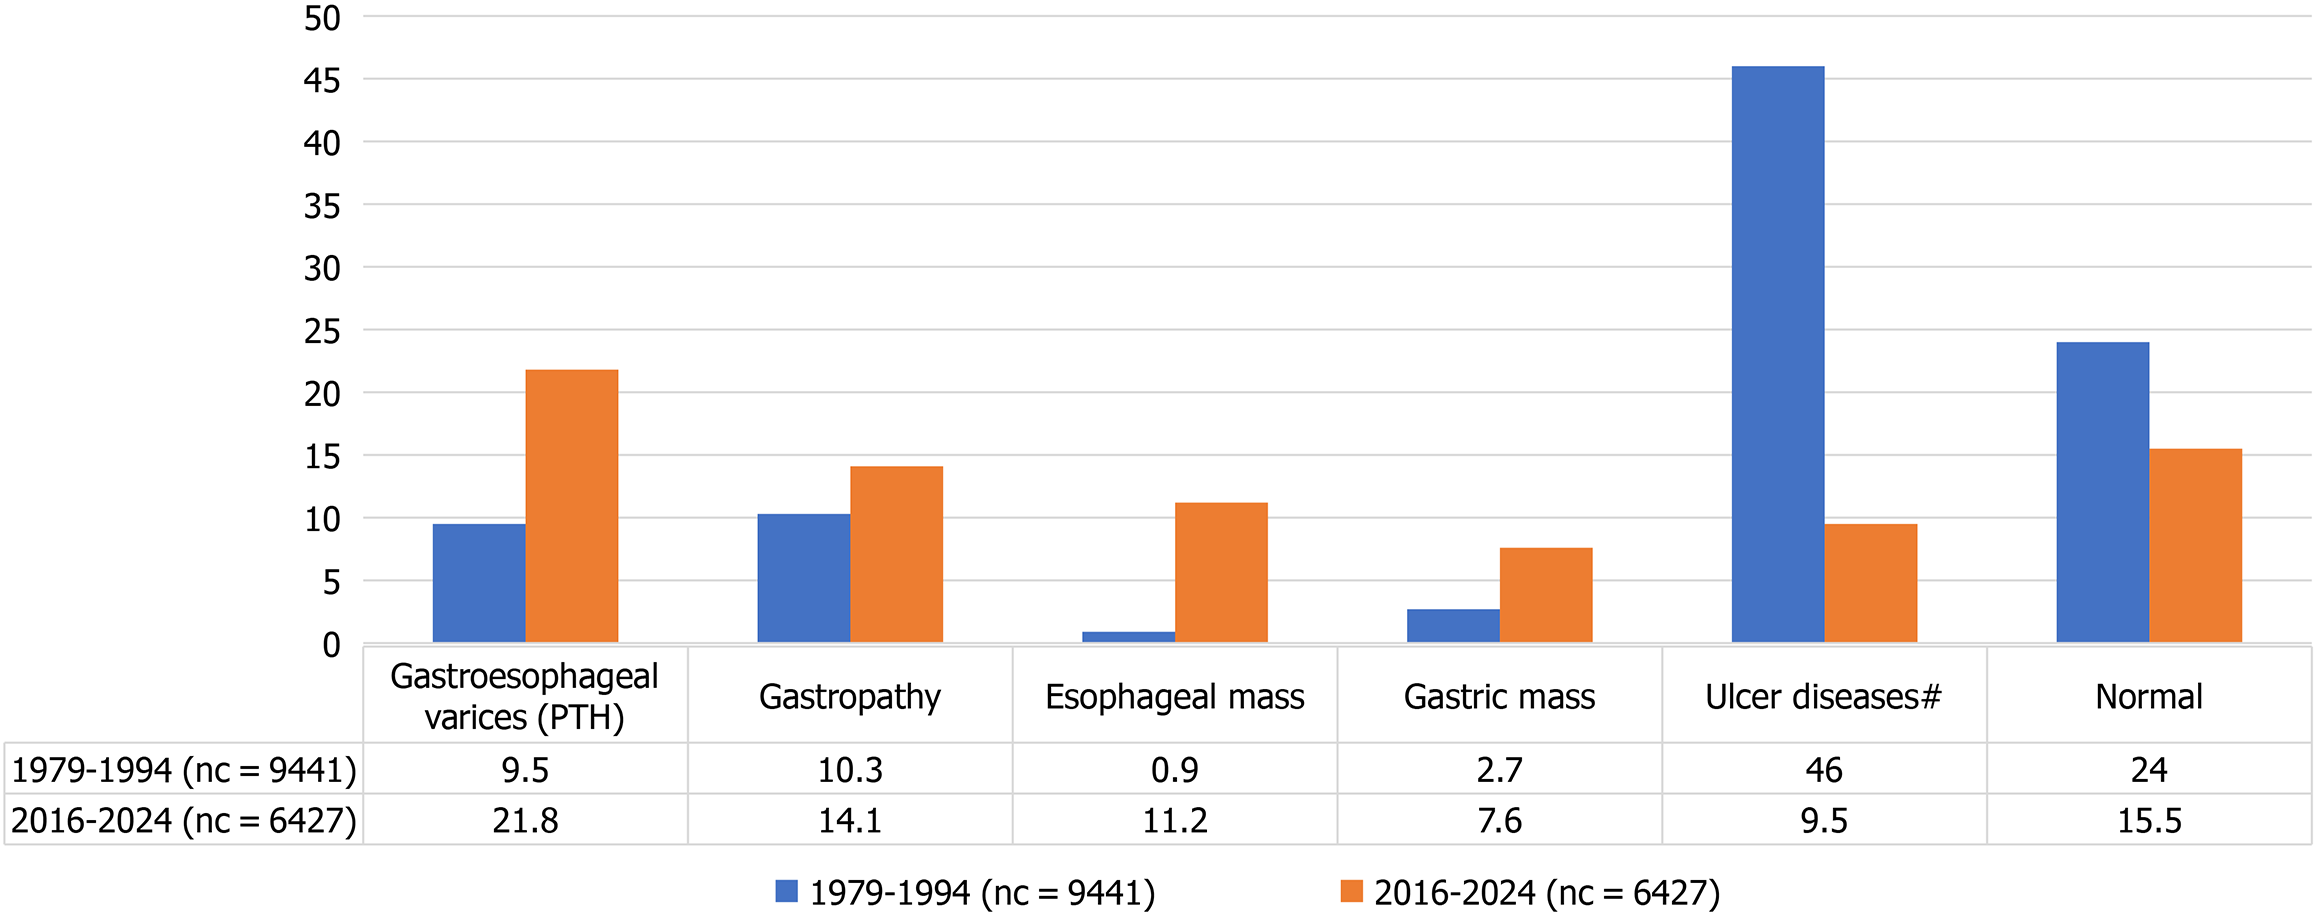
Figure 3 Percentage changes of major endoscopic findings among Ethiopian patients.
nc: Number of cases.
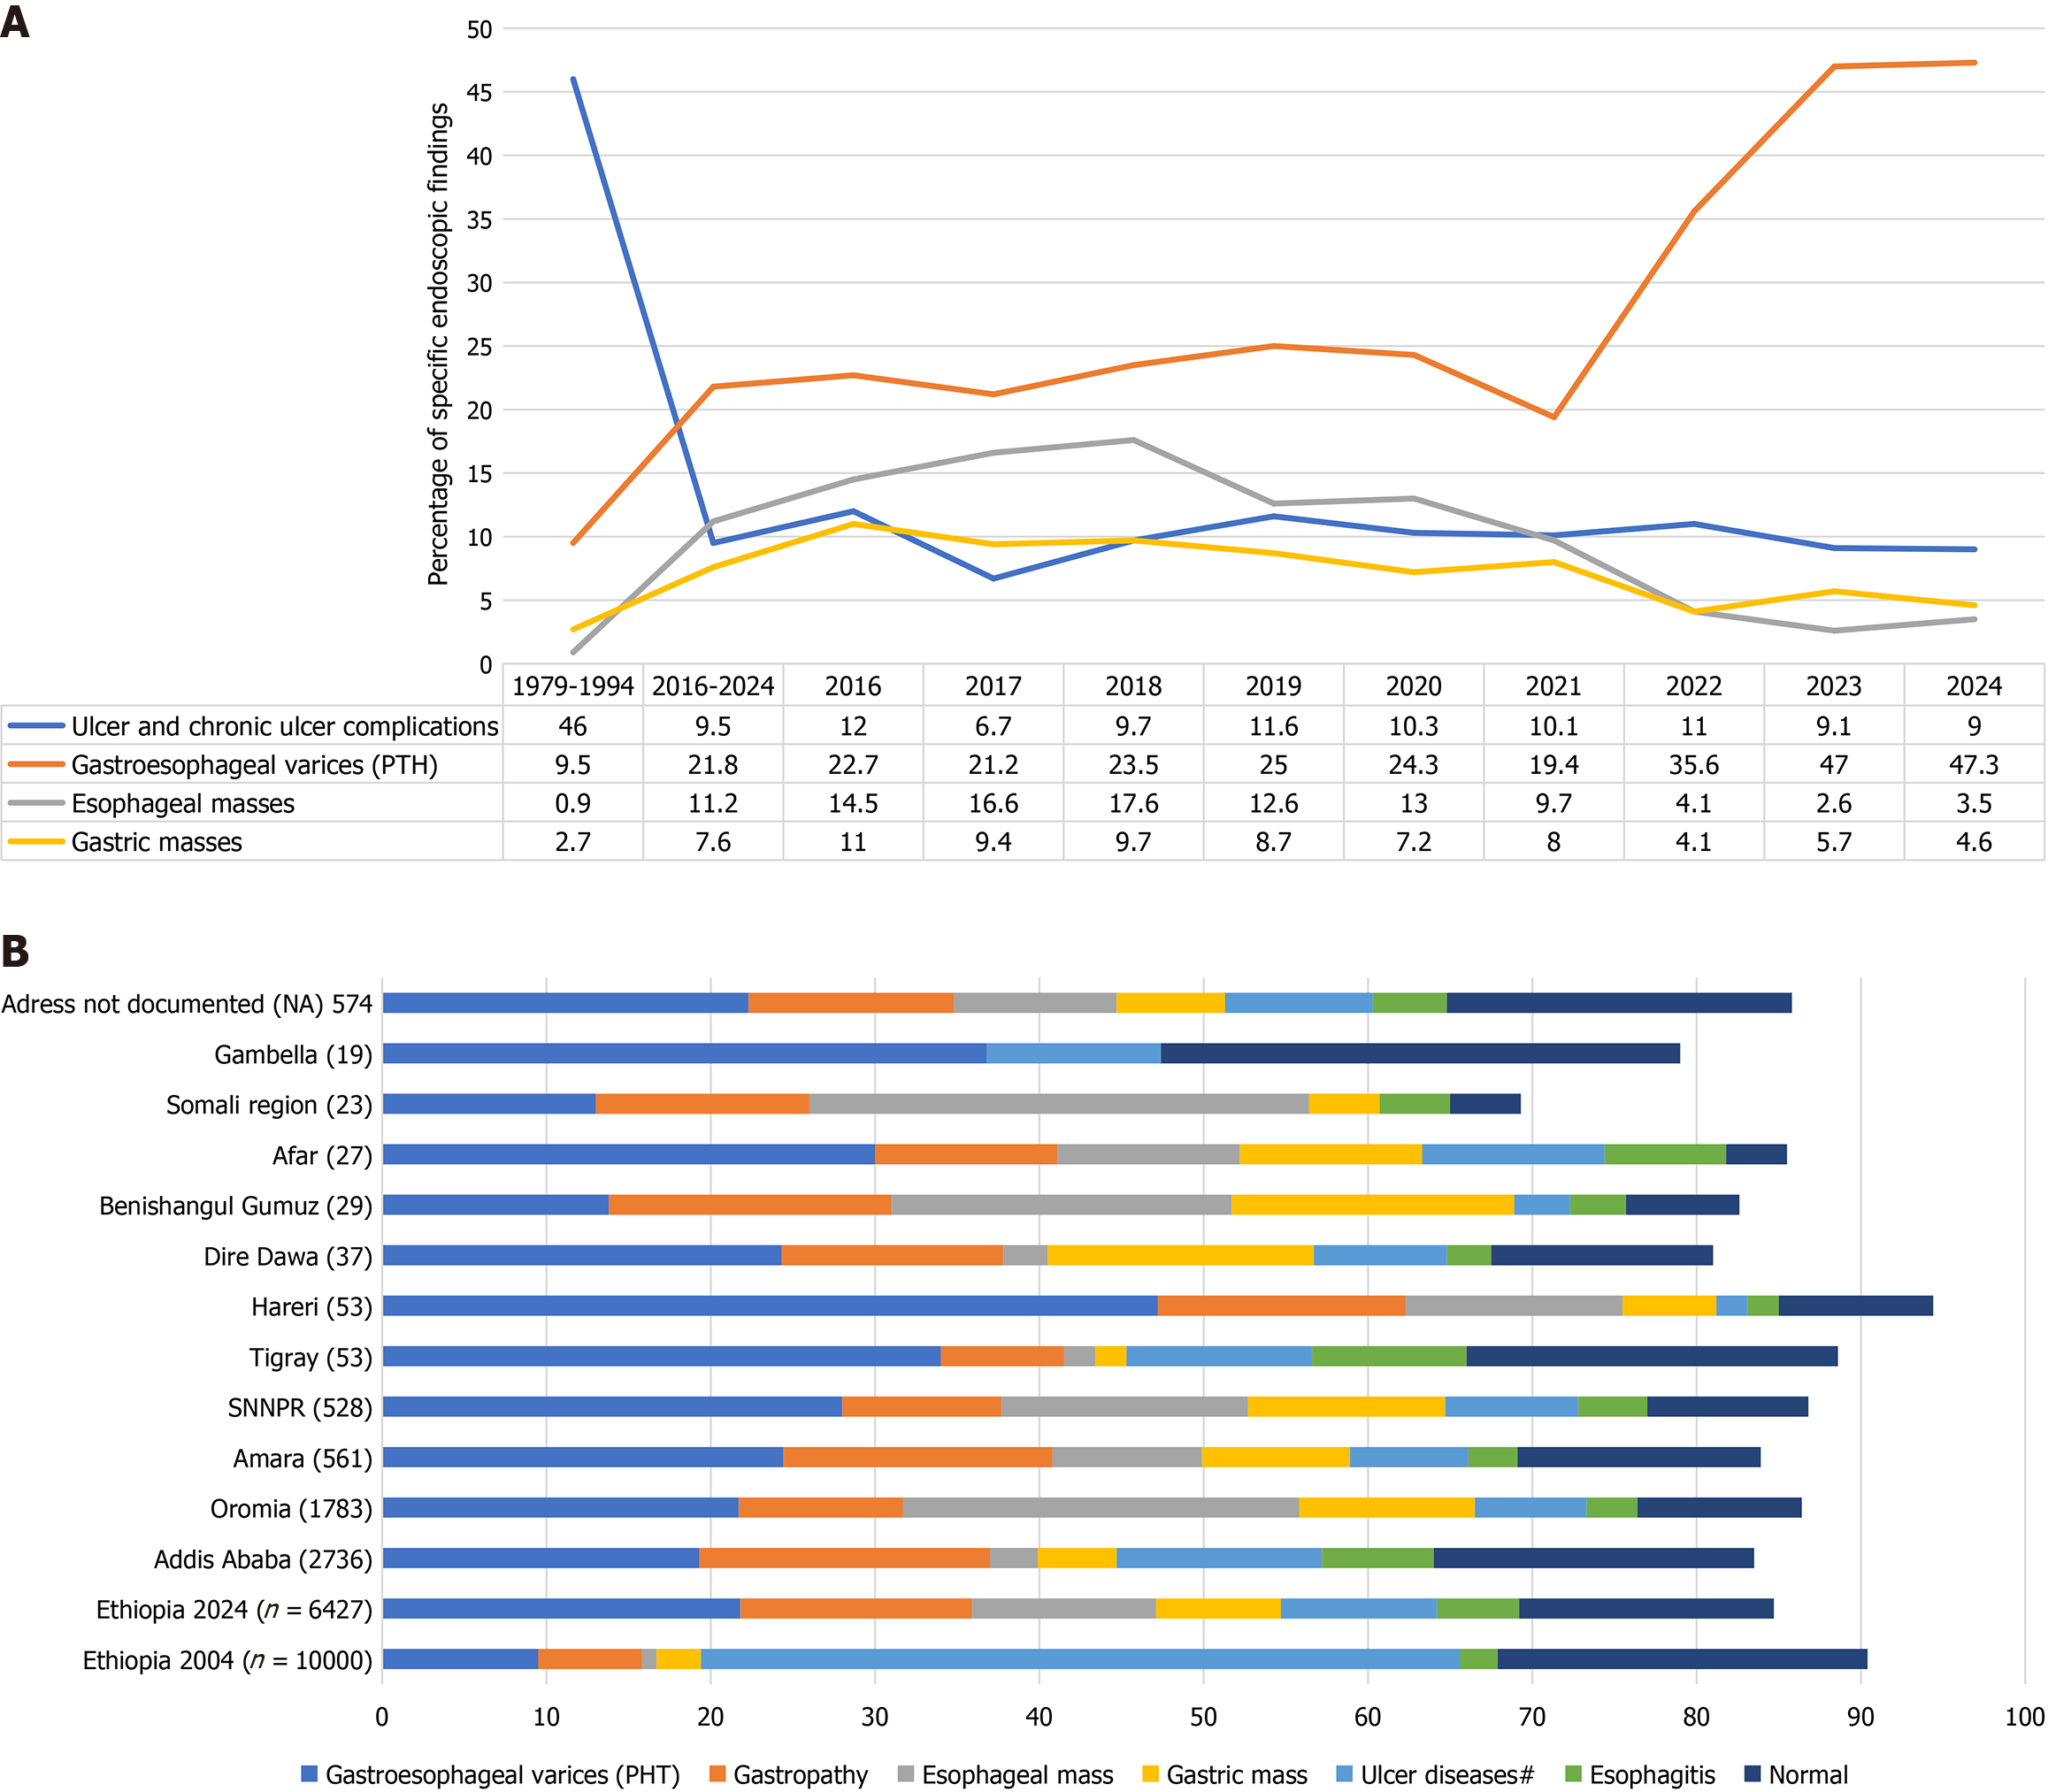
Figure 4 Aggregate and annual trends of major endoscopic findings at Tikur Anbessa Hospital.
A: Time trends of major upper gastrointestinal endoscopic findings diagnosed at Tikur Anbessa Specialized Hospital endoscopy enter 1979-1994 compared to 2016-2024 and the past 9 years; B: Percentage and regional distribution of upper gastrointestinal diseases in Ethiopia diagnosed at Tikur Anbessa Specialized Hospital endoscopy center 2016-2024 compared to 1979-1994. PHT: Portal hypertension.
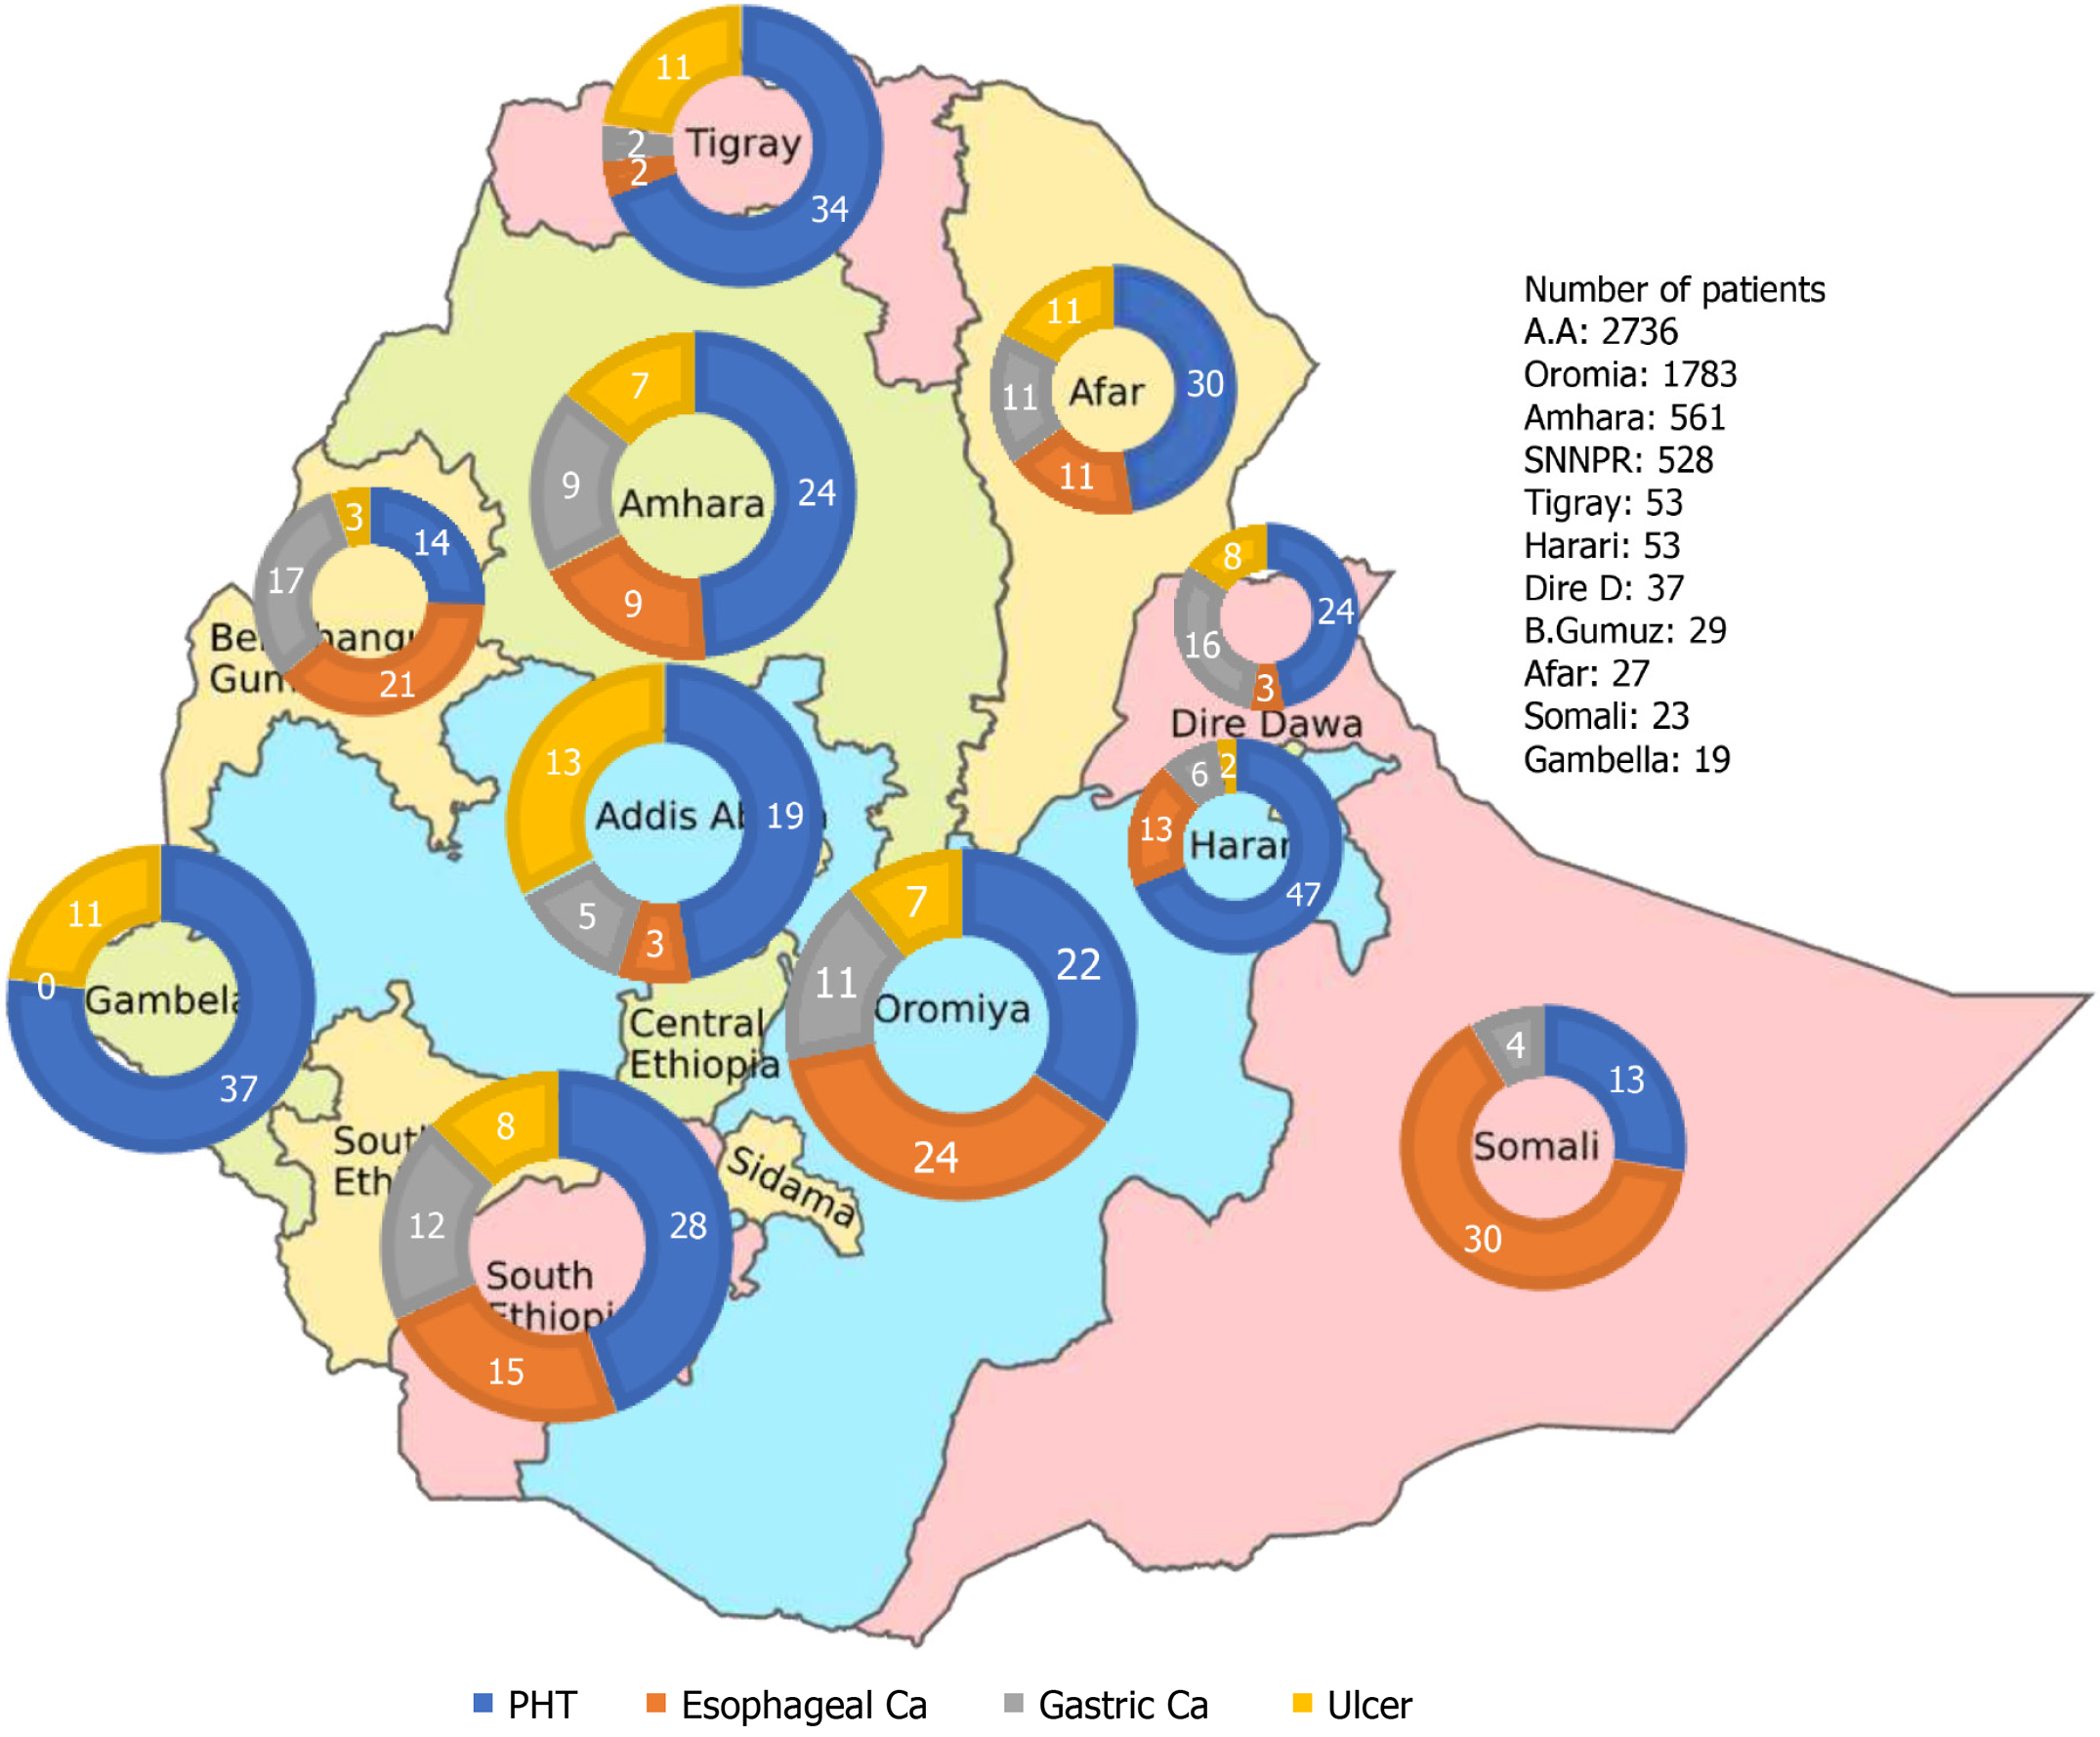
Figure 5 Map depicting proportion of regional patients with major findings.
SNNPR: Southern nation nationality people region.
- Citation: Roro GM, Annose RT, Gilja OH. Changing trends in upper gastrointestinal endoscopic findings in Ethiopia: A comparison of eighteen thousand exams across two periods. World J Gastrointest Endosc 2025; 17(5): 106690
- URL: https://www.wjgnet.com/1948-5190/full/v17/i5/106690.htm
- DOI: https://dx.doi.org/10.4253/wjge.v17.i5.106690


