Copyright
©The Author(s) 2023.
World J Gastrointest Endosc. Sep 16, 2023; 15(9): 574-583
Published online Sep 16, 2023. doi: 10.4253/wjge.v15.i9.574
Published online Sep 16, 2023. doi: 10.4253/wjge.v15.i9.574
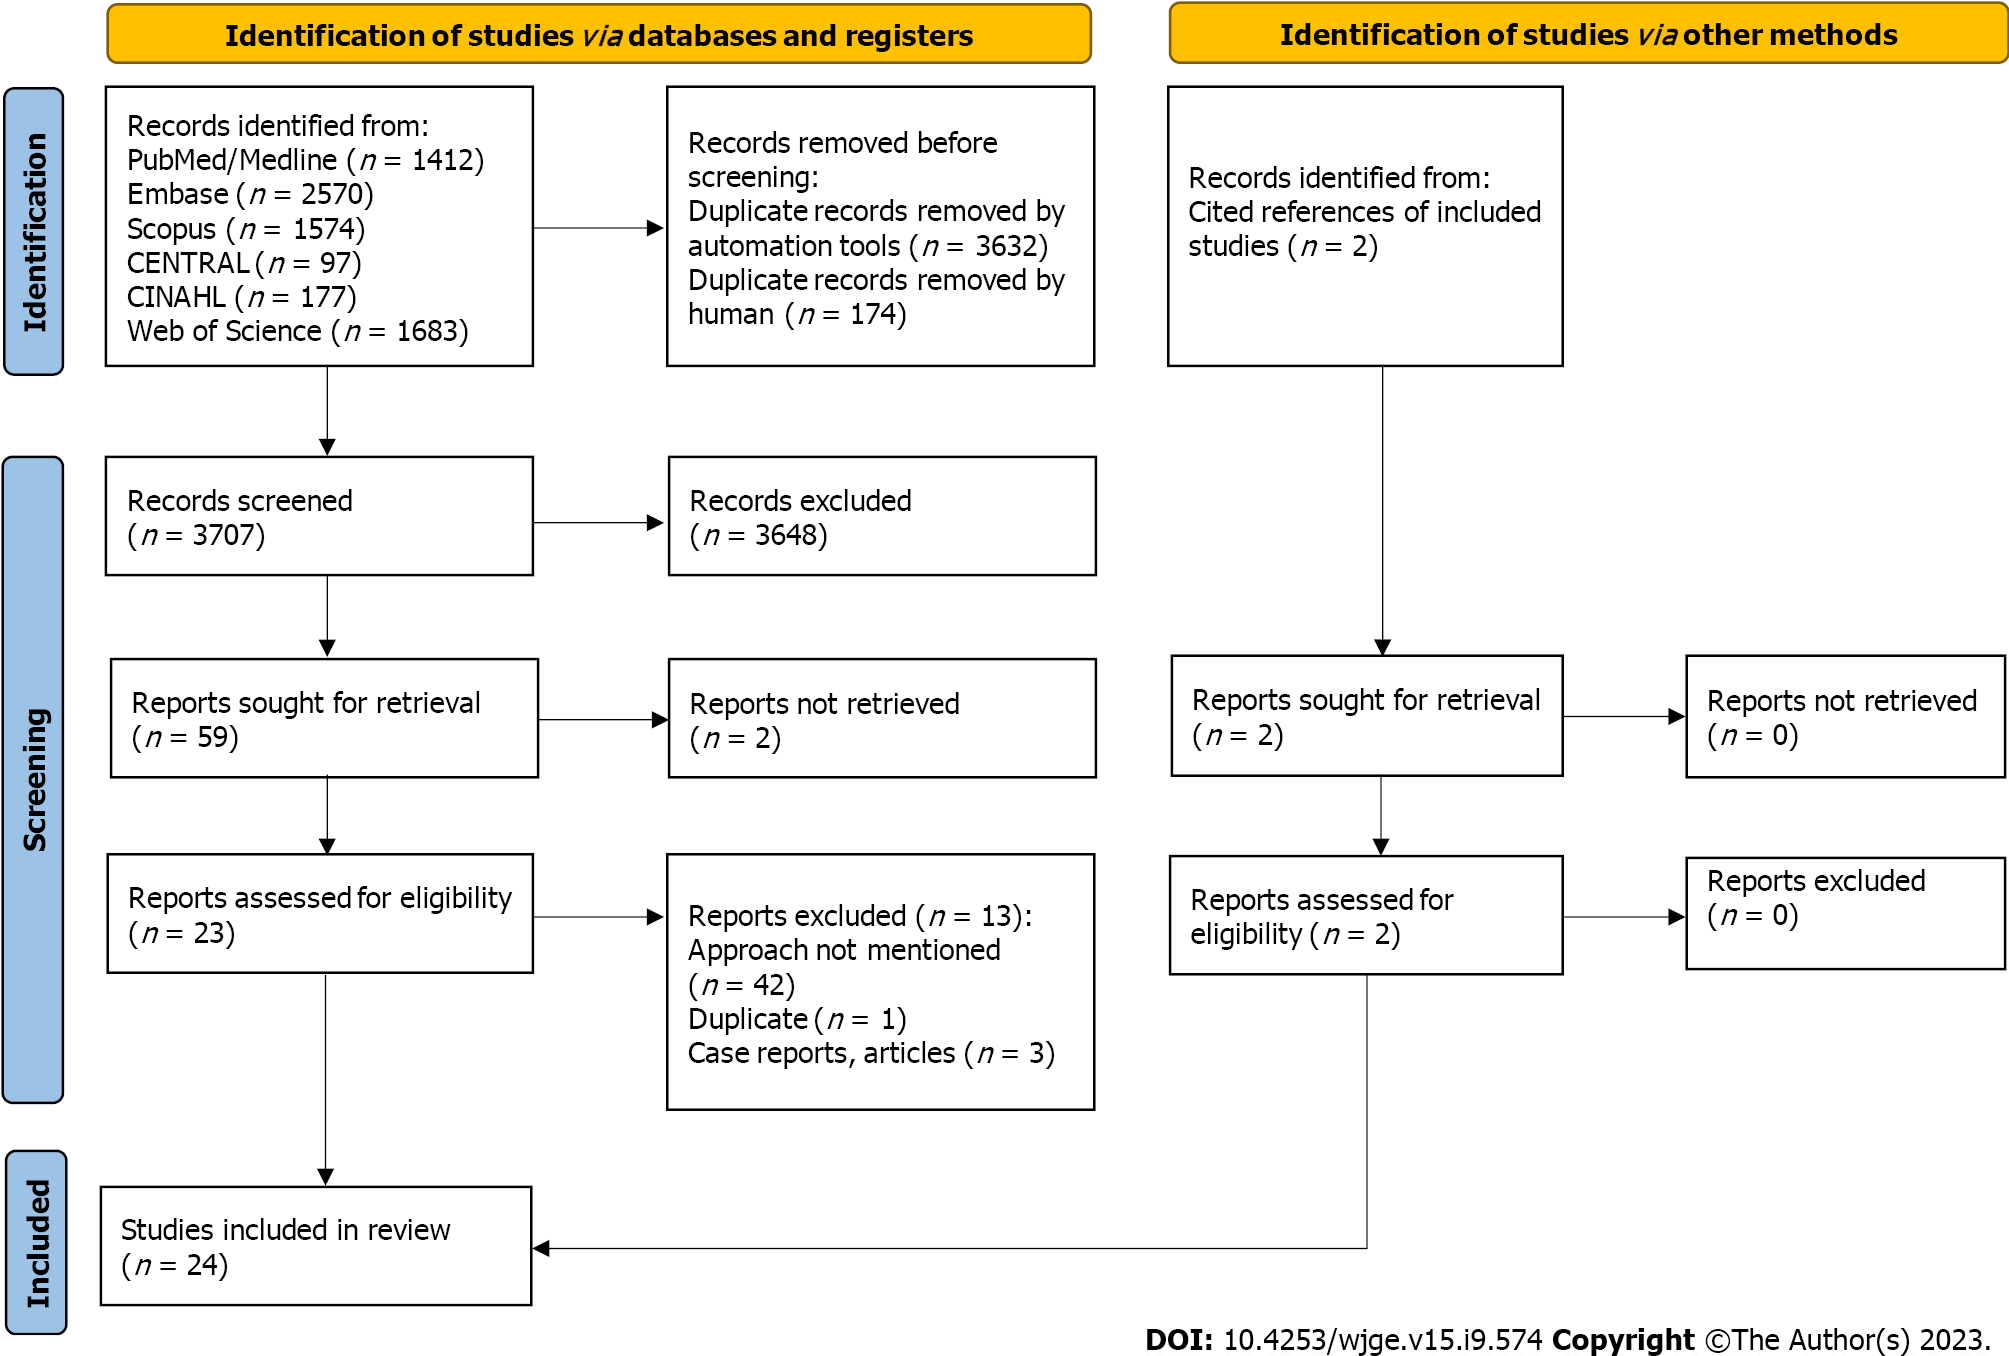
Figure 1 PRISMA flow diagram.
PRISMA flow diagram elucidating screening and selection studies for comparison of transduodenal/transjejunal vs transgastric approaches.
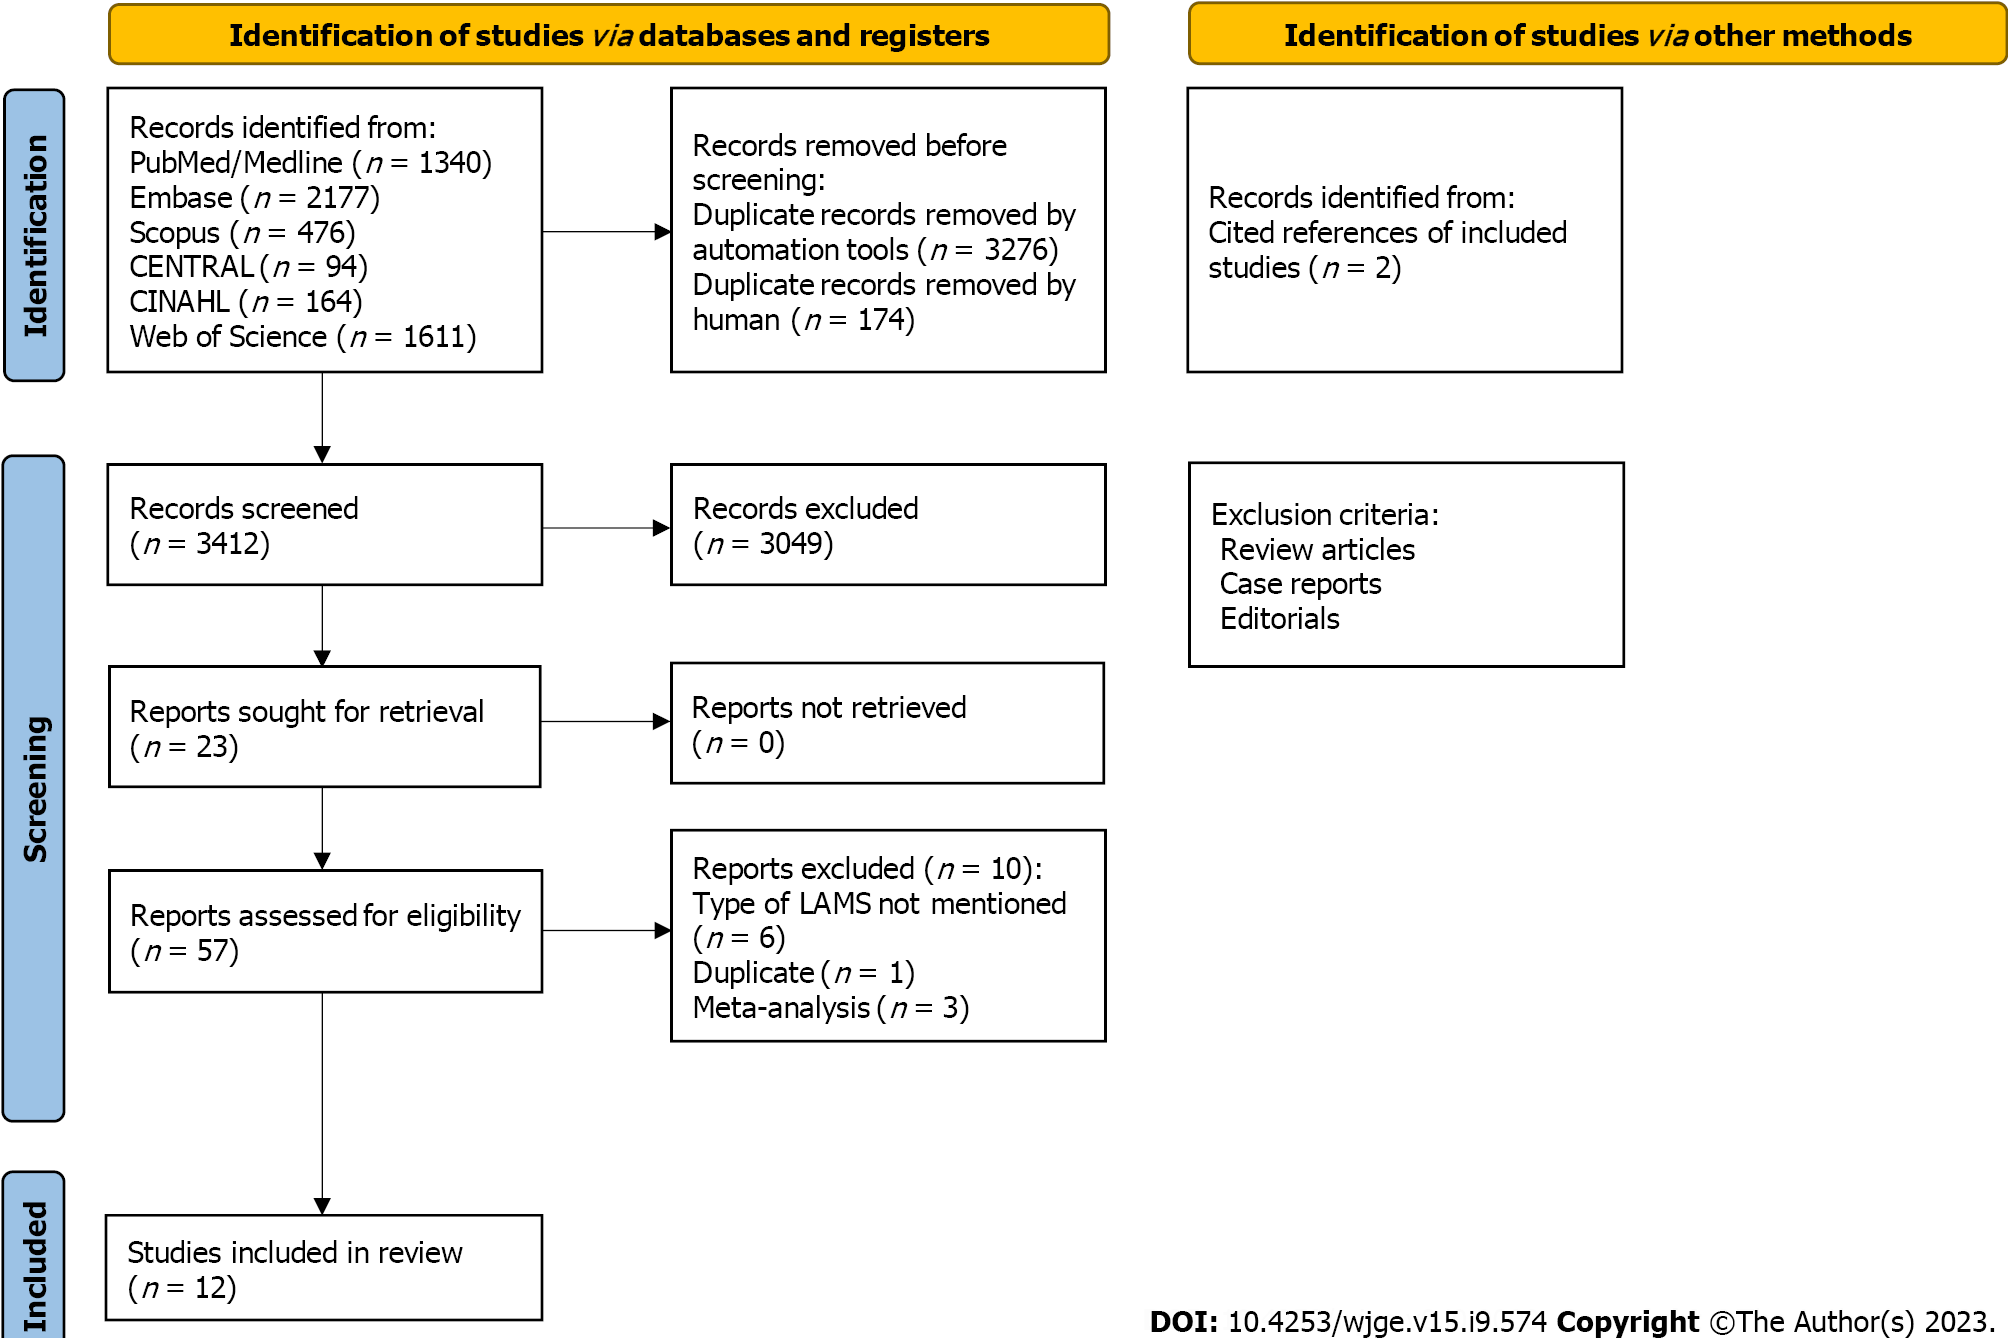
Figure 2 PRISMA flow diagram elucidating the screening and selection of studies for comparison or cautery-enhanced vs non-cautery enhanced approaches.
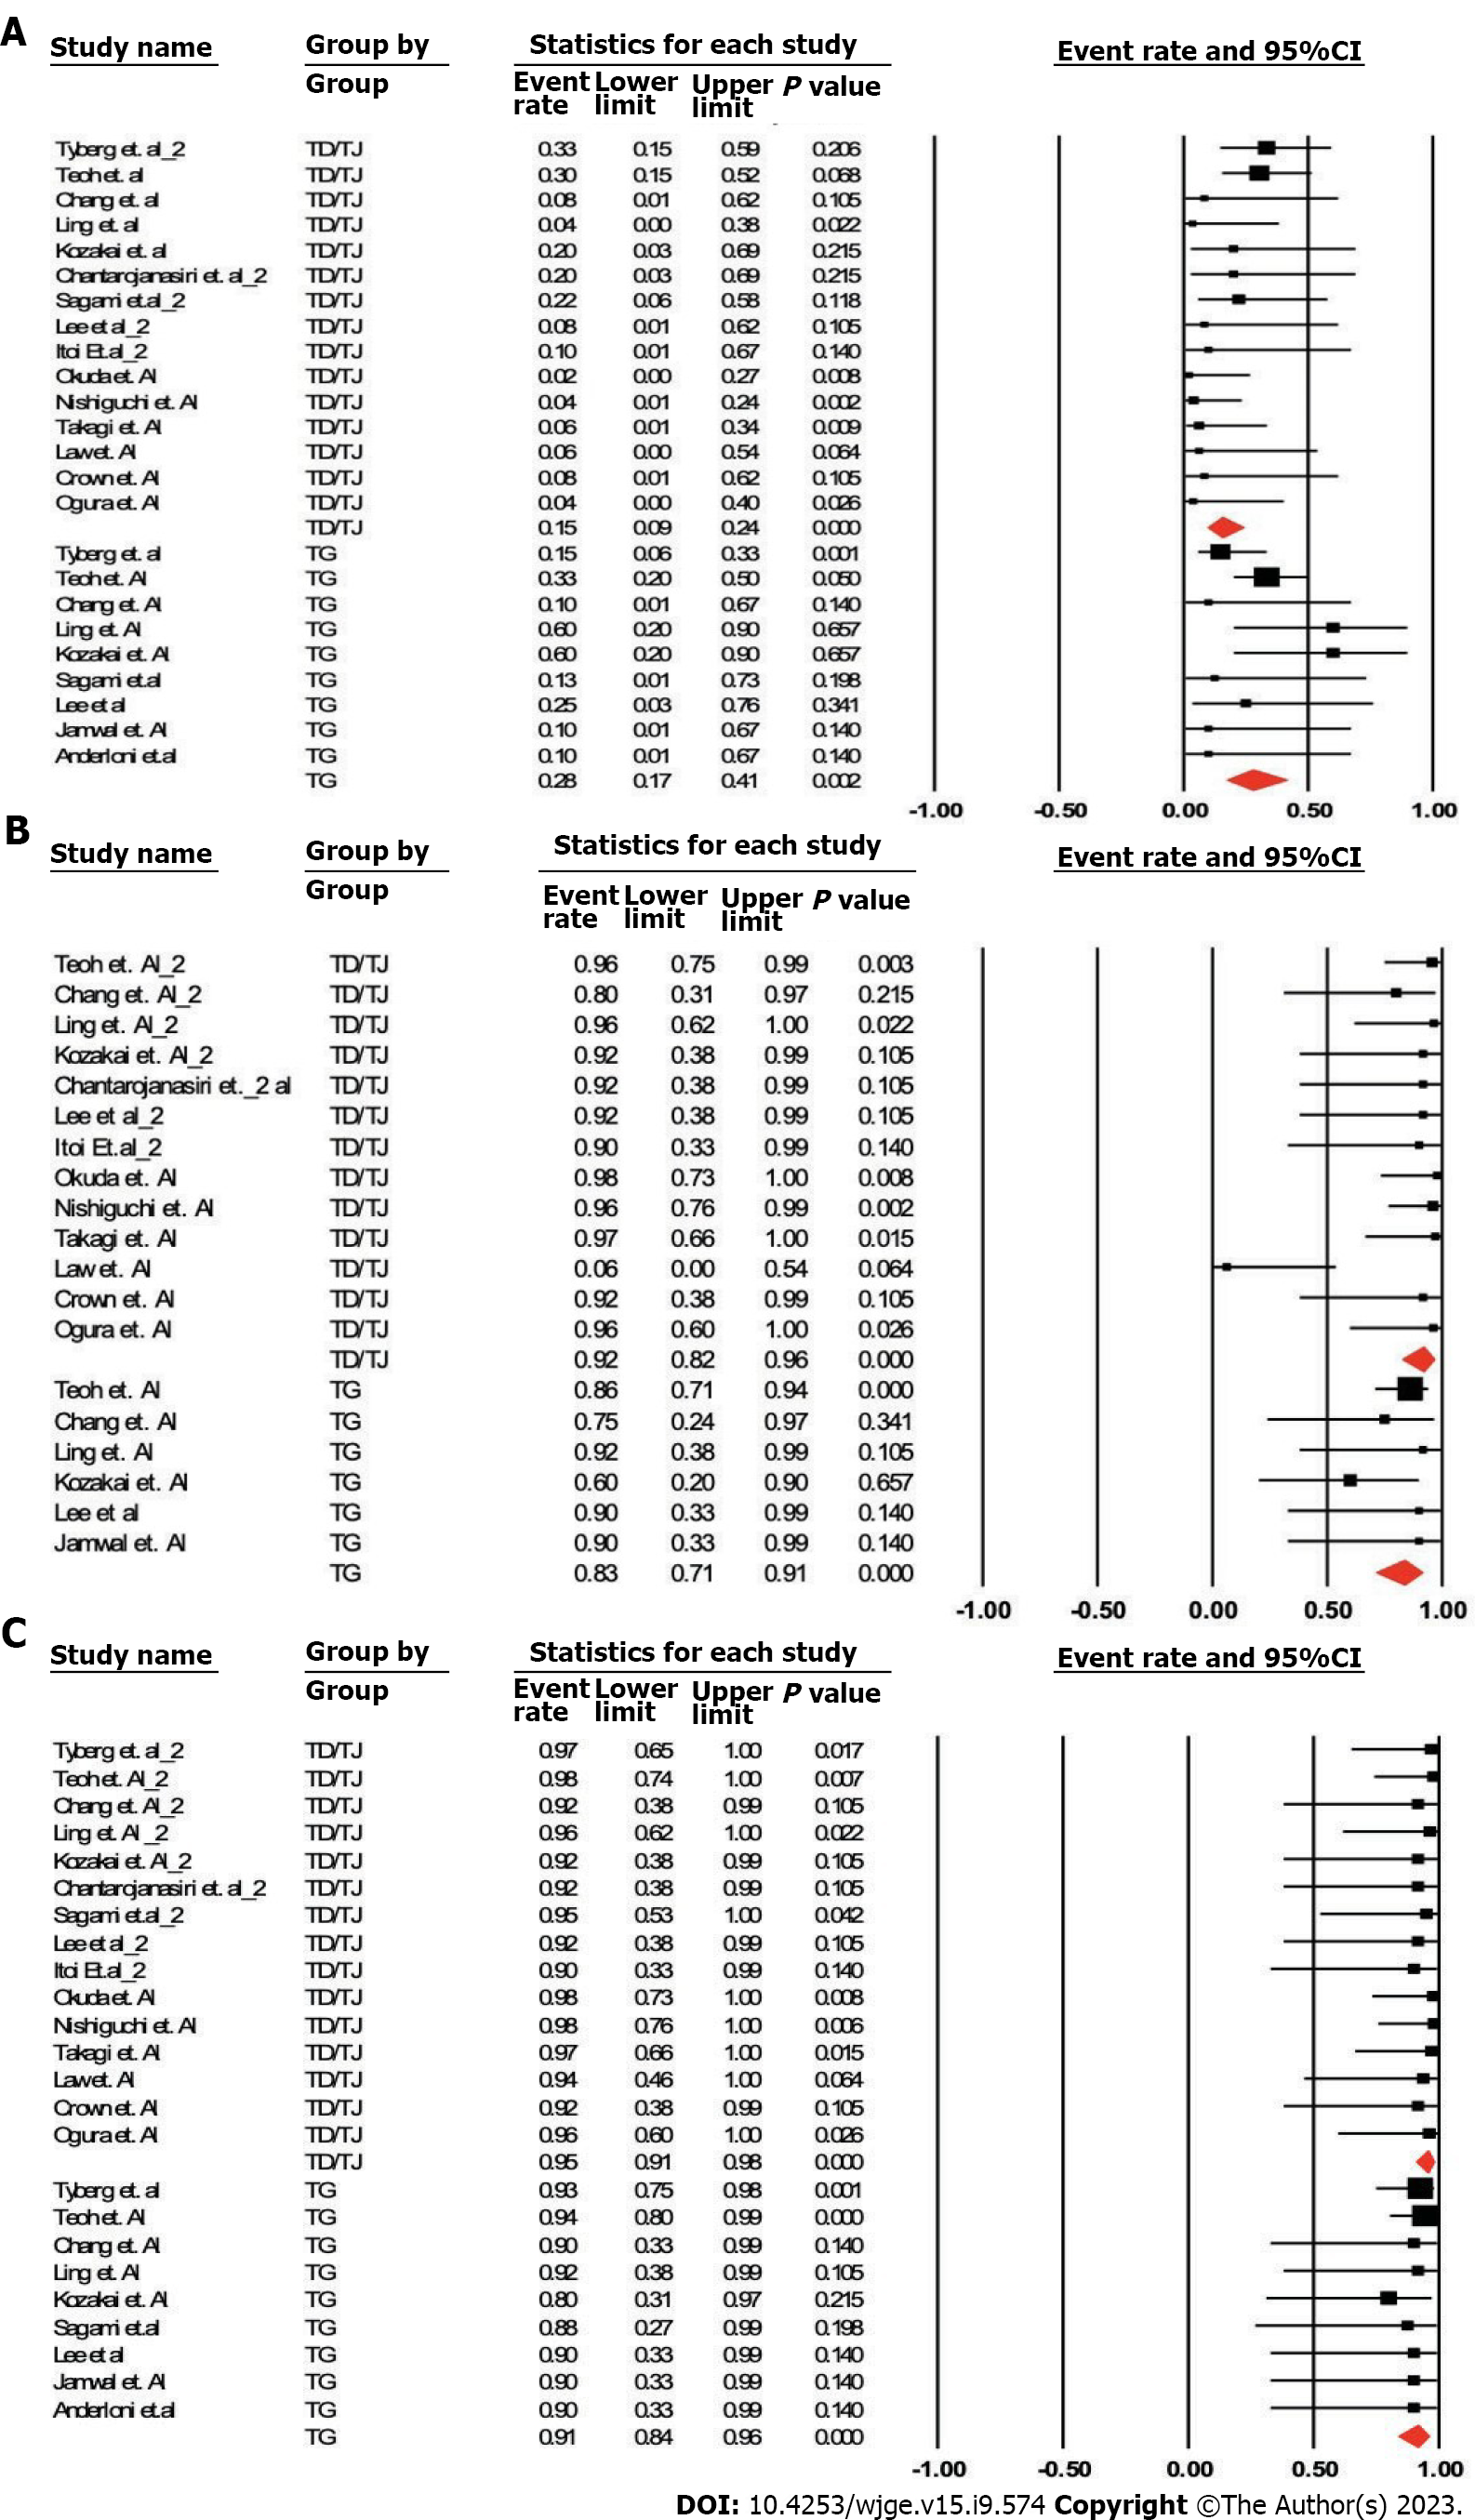
Figure 3 Forrest plot.
A-C: Forrest plot illustrating the comparison of rate of adverse events (A), clinical success (B), and technical success (C) between transduodenal/transjejunal vs transgastric approaches including studies with patients in both arms only (method 1). TG vs TD/TJ: Transduodenal/transjejunal vs transgastric; 95%CI: 95% confidence interval.
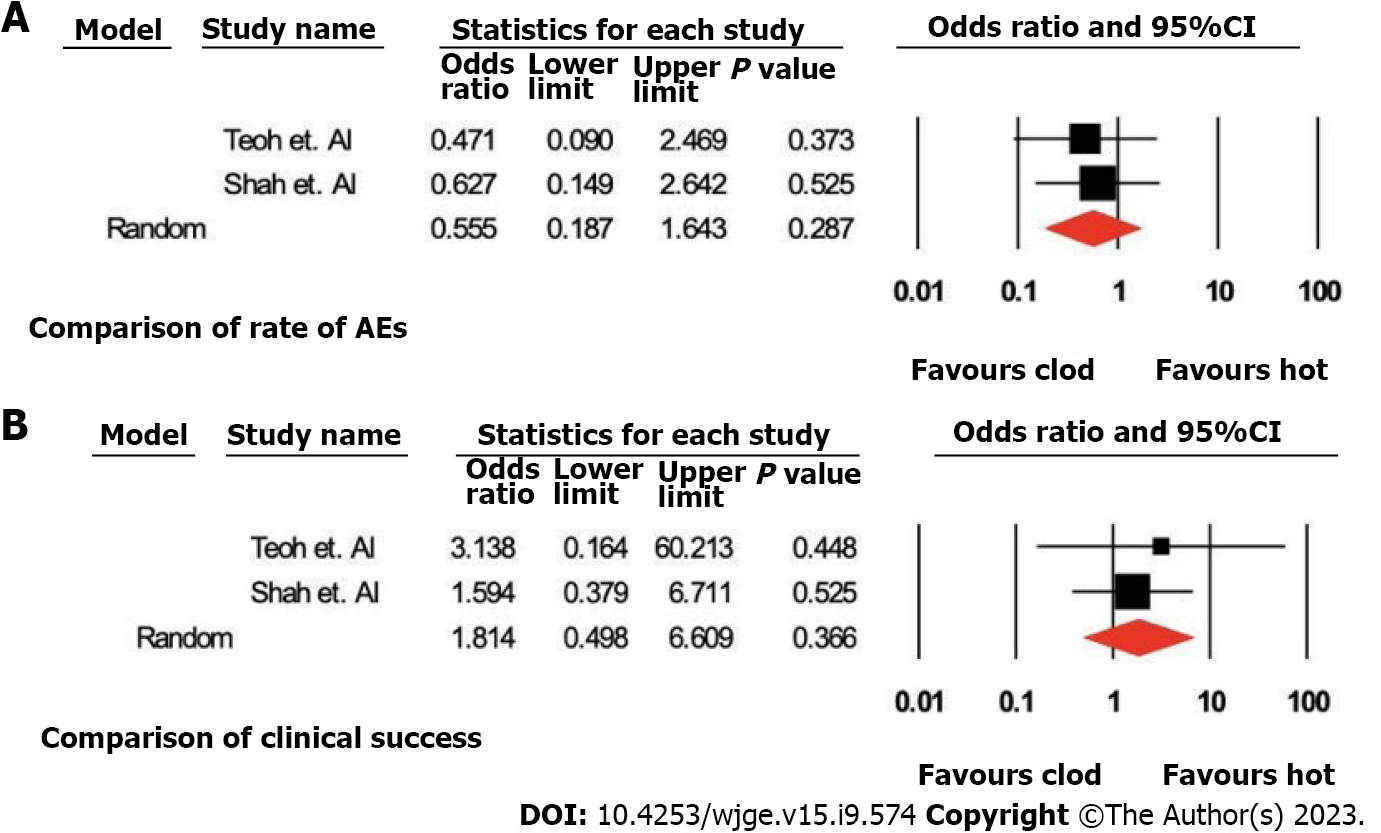
Figure 4 Forrest plot.
A and B: Forrest plot illustrating the comparison of parameters between cautery enhanced (hot) vs non-cautery enhanced (cold) approaches including with studies with patients in both arms only (method 1). AEs: Adverse events; 95%CI: 95% confidence interval.
- Citation: Grover D, Fatima I, Dharan M. Comparison of trans-gastric vs trans-enteric (trans-duodenal or trans-jejunal) endoscopic ultrasound guided gallbladder drainage using lumen apposing metal stents. World J Gastrointest Endosc 2023; 15(9): 574-583
- URL: https://www.wjgnet.com/1948-5190/full/v15/i9/574.htm
- DOI: https://dx.doi.org/10.4253/wjge.v15.i9.574


