Copyright
©The Author(s) 2016.
World J Hepatol. Jun 8, 2016; 8(16): 673-684
Published online Jun 8, 2016. doi: 10.4254/wjh.v8.i16.673
Published online Jun 8, 2016. doi: 10.4254/wjh.v8.i16.673
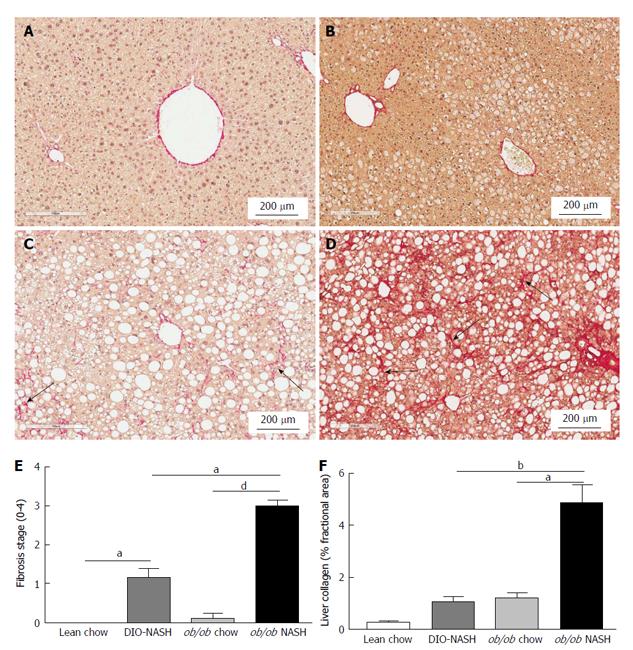
Figure 5 Histological assessment of fibrosis stage and liver collagen at study end.
Representative sirius red stained sections from; lean chow (A), ob/ob chow (B), DIO-NASH (C) and ob/ob NASH (D) mouse model. Liver fibrosis stage performed by a blinded pathologist at study end (E), and quantitatively image analysis of collagen (% area) from sirius red staining using visiomorph software (F). Fibrous band formation indicated by black arrows. aP < 0.05, bP < 0.01, dP < 0.001. The results are presented as mean ± SEM. Lean chow (n = 9), DIO-NASH (n = 12), ob/ob chow (n = 8), ob/ob NASH (n = 10). NASH: Nonalcoholic steatohepatitis; SEM: Standard error of the mean.
- Citation: Kristiansen MNB, Veidal SS, Rigbolt KTG, Tølbøl KS, Roth JD, Jelsing J, Vrang N, Feigh M. Obese diet-induced mouse models of nonalcoholic steatohepatitis-tracking disease by liver biopsy. World J Hepatol 2016; 8(16): 673-684
- URL: https://www.wjgnet.com/1948-5182/full/v8/i16/673.htm
- DOI: https://dx.doi.org/10.4254/wjh.v8.i16.673


