Copyright
©The Author(s) 2017.
World J Hepatol. Dec 8, 2017; 9(34): 1270-1277
Published online Dec 8, 2017. doi: 10.4254/wjh.v9.i34.1270
Published online Dec 8, 2017. doi: 10.4254/wjh.v9.i34.1270
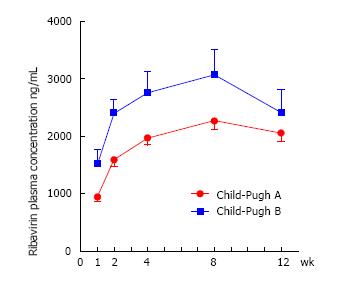
Figure 1 Ribavirin plasma concentrations over the treatment.
Error bars represent standard errors. Ribavirin plasma concentrations statistically differ between Child-Pugh A and B patients at week 1, 2, 4 and 8 (all P value < 0.025). Legend: Child-Pugh B patients display significantly higher ribavirin concentrations (expressed as C trough) compared to Child-Pugh A patients over the first 8 wk of treatment with direct acting antivirals.
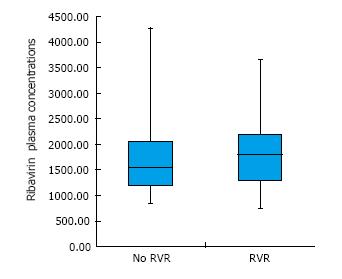
Figure 2 Average of ribavirin plasma concentrations between week 1 and 8 of treatment in association with rapid virological response.
Legend: Achievement of Rapid Virological Response (i.e., hepatitis C virus RNA undetectability within week 4 of treatment) was not associated with ribavirin plasma concentrations measured over the first 8 wk of treatment. RVR: Rapid virological response.
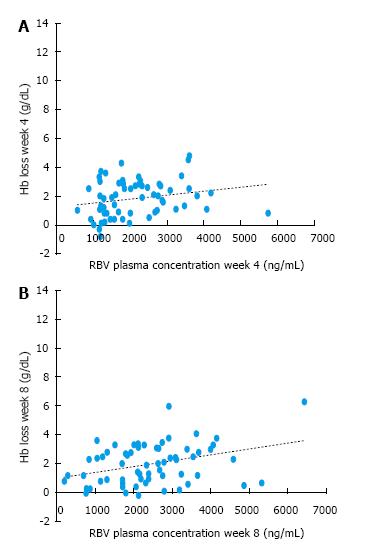
Figure 3 Correlation between ribavirin plasma concentrations and haemoglobin loss at week 4 and 8.
Legend: Higher ribavirin plasma concentrations resulted significantly correlated with greater haemoglobin loss at both week 4 (A) and week 8 (B) of therapy in the overall population. RBV: Ribavirin.
- Citation: Guardigni V, Badia L, Conti M, Rinaldi M, Mancini R, Viale P, Verucchi G. Liver decompensation predicts ribavirin overexposure in hepatitis C virus patients treated with direct-acting antivirals. World J Hepatol 2017; 9(34): 1270-1277
- URL: https://www.wjgnet.com/1948-5182/full/v9/i34/1270.htm
- DOI: https://dx.doi.org/10.4254/wjh.v9.i34.1270


