Copyright
©The Author(s) 2017.
World J Hepatol. Nov 18, 2017; 9(32): 1227-1238
Published online Nov 18, 2017. doi: 10.4254/wjh.v9.i32.1227
Published online Nov 18, 2017. doi: 10.4254/wjh.v9.i32.1227
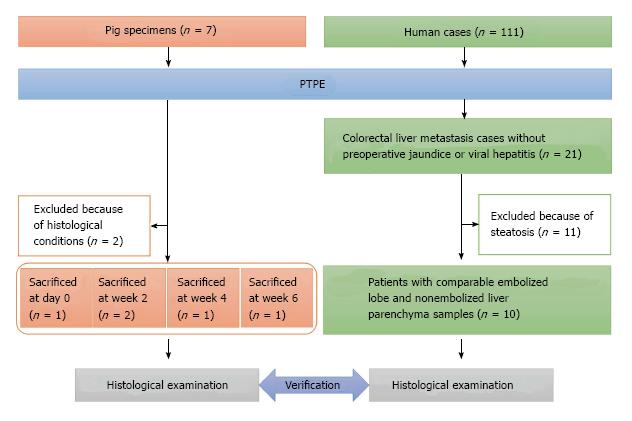
Figure 1 Flow chart of the pig specimens and human cases examined in this study.
PTPE: Percutaneous transhepatic portal vein embolization.
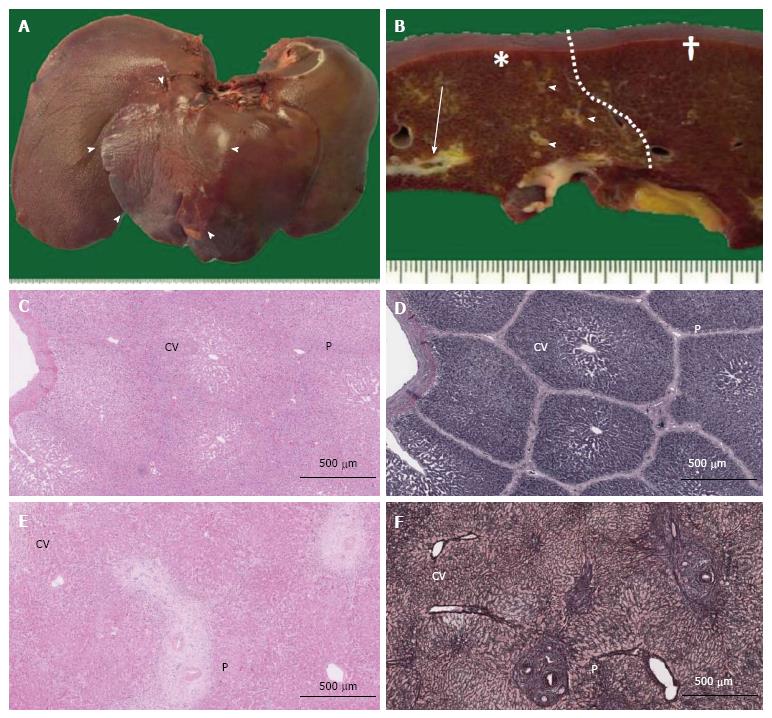
Figure 2 Macroscopic images of pig livers following interruption of portal blood flow and structural comparison of pig and human liver lobules.
A: Liver removed from a pig at week 2 after PTPE. Segmental macroscopic atrophy could be seen (arrowheads); B: Portal thrombosis was observed at the cut surface (arrow) in the embolized area (*), and fibrous thickening of the portal areas was observed (arrowheads) compared with nonembolized area (†). A clear border (dotted line) was observed between these areas; C-F: Microscopic views (C, D: Pig; E, F: Human) show central veins (CV) and portal areas (P) in HE-stained sections (C, E), but these features are more clearly observed in silver-stained sections (D, F). Lobule structure was less well defined in human specimens (F).
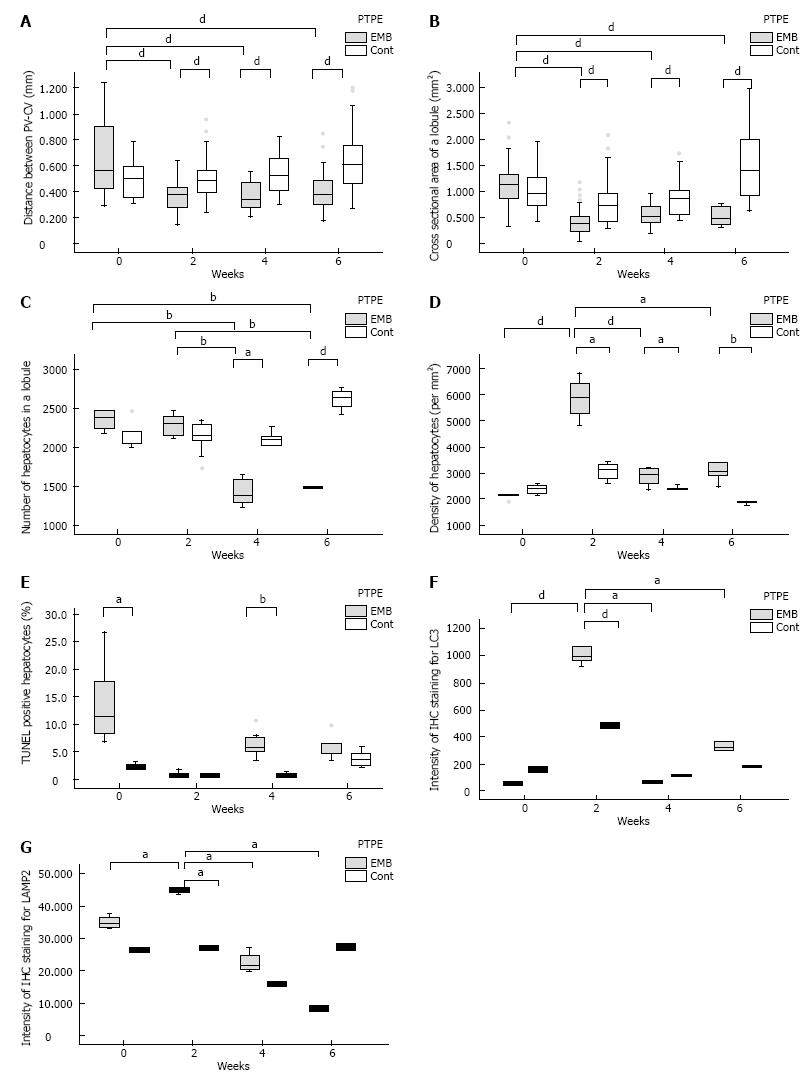
Figure 3 Histological changes in pig livers following the interruption of portal blood flow.
A and B: The distance between the portal vein and central vein (A) and the cross sectional area of the lobule (B) of the embolized segment at week 2 after PTPE differed significantly from those of controls; C and D: The number of hepatocytes per lobule (C) of the embolized segment was significantly lower than in control lobes at week 4, and the density of hepatocytes (D) in the embolized area at week 2 was highest; E-G: The fraction of TUNEL-positive hepatocytes (E) in the embolized segment was significantly higher than in control segments at week 4, and the LC3 (F) and LAMP2 (G) intensity was highest in embolized lobes at week 2. aP ≤ 0.05, bP ≤ 0.01, dP ≤ 0.001. EMB: Embolized area; Cont: Control lobe area.
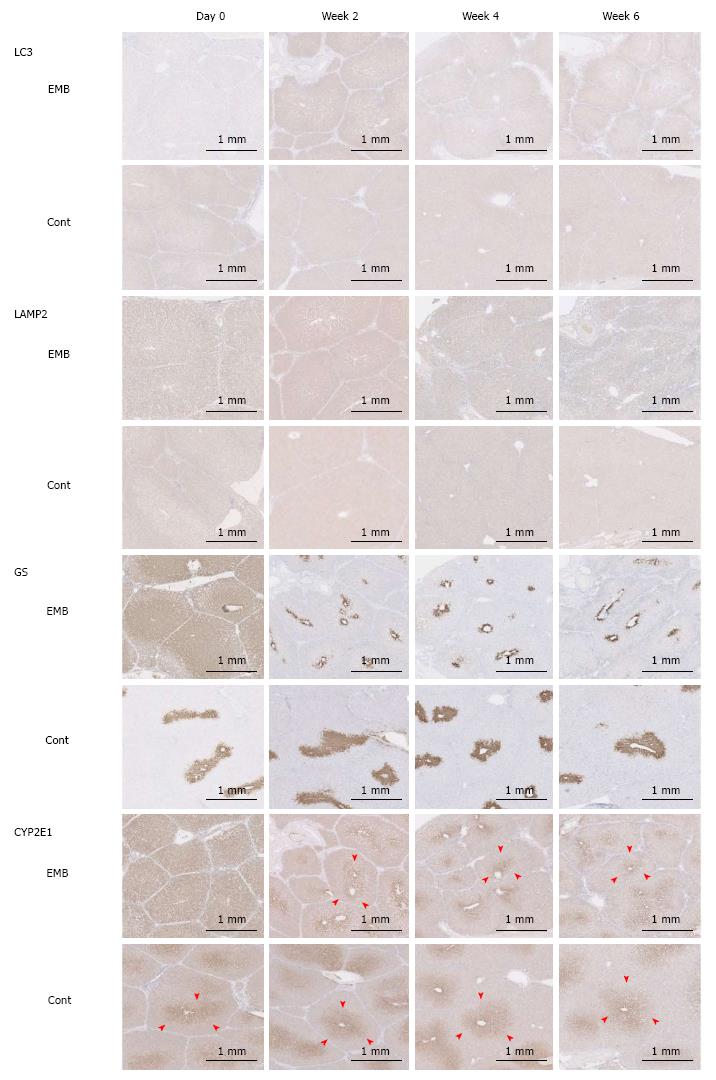
Figure 4 Light chain 3, lysosomal-associated membrane protein 2, glutamine synthetase, and cytochrome P450 2E1 immunohistochemical staining intensities.
Expression of LC3 and LAMP2 was highest in the embolized segment of porcine specimens at 2 wk after PTPE. Zonation of GS and CYP2E1 (arrowheads) was expanded in the embolized area immediately after interruption of portal blood flow, but was reduced in the embolized lobe at 2 wk. EMB: Embolized area; Cont: Control lobe area; LC3: Light chain 3; LAMP2: Lysosomal-associated membrane protein 2; GS: Glutamine synthetase; CYP2E1: Cytochrome P450 2E1; IHC: Immunohistochemical.
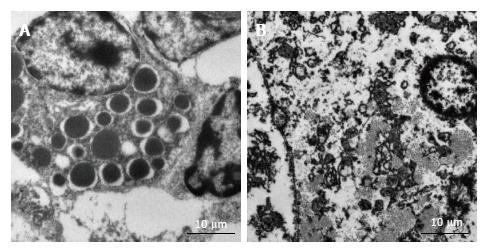
Figure 5 Electron microscopic findings at week 2.
A and B: Many more autophagic vacuoles were found in embolized samples (A) compared with control samples (B) at week 2.
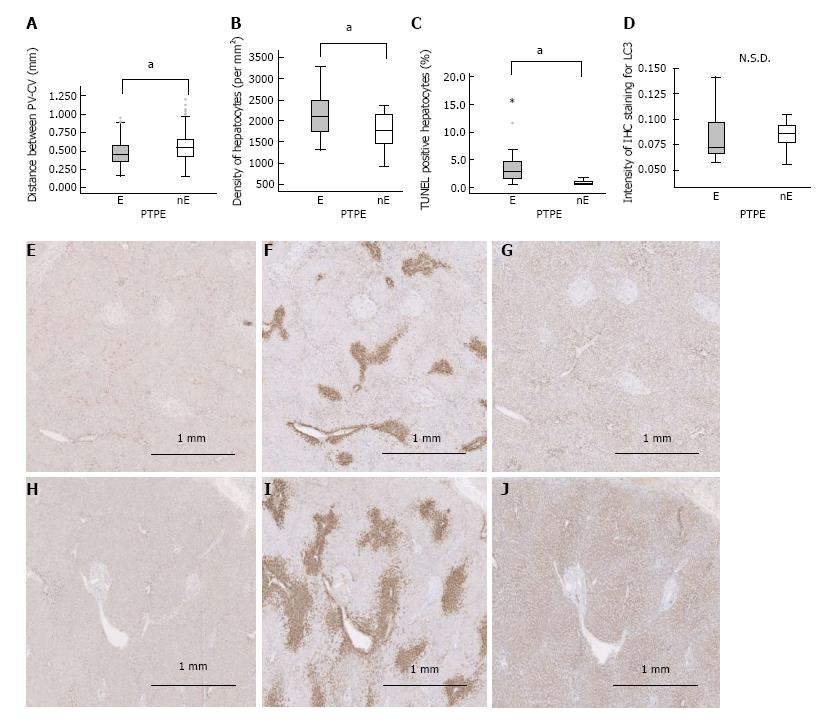
Figure 6 Human specimens.
A: The distance between the portal vein and central vein; B: Hepatocyte density; C: Fraction of TUNEL-positive hepatocytes differed significantly between embolized and nonembolized lobes; D: Intensity of IHC staining for LC3; E-J: IHC for LC3 (E, H), GS (F, I), and CYP2E1 (G, J). LC3 expression did not differ significantly (D) between the embolized (E) and the nonembolized area (H), but the zonation of GS and CYP2E1 was narrower in the embolized lobe (F, G) than the nonembolized lobe (I, J). aP ≤ 0.001. N.S.D: No significant difference; E: Embolized area; nE: Nonembolized area.
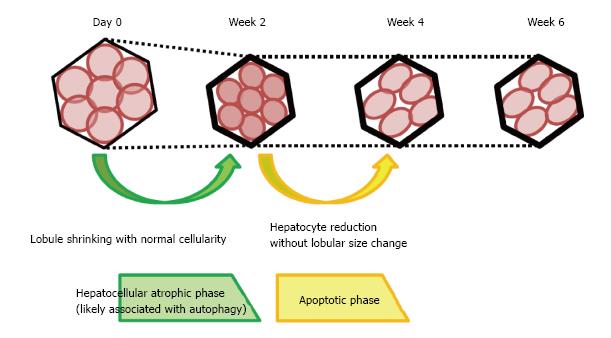
Figure 7 Schema of the histological changes occurring following interruption of portal blood flow.
At 2 wk after obstruction of the portal vein, lobular shrinkage was observed without reduction in hepatocyte number, but with strong LC3 and LAMP2 expression. These changes may be associated with autophagy, and this process is termed the hepatocellular atrophic phase. At week 4, hepatocyte numbers fell, without a reduction in lobule size, but with an elevation of TUNEL staining. These secondary changes may be attributed to apoptosis occurring after autophagy, characterizing the hepatocellular atrophic phase. No significant histological changes were observed at week 6 compared with week 4.
- Citation: Iwao Y, Ojima H, Kobayashi T, Kishi Y, Nara S, Esaki M, Shimada K, Hiraoka N, Tanabe M, Kanai Y. Liver atrophy after percutaneous transhepatic portal embolization occurs in two histological phases: Hepatocellular atrophy followed by apoptosis. World J Hepatol 2017; 9(32): 1227-1238
- URL: https://www.wjgnet.com/1948-5182/full/v9/i32/1227.htm
- DOI: https://dx.doi.org/10.4254/wjh.v9.i32.1227


