Copyright
©The Author(s) 2017.
World J Hepatol. Nov 18, 2017; 9(32): 1227-1238
Published online Nov 18, 2017. doi: 10.4254/wjh.v9.i32.1227
Published online Nov 18, 2017. doi: 10.4254/wjh.v9.i32.1227
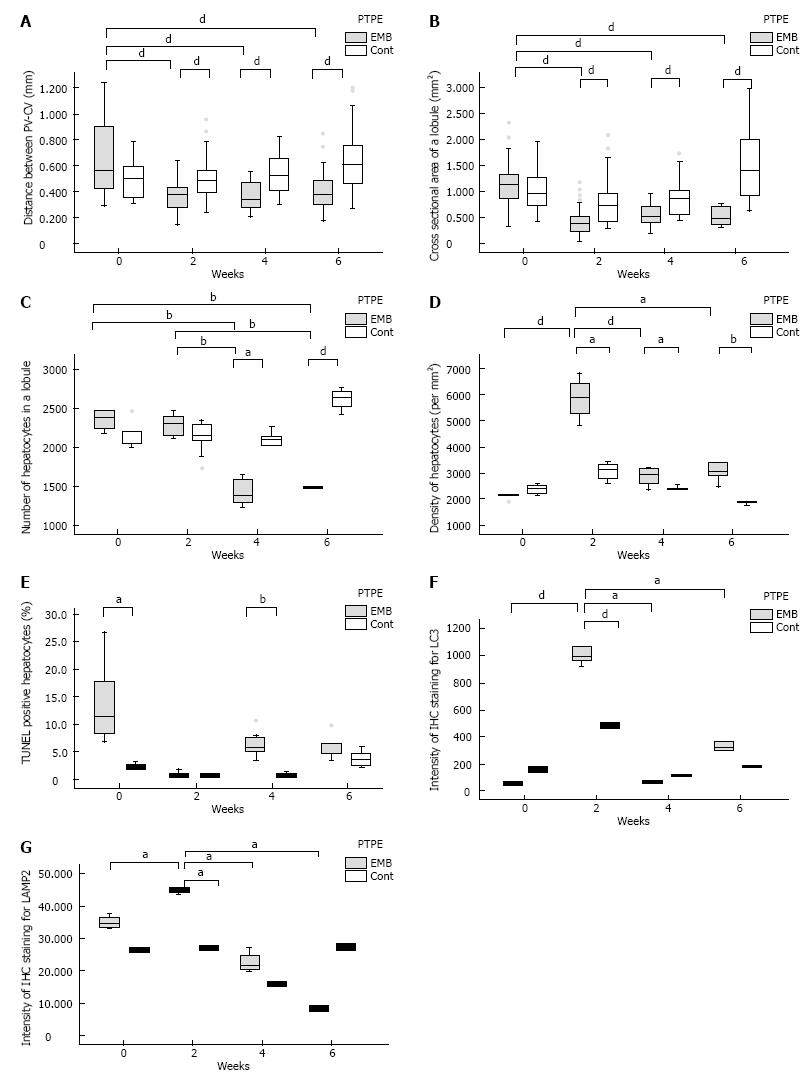
Figure 3 Histological changes in pig livers following the interruption of portal blood flow.
A and B: The distance between the portal vein and central vein (A) and the cross sectional area of the lobule (B) of the embolized segment at week 2 after PTPE differed significantly from those of controls; C and D: The number of hepatocytes per lobule (C) of the embolized segment was significantly lower than in control lobes at week 4, and the density of hepatocytes (D) in the embolized area at week 2 was highest; E-G: The fraction of TUNEL-positive hepatocytes (E) in the embolized segment was significantly higher than in control segments at week 4, and the LC3 (F) and LAMP2 (G) intensity was highest in embolized lobes at week 2. aP ≤ 0.05, bP ≤ 0.01, dP ≤ 0.001. EMB: Embolized area; Cont: Control lobe area.
- Citation: Iwao Y, Ojima H, Kobayashi T, Kishi Y, Nara S, Esaki M, Shimada K, Hiraoka N, Tanabe M, Kanai Y. Liver atrophy after percutaneous transhepatic portal embolization occurs in two histological phases: Hepatocellular atrophy followed by apoptosis. World J Hepatol 2017; 9(32): 1227-1238
- URL: https://www.wjgnet.com/1948-5182/full/v9/i32/1227.htm
- DOI: https://dx.doi.org/10.4254/wjh.v9.i32.1227


