Copyright
©The Author(s) 2017.
World J Hepatol. Jan 28, 2017; 9(3): 155-160
Published online Jan 28, 2017. doi: 10.4254/wjh.v9.i3.155
Published online Jan 28, 2017. doi: 10.4254/wjh.v9.i3.155
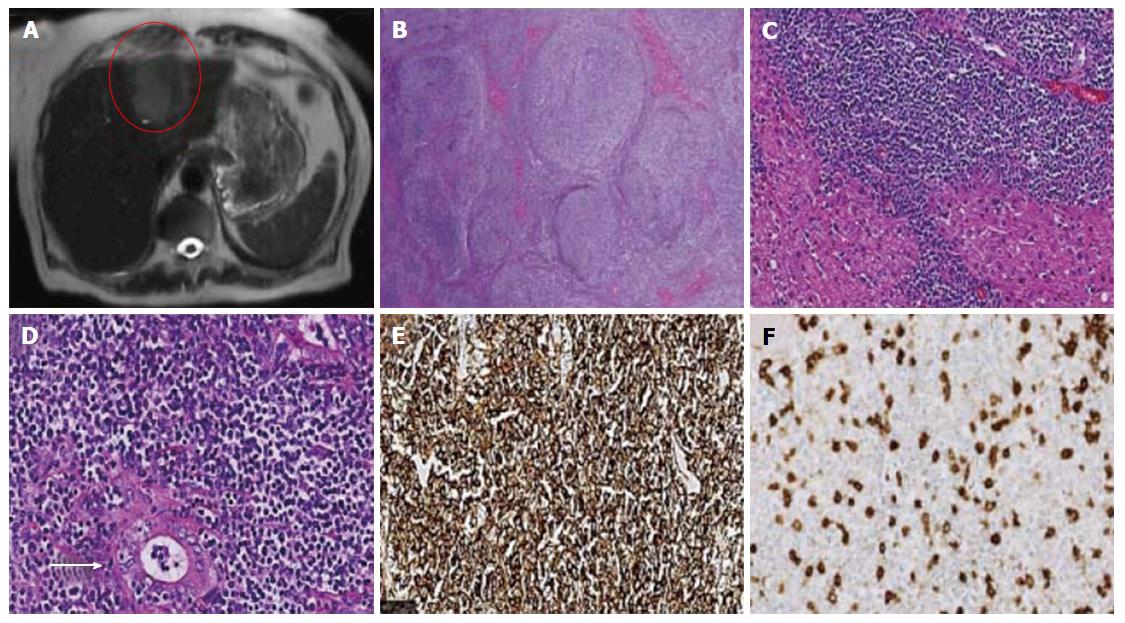
Figure 1 Abdominal computed tomography scan and histology of the mass.
A: Computed tomography of the abdomen reveals a large mass, highlighted in red, in the left lobe; B: Effacement of normal liver by nodules of atypical lymphocytes [hematoxylin-eosin (H and E), 2.5 ×]; C: Hepatocytes are admixed with neoplastic lymphocytes (H and E, 20 ×); D: Lymphoma cells infiltrate into the bile duct forming lymphoepithelial lesions (arrows) (H and E, 40 ×); E, F: By immunohistochemistry, the neoplastic cells are positive for CD20 (E) and negative for CD5 (F) (40 ×, each).
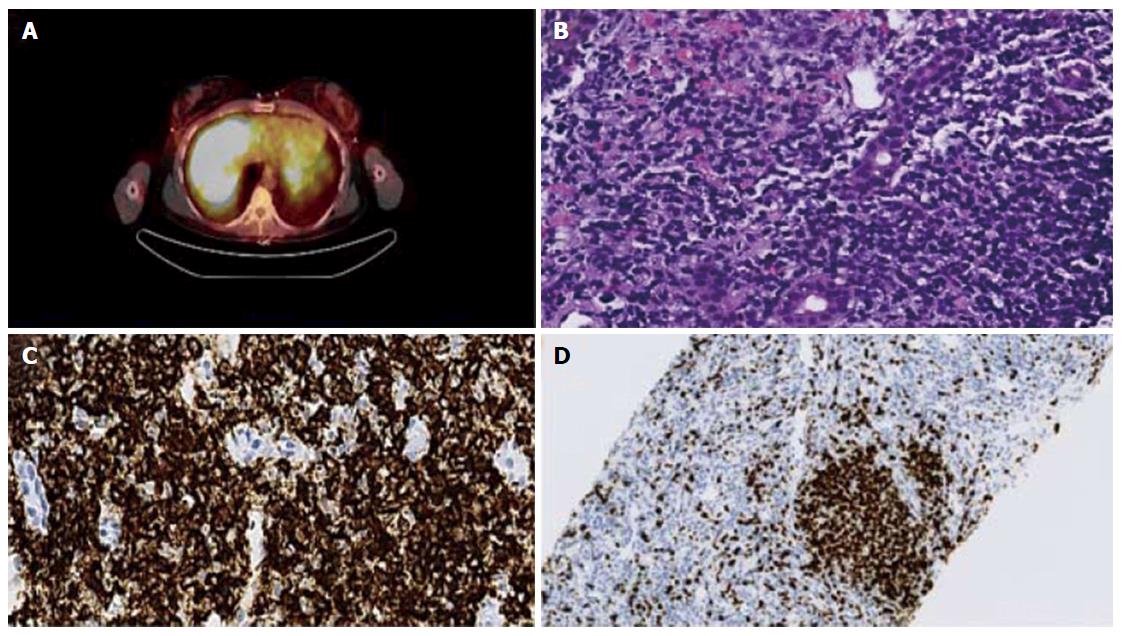
Figure 2 Positron emission tomography-computed tomography and histology of the liver mass.
A: Liver shows diffuse fluorodeoxyglucose activity throughout the parenchyma with the maximum standardized uptake value of 8.6; B: The atypical lymphocytes grow diffusely forming mass with occasional lymphoepithelial lesions (40 ×); C, D: By immunohistochemistry, the neoplastic lymphocytes are positive for CD20 (C, 40 ×) and have low MIB-1 proliferative index (D, 40 ×).
- Citation: Obiorah IE, Johnson L, Ozdemirli M. Primary mucosa-associated lymphoid tissue lymphoma of the liver: A report of two cases and review of the literature. World J Hepatol 2017; 9(3): 155-160
- URL: https://www.wjgnet.com/1948-5182/full/v9/i3/155.htm
- DOI: https://dx.doi.org/10.4254/wjh.v9.i3.155


