Copyright
©The Author(s) 2017.
World J Hepatol. Apr 28, 2017; 9(12): 603-612
Published online Apr 28, 2017. doi: 10.4254/wjh.v9.i12.603
Published online Apr 28, 2017. doi: 10.4254/wjh.v9.i12.603
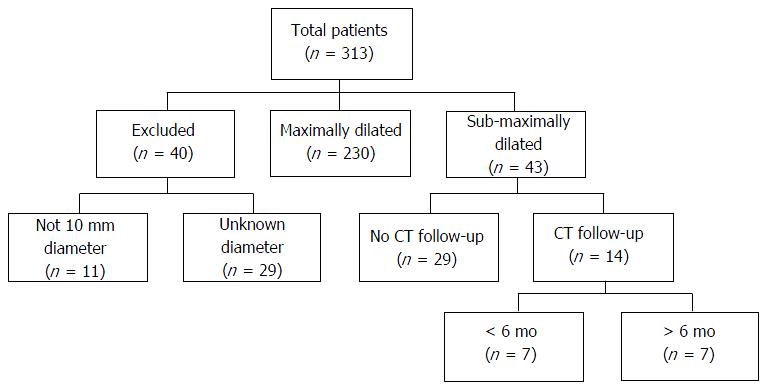
Figure 1 Patient selection.
CT: Computed tomography.
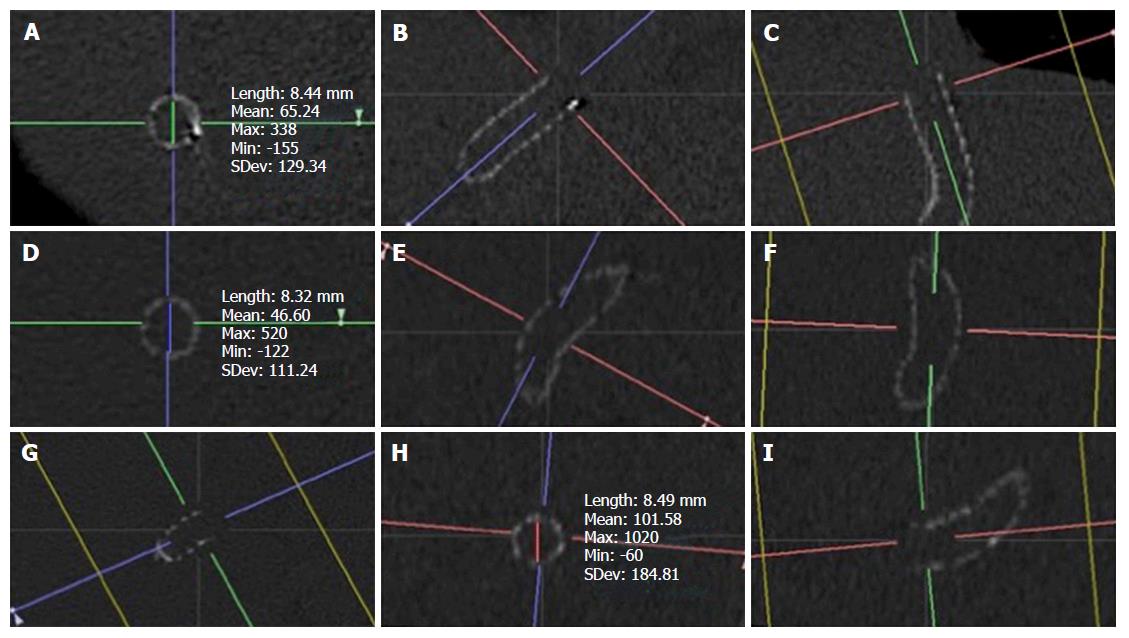
Figure 2 TeraRecon measurement of transjugular intrahepatic portosystemic shunt stent at hepatic venous end, mid-stent, and portal venous end.
A: Axial image at the hepatic venous end with cross-sectional diameter; B: Coronal image at the hepatic venous end with orthogonal plane designation; C: Sagittal image at the hepatic venous end with orthogonal plane designation; D: Axial image at mid-stent with cross-sectional diameter; E: Coronal image at mid-stent with orthogonal plane designation; F: Sagittal image at mid-stent with orthogonal plane designation; G: Axial image at the portal venous end with orthogonal plane designation; H: Coronal image at the portal venous end with cross-sectional diameter; I: Sagittal image at the portal venous end with orthogonal plane designation.
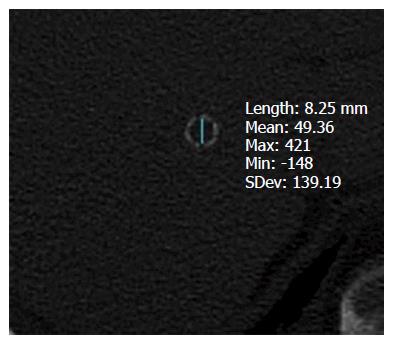
Figure 3 Mid-stent measurement of sub-maximally dilated transjugular intrahepatic portosystemic shunt 103 d (< 6 mo) following creation.
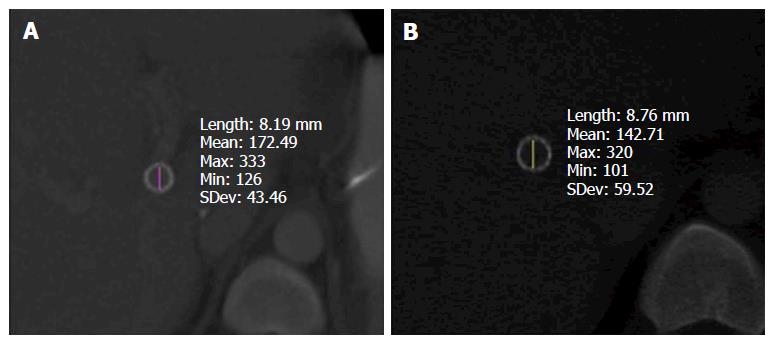
Figure 4 Mid-stent measurement of sub-maximally dilated transjugular intrahepatic portosystemic shunt (A) 182 d and (B) 573 d following creation (> 6 mo) in the same patient.
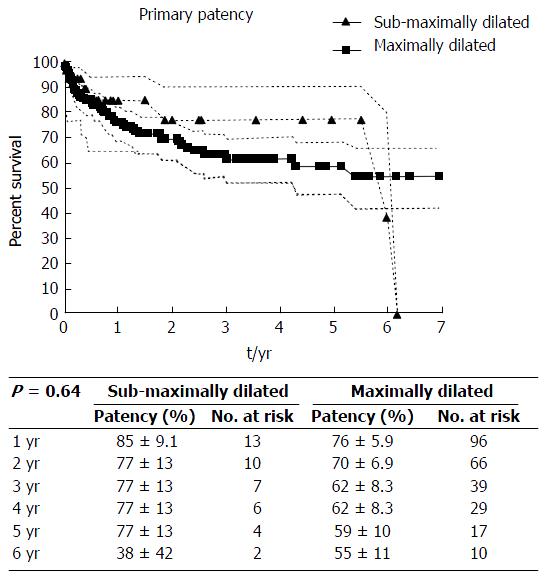
Figure 5 Primary patency rates of sub-maximally dilated (8 mm) vs maximally dilated (10 mm) transjugular intrahepatic portosystemic shunt.
On Kaplan-Meier analysis, yearly patency rates through 6 years of follow-up after transjugular intrahepatic portosystemic shunt creation are demonstrated with 95%CI and number at risk.
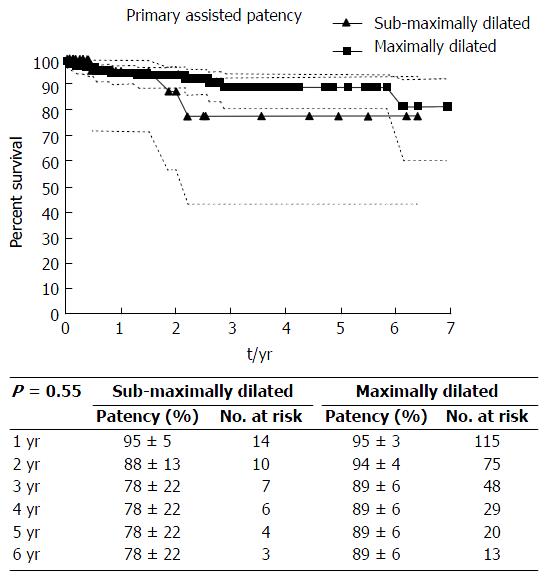
Figure 6 Primary assisted patency rates of sub-maximally dilated (8 mm) vs maximally dilated (10 mm) transjugular intrahepatic portosystemic shunt.
On Kaplan-Meier analysis, yearly patency rates through 6 years of follow-up after transjugular intrahepatic portosystemic shunt creation are demonstrated with 95%CI and number at risk.
- Citation: Hsu MC, Weber CN, Stavropoulos SW, Clark TW, Trerotola SO, Shlansky-Goldberg RD, Soulen MC, Nadolski GJ. Passive expansion of sub-maximally dilated transjugular intrahepatic portosystemic shunts and assessment of clinical outcomes. World J Hepatol 2017; 9(12): 603-612
- URL: https://www.wjgnet.com/1948-5182/full/v9/i12/603.htm
- DOI: https://dx.doi.org/10.4254/wjh.v9.i12.603


