Copyright
©The Author(s) 2017.
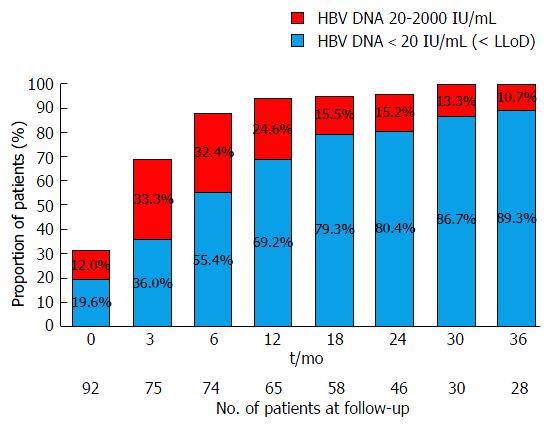
Figure 1 Complete virological suppression and partial virological suppression at on treatment time points.
The proportion of patients who achieve complete virological suppression (HBV DNA < 20 IU/mL) or partial virological suppression (HBV DNA 20-2000 IU/mL) while on tenofovir therapy. The number of patients followed up at each time point is recorded below the Time axis. HBV: Hepatitis B virus.
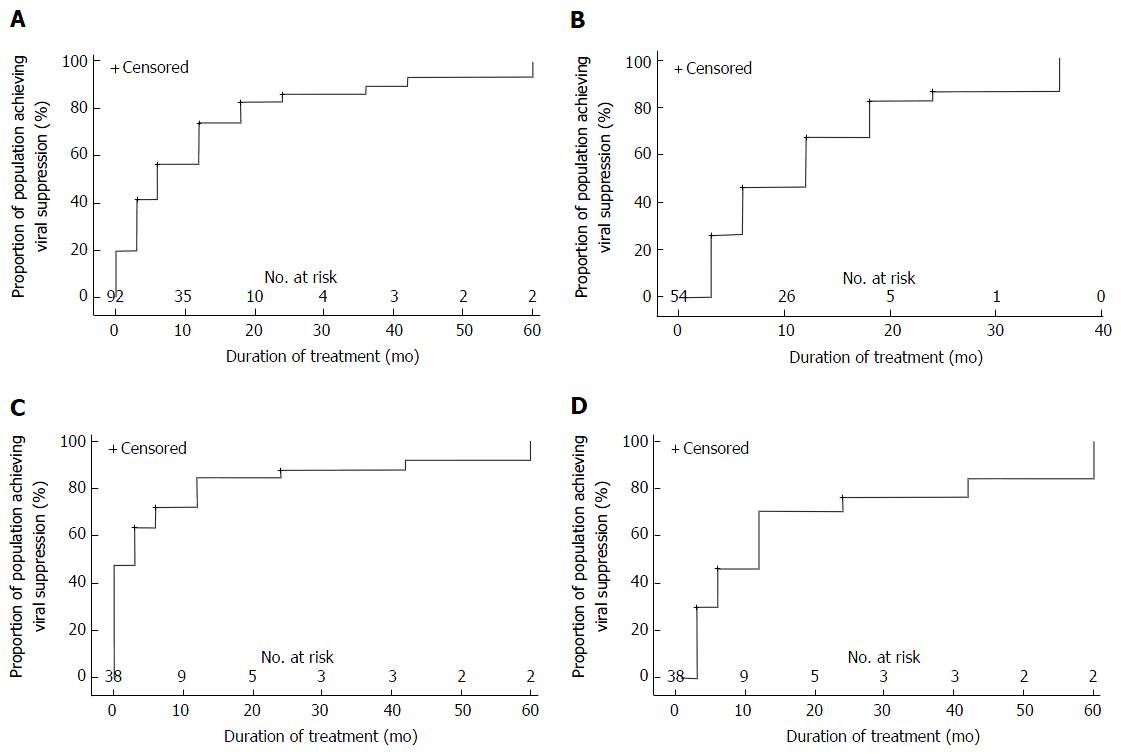
Figure 2 Survival analysis of the influence of treatment experience on complete virological suppression.
A: Time to virological suppression according to duration of treatment, n = 92; B: Amongst treatment naïve patients n = 54; C: Treatment experienced patients, n = 37; D: Treatment experienced viraemic patients, n = 20. Number at risk describes the number of target group patients captured at each time period.
- Citation: Lovett GC, Nguyen T, Iser DM, Holmes JA, Chen R, Demediuk B, Shaw G, Bell SJ, Desmond PV, Thompson AJ. Efficacy and safety of tenofovir in chronic hepatitis B: Australian real world experience. World J Hepatol 2017; 9(1): 48-56
- URL: https://www.wjgnet.com/1948-5182/full/v9/i1/48.htm
- DOI: https://dx.doi.org/10.4254/wjh.v9.i1.48


