Copyright
©The Author(s) 2015.
World J Hepatol. Jun 28, 2015; 7(12): 1632-1651
Published online Jun 28, 2015. doi: 10.4254/wjh.v7.i12.1632
Published online Jun 28, 2015. doi: 10.4254/wjh.v7.i12.1632
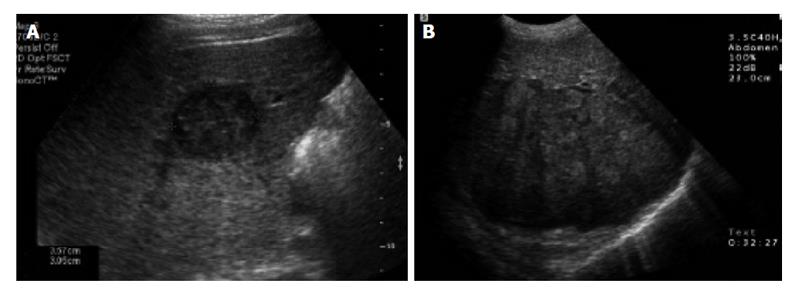
Figure 1 Abdominal ultrasound of the liver.
A: Transverse sonogram shows a small, 3 cm, hypoechoic mass in the right lobe of the liver; B: Transverse sonogram shows a heterogeneous large mass in the right lobe of the liver[47].
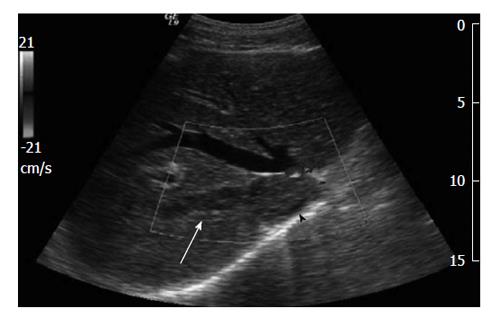
Figure 2 Doppler abdominal ultrasound shows the disappearance of Doppler flow in the intrahepatic segment of the inferior vena cava (arrowhead) and the right hepatic vein[38].
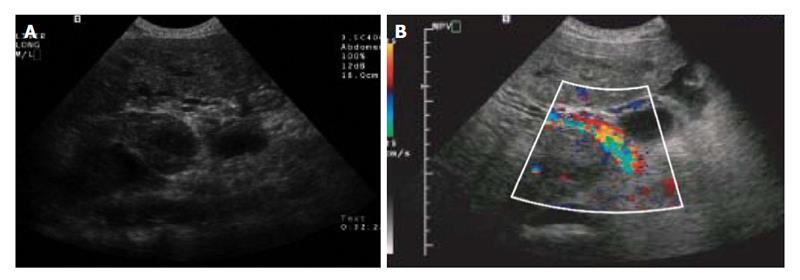
Figure 3 Colour Doppler ultrasound of the liver.
A: Transverse sonogram shows portal vein thrombus; B: Transverse colour Doppler sonogram of the right upper quadrant shows heterogeneous flow within the tumour thrombus[47].
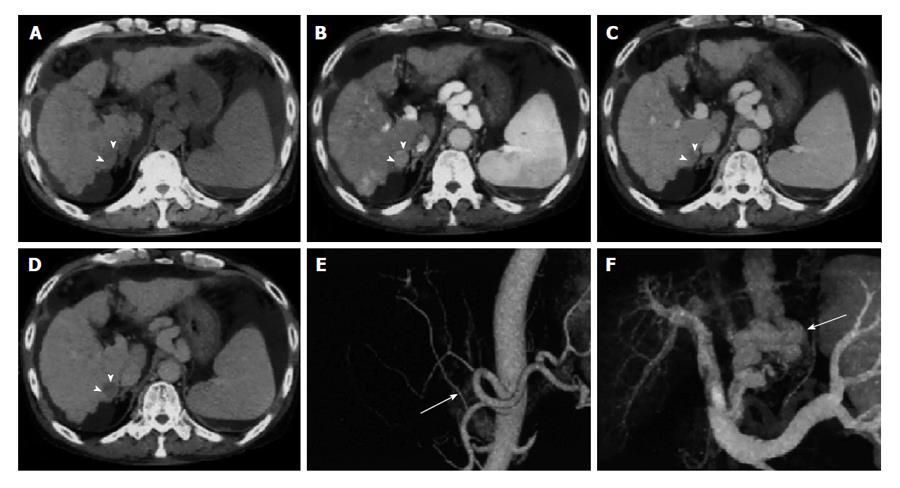
Figure 4 Multi-detector computed tomography of hepatocellular carcinoma.
A: Pre-contrast; B: Late arterial phase; C: Portal venous phase; D: Equilibrium phase dynamic multi-detector computed tomography images. The hepatocellular carcinoma (arrowheads) is visualised as an enhanced nodule in the late arterial phase and as a hypo-attenuated nodule in the equilibrium phase; E: Three-dimensional computed tomography angiography of hepatic arteries shows that the right hepatic artery branches (arrow in E) from the superior mesenteric artery; F: The portal venous system with creation of varices (arrow)[66].
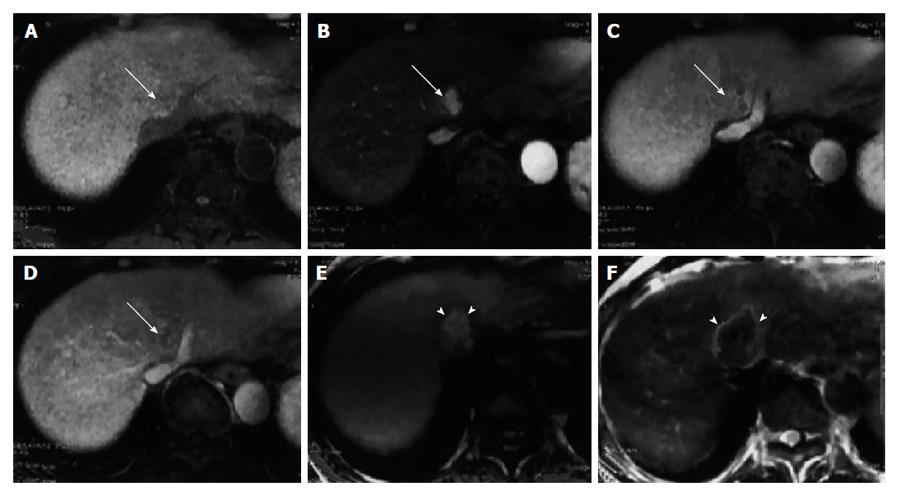
Figure 5 Dynamic magnetic resonance imaging of hepatocellular carcinoma.
A: Precontrast; B: Arterial phase; C: Portal venous phase; D: Equilibrium phase; dynamic magnetic resonance imaging obtained with the LAVA sequence prior to therapeutic treatment. The hepatocellular carcinoma (HCC) (arrow) is seen adjacent to the hepatic vein as an enhanced nodule in the late arterial phase and as hypo-attenuated nodule in the portal venous and equilibrium phases; E: T1-weighted gradient echo image; F: Spin echo T2-weighted image two days after radiofrequency ablation therapy for HCC. The completely ablated area shows as hyperintense on T1-weighted images and as hypointense on T2–weighted images (arrowheads)[66].
Figure 6 Hepatic angiography.
Typical hyper-vascular pattern, corresponding to the findings of enhanced Doppler study, is clearly demonstrated by angiography[77].
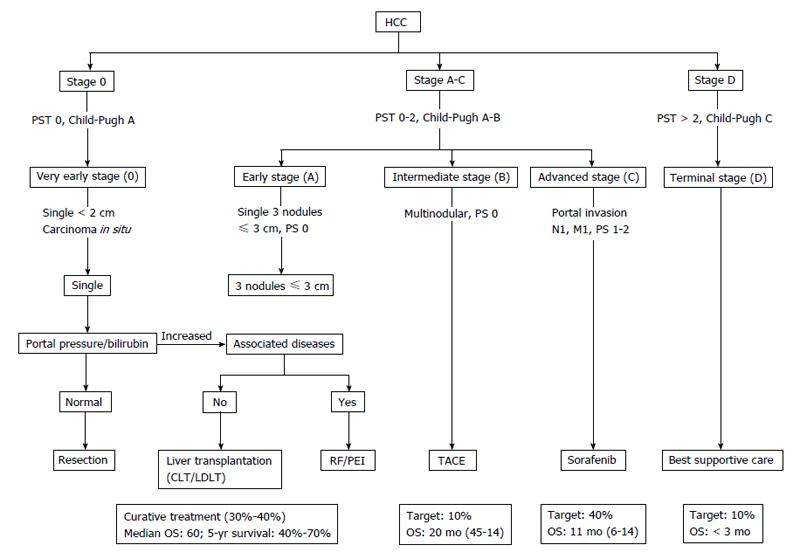
Figure 7 Updated Barcelona Clinic Liver Cancer staging system and treatment strategy, 2011[10].
The BCLC algorithm classifies HCC into five stages-based on the extent of disease, Child-Pugh score, and ECOG performance status-that enables prognostication and informs allocation of first-line treatment. BCLC: Barcelona Clinic Liver Cancer (group); HCC: Hepatocellular carcinoma; PST: Performance status test; TACE: Transarterial chemoembolization; RF: Radiofrequency; PEI: Percutaneous ethanol infusion; CLT: Cadaveric liver transplant; LDLT: Living donor liver transplant.
- Citation: Attwa MH, El-Etreby SA. Guide for diagnosis and treatment of hepatocellular carcinoma. World J Hepatol 2015; 7(12): 1632-1651
- URL: https://www.wjgnet.com/1948-5182/full/v7/i12/1632.htm
- DOI: https://dx.doi.org/10.4254/wjh.v7.i12.1632


