Copyright
©2013 Baishideng Publishing Group Co.
World J Hepatol. Apr 27, 2013; 5(4): 206-213
Published online Apr 27, 2013. doi: 10.4254/wjh.v5.i4.206
Published online Apr 27, 2013. doi: 10.4254/wjh.v5.i4.206
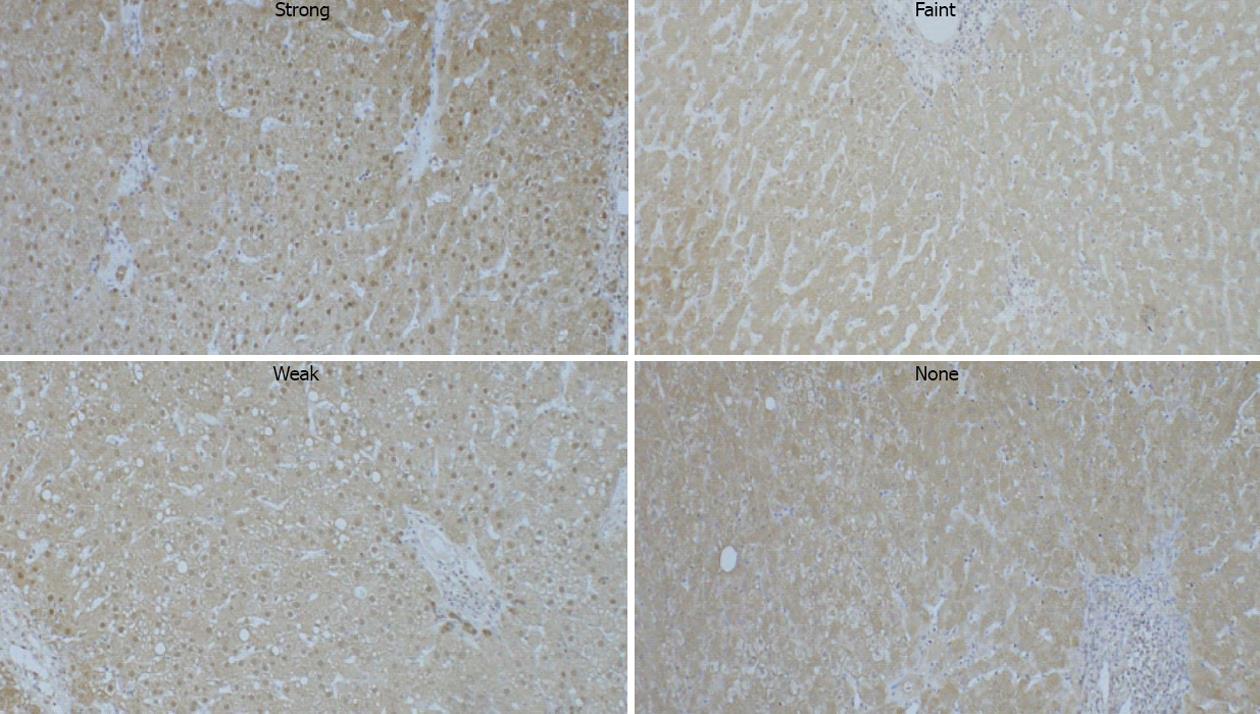
Figure 1 Immunohistochemical detection of hepatic apurinic/apyrimidinic endonuclease 1 protein in patients with chronic liver disease.
The intensity of hepatocytic nuclear apurinic/apyrimidinic endonuclease 1 immunoreactivity was classified into four grades.
Figure 2 Quantitation of hepatocyte nuclear apurinic/apyrimidinic endonuclease 1 protein immunostaining.
A: The percentage of positive hepatocellular nuclei throughout the slide was consistently 80%-100%, regardless of the etiology of chronic liver disease, while the staining intensity was lower in hepatitis B virus (HBV) group than in hepatitis C virus (HCV), autoimmune hepatitis (AIH)/primary biliary cirrhosis (PBC) and normal groups (aP < 0.05 vs HCV, dP < 0.01 vs AIH/PBC, eP < 0.05 vs normal); B: The staining intensity of hepatocytic nuclear apurinic/apyrimidinic endonuclease 1 (APE-1) protein was positively correlated with serum alanine aminotransferase (ALT) levels in the HBV (r = 0.42, P < 0.05) and HCV groups (r = 0.38, P < 0.05).
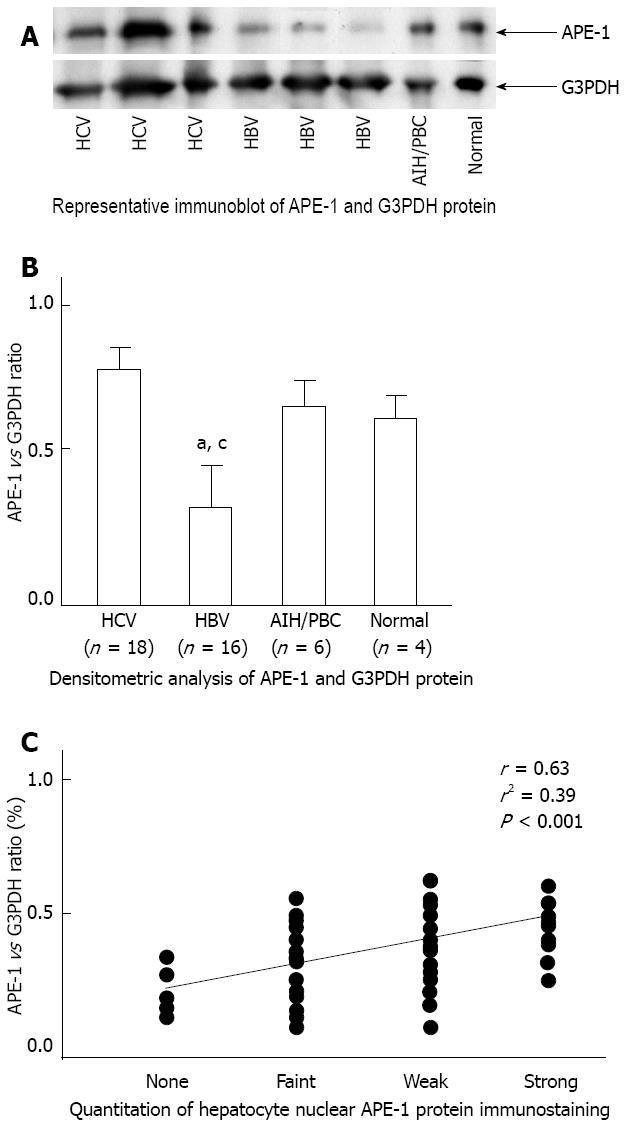
Figure 3 Hepatic apurinic/apyrimidinic endonuclease 1 protein expression in patients with chronic liver disease.
A, B: Western blot analysis showed that apurinic/apyrimidinic endonuclease 1 (APE-1) protein levels were reduced in HBV livers compared with normal and HCV livers; HCV livers showed no significant difference in APE-1 protein level compared with normal livers (aP < 0.05 vs HCV, cP < 0.05 vs normal); C: Correlation between hepatocytic APE-1 protein determined by Western blot and immunohistochemistry in patients with chronic hepatitis. G3PDH: Anti-glyceraldehyde-3-phosphate dehydrogenase.
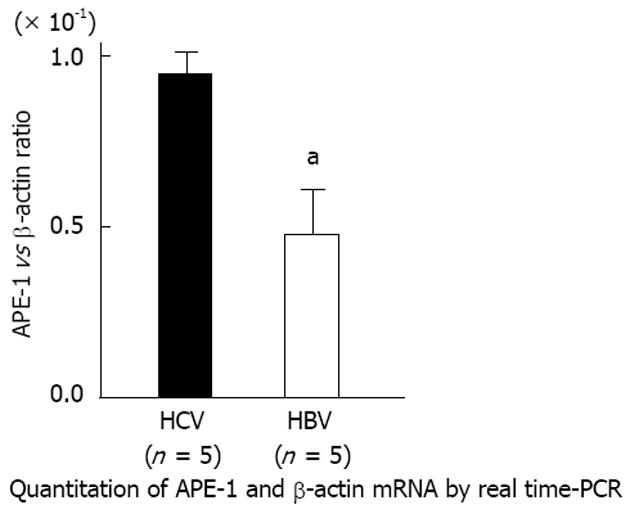
Figure 4 Hepatic apurinic/apyrimidinic endonuclease 1 mRNA expression in patients with chronic liver disease.
Real-time polymerase chain reaction (PCR) analysis showed that apurinic/apyrimidinic endonuclease 1 (APE-1) mRNA levels were reduced by 58% in HBV livers compared with HCV livers (aP < 0.05 vs HCV).
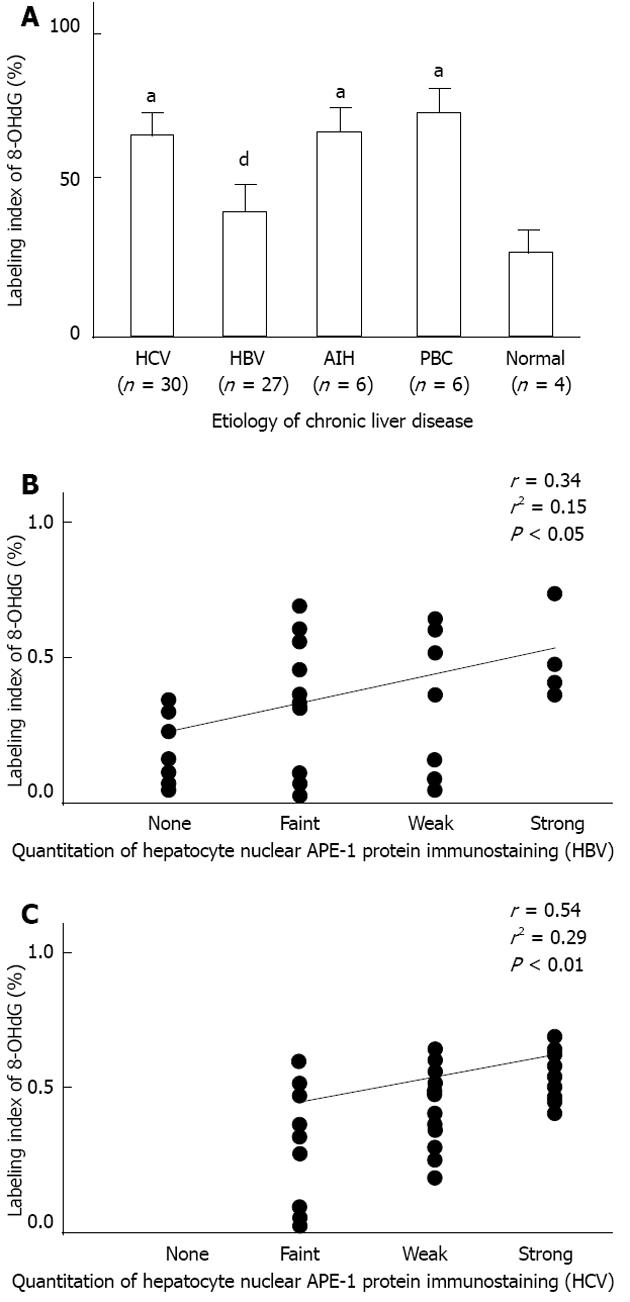
Figure 5 Hepatocytic 8-hydroxydeoxyguanosine expression in patients with chronic liver disease.
A: Hepatocytic 8-hydroxydeoxyguanosine labeling index was increased in the hepatitis C virus (HCV), autoimmune hepatitis (AIH), and primary biliary cirrhosis (PBC) groups (HCV, AIH or PBC vs normal; 64%, 64% or 68% vs 35%, respectively, aP < 0.05 vs normal), but not in the hepatitis B virus (HBV) group, and the labeling index was lower in the HBV than in the HCV group (HBV vs HCV; 41% vs 64%, respectively, dP < 0.001 vs HCV); B, C: The labeling indices of HBV and HCV samples were positively correlated with the staining intensity of hepatocytic nuclear apurinic/apyrimidinic endonuclease 1 (APE-1) protein (HBV, r = 0.34, P < 0.05; HCV, r = 0.54, P < 0.01).
- Citation: Sumiyoshi S, Kobayashi Y, Kawamura K, Kawata K, Nakamura H. Differential expression of hepatic apurinic/apyrimidinic endonuclease 1, a DNA repair enzyme, in chronic hepatitis. World J Hepatol 2013; 5(4): 206-213
- URL: https://www.wjgnet.com/1948-5182/full/v5/i4/206.htm
- DOI: https://dx.doi.org/10.4254/wjh.v5.i4.206


