Copyright
©2012 Baishideng Publishing Group Co.
World J Hepatol. Apr 27, 2012; 4(4): 139-148
Published online Apr 27, 2012. doi: 10.4254/wjh.v4.i4.139
Published online Apr 27, 2012. doi: 10.4254/wjh.v4.i4.139
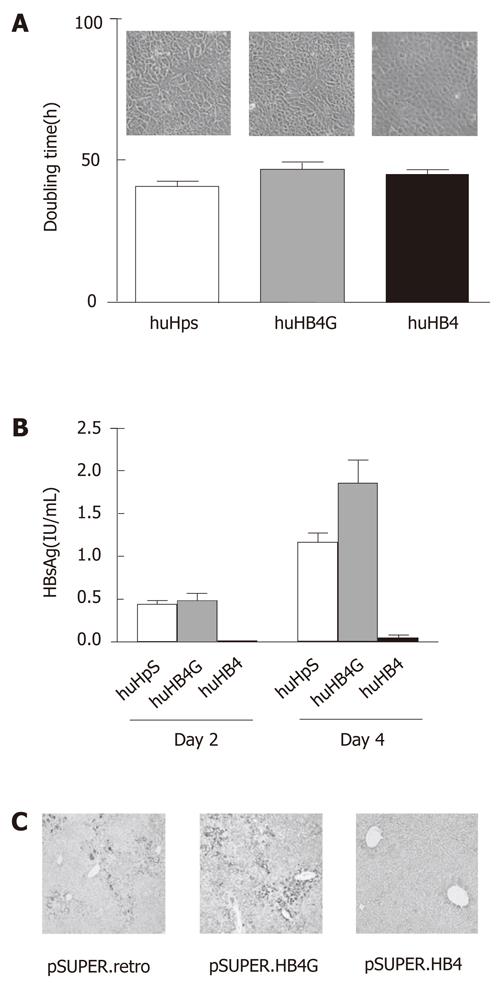
Figure 1 Effects of short hairpin RNA targeting hepatitis B virus on huH-1 cells.
A sequence of nineteen nucleotides that is shared by all four open reading frames of HBV was cloned into pSUPER.retro and named pSUPER.HB4, which was further mutated at the ninth A to G and designated pSUPER.HB4G. Stable transformants of each plasmid in huH-1 cells were established as huHpS, huHB4 and huHB4G, respectively. A: Representative morphologies (upper panel) and average doubling times (lower graph) of each transformant. Each stable transformant was maintained at 37 °C with 5% CO2 in Dulbecco’s modified Eagle’s medium supplemented with 10% fetal bovine serum and microscopically observed after 48 h (original magnification: 10x). The cells were counted on days 2 and 4 to calculate the average doubling times of each cell line from three independent cultures (40.9 ± 1.8 h, 46.8 ± 2.6 h and 45.1 ± 1.2 h in huHpS, huHB4G, and huHB4, respectively). The observed doubling times were not significantly different between huHpS and huHB4 but were different between huHpS and huHB4G (P = 0.022); B: The concentrations of HBsAg in the culture medium from huHpS, huHB4G, and huHB4 were 0.44 ± 0.046 IU/mL, 0.48 ± 0.091 IU/mL and 0.010 ± 0.0016 IU/mL on day 2 and 1.16 ± 0.11, 1.86 ± 0.26, and 0.050 ± 0.036 IU/mL on day 4, respectively. On both days, HBsAg was significantly reduced in huHB4 compared with the other two clones, but it was increased in huHB4G compared with huHpS (P = 0.0001 and P < 0.0001, respectively). C: Immunohistochemistry for HBx protein in HBx transgenic mouse liver 48 h after hydrodynamic gene delivery of pSUPER.retro, pSUPER.HB4G or pSUPER.HB4. The positive signals were remarkably reduced in mice that received pSUPER.HB4 compared with mice that received the other vectors, but were rather overrepresented in pSUPER.HB4G compared with pSUPER.retro (original magnification: 4x).
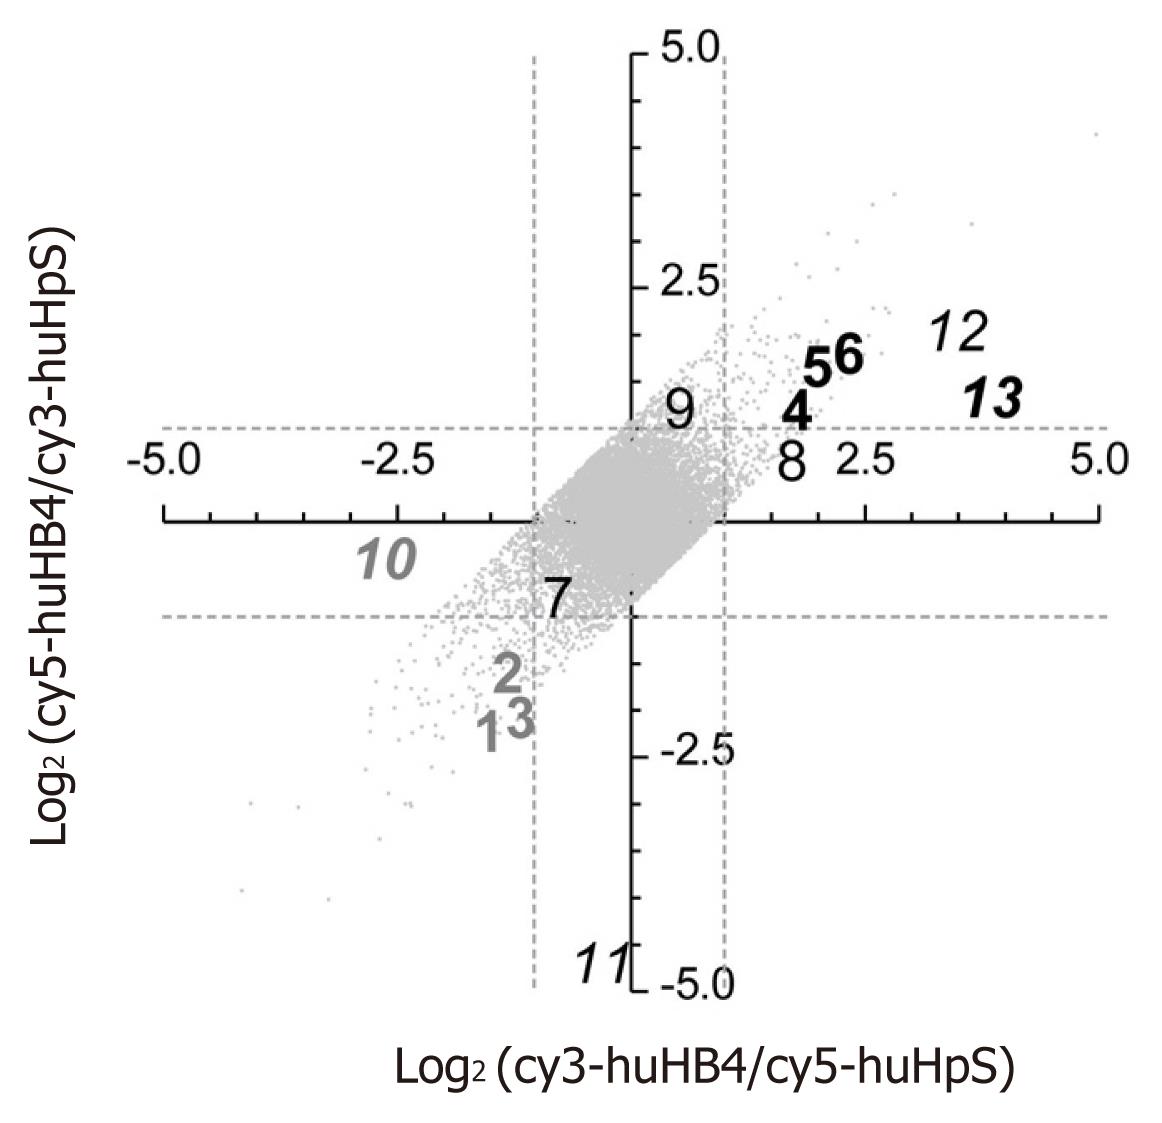
Figure 2 Log2 plot of flip-dye conversion in microarray analysis between huHpS and huHB4.
Total RNAs from huHpS and huHB4 were labeled with cy3/cy5, or vice versa, and subjected to a human 30 K cDNA microarray. Log2 ratios of the intensities in each labeling combination were plotted after LOWESS normalization as long as signal intensities were consistent between dye-flipping with less than a twofold difference. In total, 13 012 spots were plotted, and the dotted lines indicate a log2 intensity ratio of 1 or -1. Numbers 1 to 13 indicate the spots that were randomly selected for further quantitative reverse transcription-polymerase chain reaction evaluation. Bold gray and black numbers represent the spots that were found to show a twofold higher or lower intensity in huHB4 compared with huHpS by both microarray and quantitative RT-PCR analyses. Italicized numbers indicate the flip-inconsistent spots. RT-PCR: Real-time reverse transcription-polymerase chain reaction.
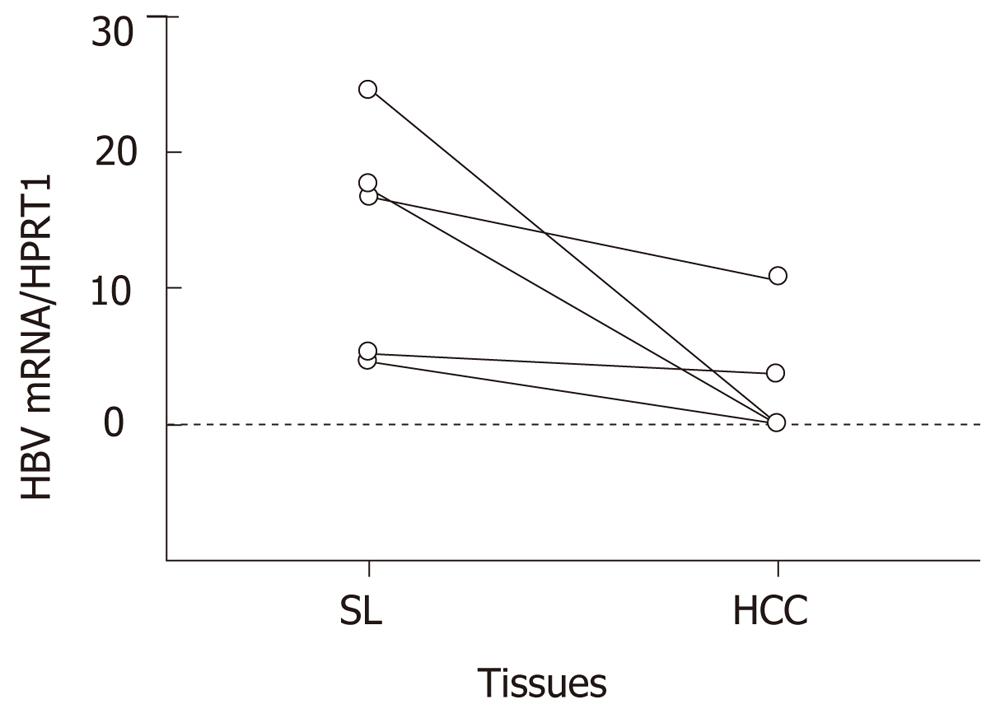
Figure 3 Quantity of hepatitis B virus mRNA in hepatocellular carcinoma and surrounding liver tissues.
The total amount of hepatitis B virus (HBV) mRNA was quantified as a ratio relative to hypoxanthine phosphoribosyltransferase 1 message in hepatocellular carcinoma (HCC) and surrounding non-cancerous liver tissues (SL) from five HBV-associated cases. In all cases, the message was repressed in HCC, and the average was significantly reduced from 13.7 ± 8.6 to 2.9 ± 4.7 (P = 0.032).
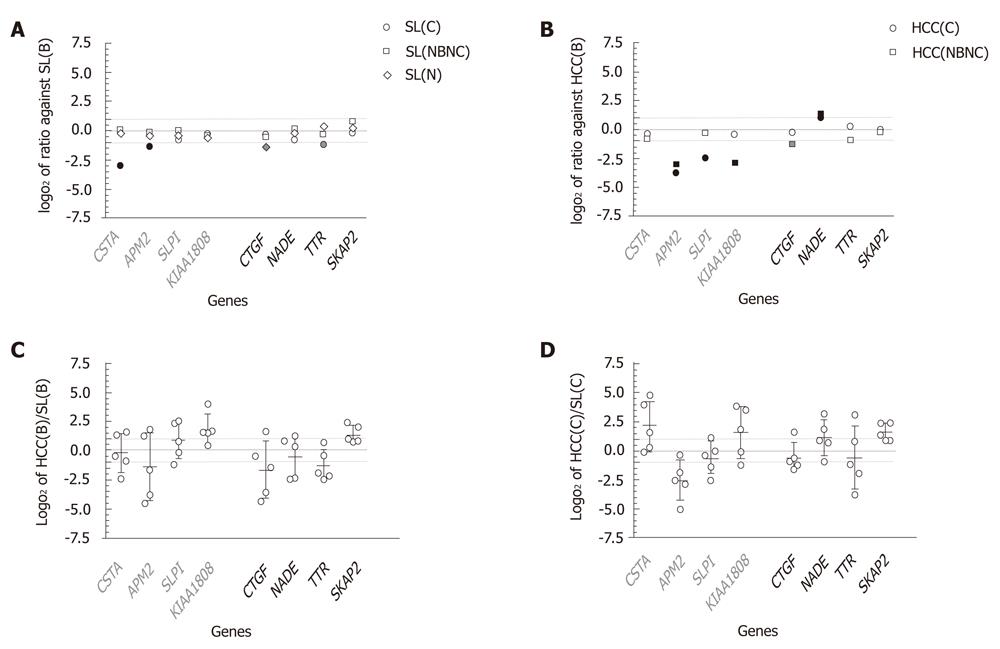
Figure 4 Expression profiles in various liver tissues with respect to genes differentially expressed in huHB4.
Quantitative RT-PCR was performed using various liver tissues for eight genes that were confirmed to be differentially expressed with HBV knockdown in huH-1 cells by both microarray and quantitative RT-PCR. The genes included CSTA, APM2, SLPI and KIA1808, which are down-regulated, and CTGF, NADE, TTR and SKAP2, which are up-regulated in huHB4 knockdown cells. Relative amounts of each message are plotted as log2 ratios, and the dotted gray lines indicate 1 and -1 log2 ratios. Liver tissues include five HBV infected cases (B), five HCV infected cases (C), three neither HBV nor HCV infected cases (NBNC) and five cases without chronic liver diseases (N). A: Comparison between surrounding non-cancerous liver tissues (SL). The combinations include comparisons of SL(B) to SL(C), SL(NBNC) and SL(N); B: Comparisons between HCC. The combinations include comparisons of HCC(B) to HCC(C) and to HCC(NBNC). In A and B, the results are plotted in white if the ratio was between 1 and -1, whereas black and gray marks indicate consistency and inconsistency between the results from liver tissues and huHB4, respectively. C, D: Log2 ratio between HCC(B) and the corresponding SL(B), or HCC(C) and corresponding SL(C). The error bars indicate mean ± SD. RT-PCR: Real-time reverse transcription-polymerase chain reaction; HBV: Hepatitis B virus; HCV: Hepatitis C virus; HCC: Hepatocellular carcinoma; SL: Surrounding non-cancerous liver tissues.
- Citation: Fukuhara Y, Suda T, Kobayashi M, Tamura Y, Igarashi M, Waguri N, Kawai H, Aoyagi Y. Identification of cellular genes showing differential expression associated with hepatitis B virus infection. World J Hepatol 2012; 4(4): 139-148
- URL: https://www.wjgnet.com/1948-5182/full/v4/i4/139.htm
- DOI: https://dx.doi.org/10.4254/wjh.v4.i4.139


