Copyright
©2012 Baishideng Publishing Group Co.
World J Hepatol. Apr 27, 2012; 4(4): 139-148
Published online Apr 27, 2012. doi: 10.4254/wjh.v4.i4.139
Published online Apr 27, 2012. doi: 10.4254/wjh.v4.i4.139
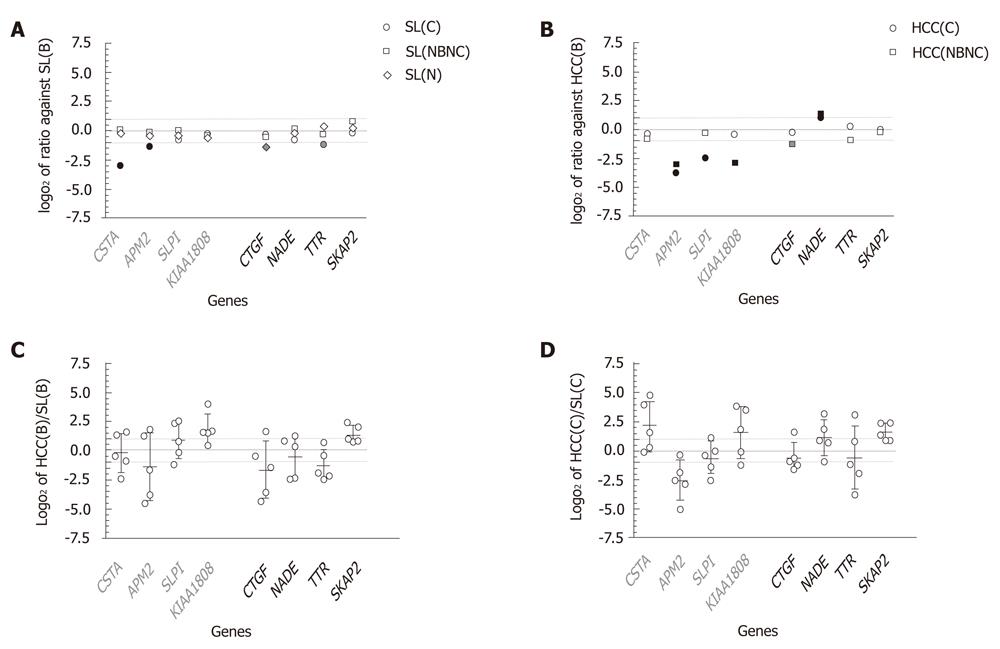
Figure 4 Expression profiles in various liver tissues with respect to genes differentially expressed in huHB4.
Quantitative RT-PCR was performed using various liver tissues for eight genes that were confirmed to be differentially expressed with HBV knockdown in huH-1 cells by both microarray and quantitative RT-PCR. The genes included CSTA, APM2, SLPI and KIA1808, which are down-regulated, and CTGF, NADE, TTR and SKAP2, which are up-regulated in huHB4 knockdown cells. Relative amounts of each message are plotted as log2 ratios, and the dotted gray lines indicate 1 and -1 log2 ratios. Liver tissues include five HBV infected cases (B), five HCV infected cases (C), three neither HBV nor HCV infected cases (NBNC) and five cases without chronic liver diseases (N). A: Comparison between surrounding non-cancerous liver tissues (SL). The combinations include comparisons of SL(B) to SL(C), SL(NBNC) and SL(N); B: Comparisons between HCC. The combinations include comparisons of HCC(B) to HCC(C) and to HCC(NBNC). In A and B, the results are plotted in white if the ratio was between 1 and -1, whereas black and gray marks indicate consistency and inconsistency between the results from liver tissues and huHB4, respectively. C, D: Log2 ratio between HCC(B) and the corresponding SL(B), or HCC(C) and corresponding SL(C). The error bars indicate mean ± SD. RT-PCR: Real-time reverse transcription-polymerase chain reaction; HBV: Hepatitis B virus; HCV: Hepatitis C virus; HCC: Hepatocellular carcinoma; SL: Surrounding non-cancerous liver tissues.
- Citation: Fukuhara Y, Suda T, Kobayashi M, Tamura Y, Igarashi M, Waguri N, Kawai H, Aoyagi Y. Identification of cellular genes showing differential expression associated with hepatitis B virus infection. World J Hepatol 2012; 4(4): 139-148
- URL: https://www.wjgnet.com/1948-5182/full/v4/i4/139.htm
- DOI: https://dx.doi.org/10.4254/wjh.v4.i4.139


