
















Copyright: ©Author(s) 2026.
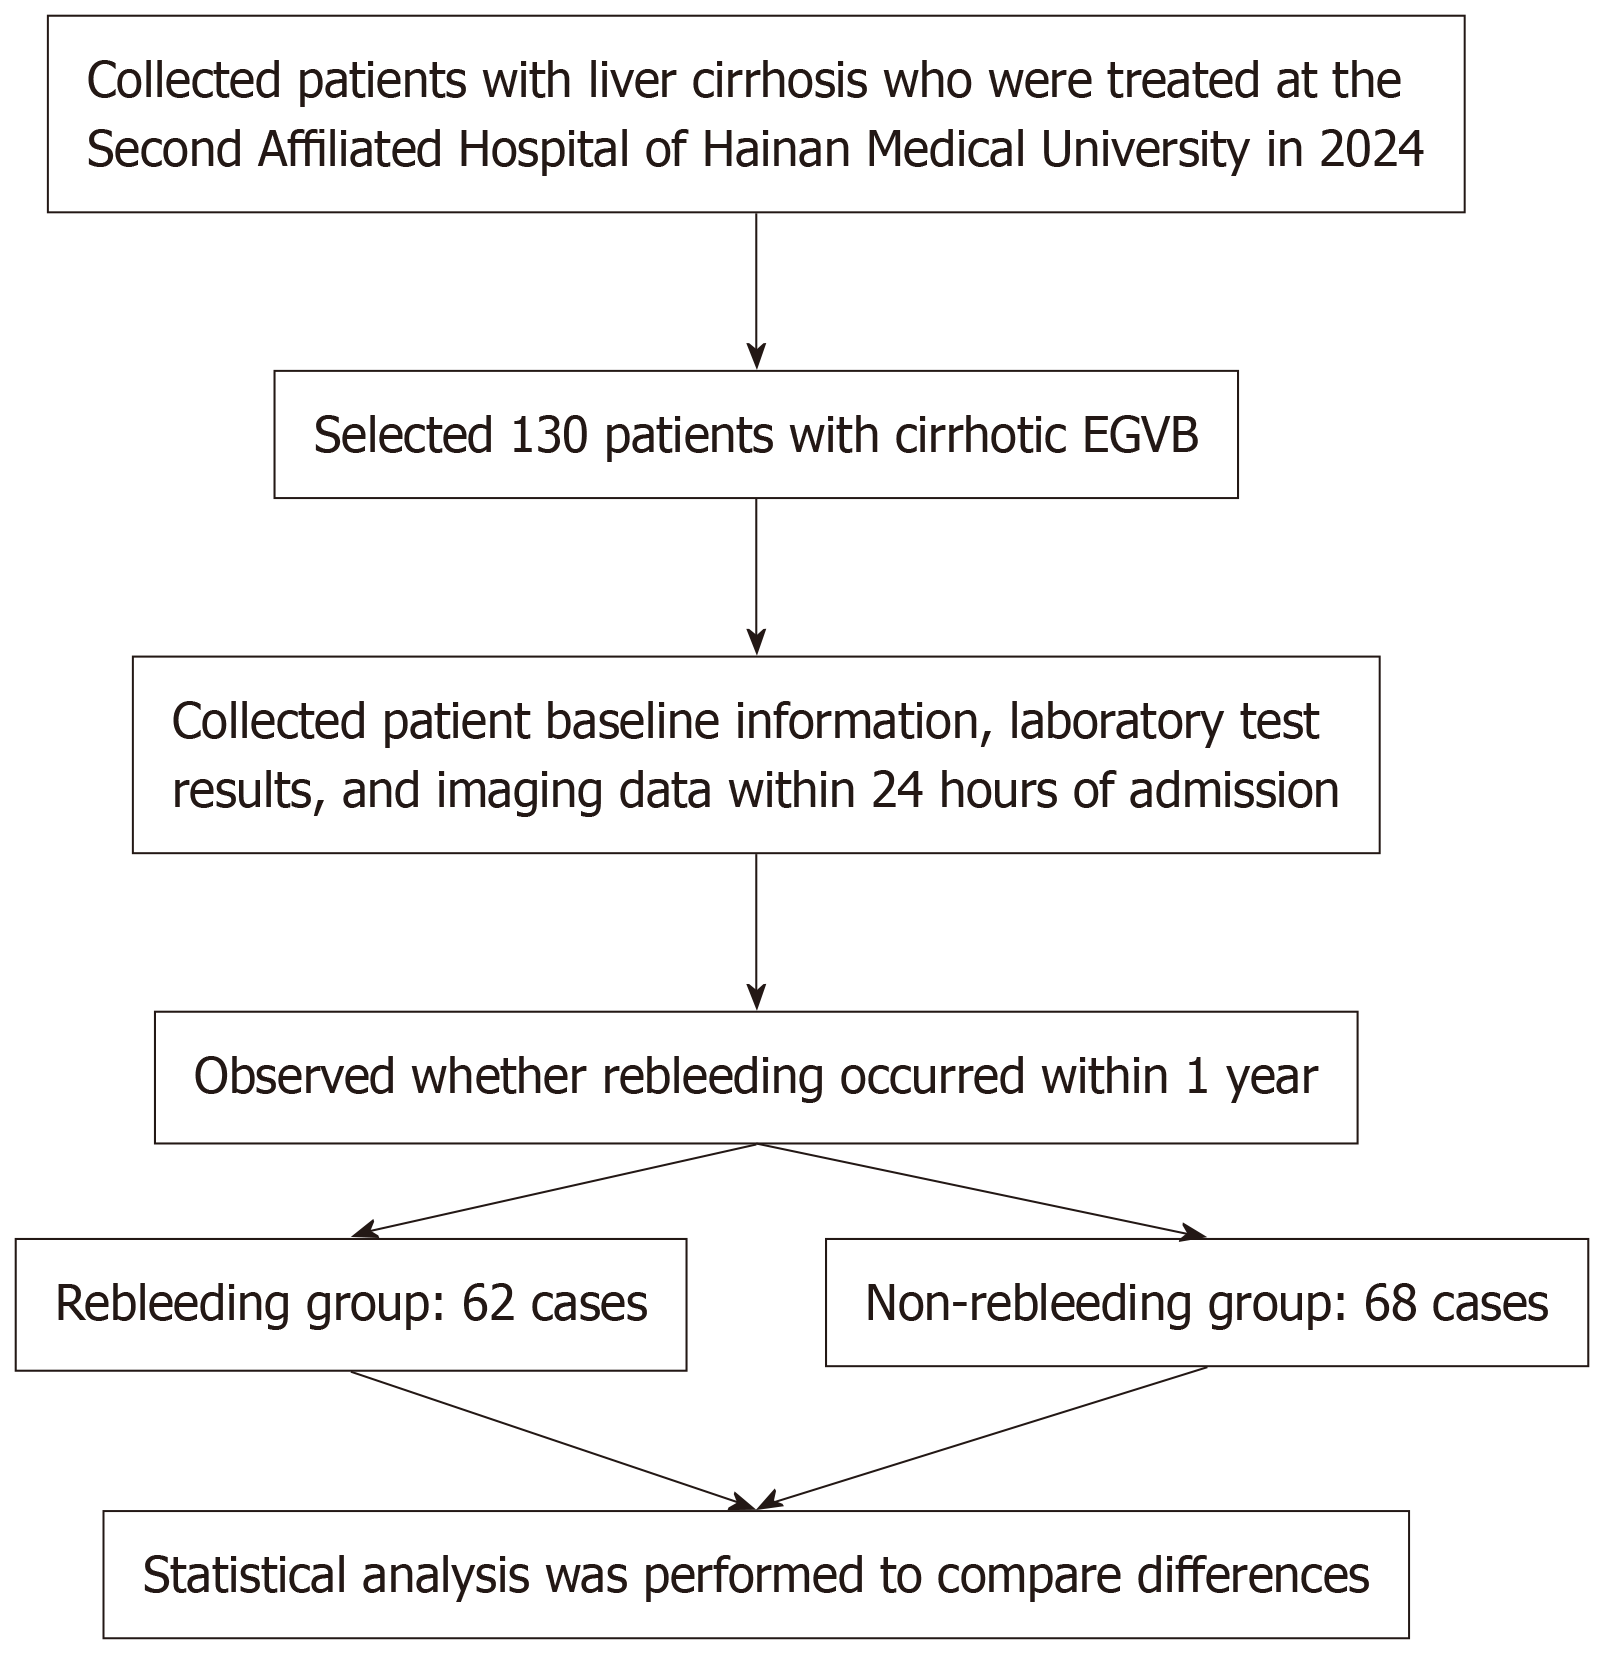
Figure 1 Data collection and classification flow chart.
EGVB: Esophagogastric variceal bleeding.
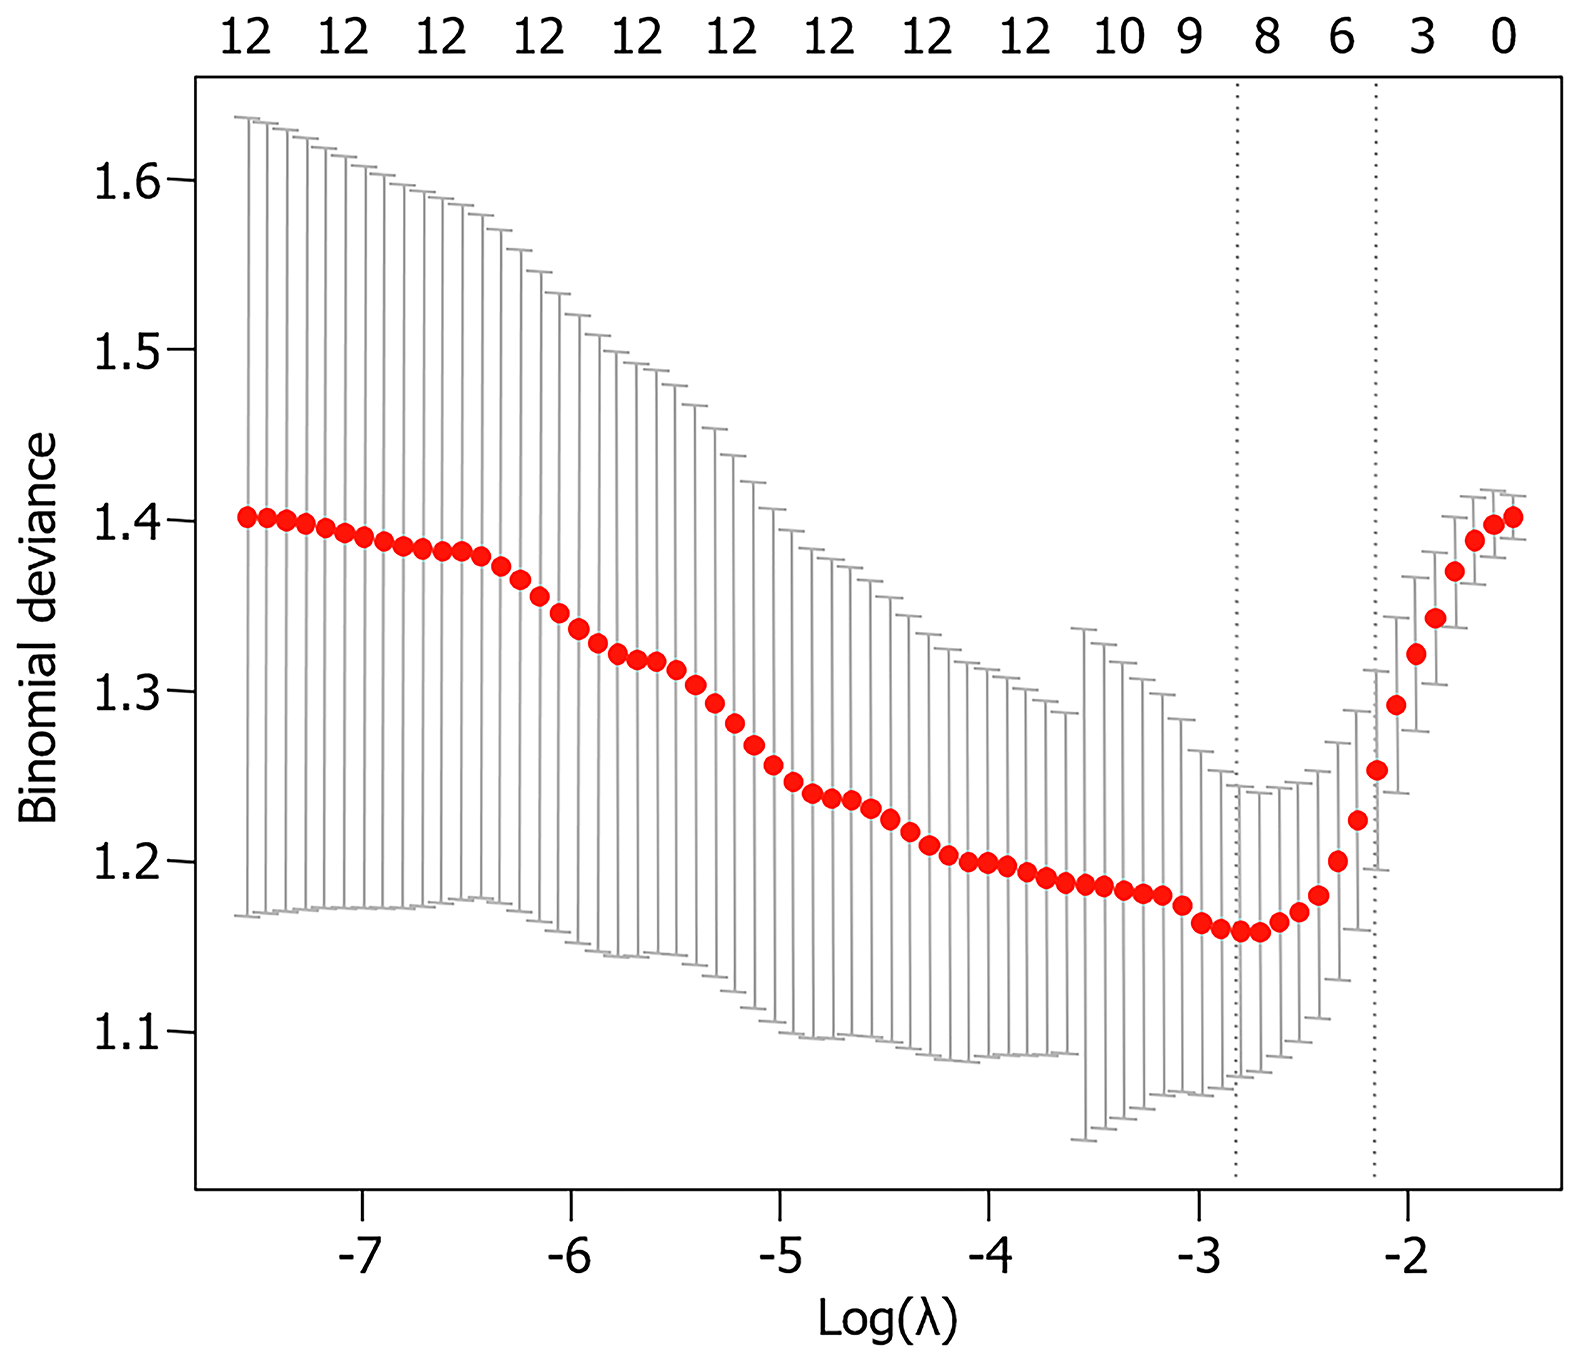
Figure 2 LASSO regression cross validation.
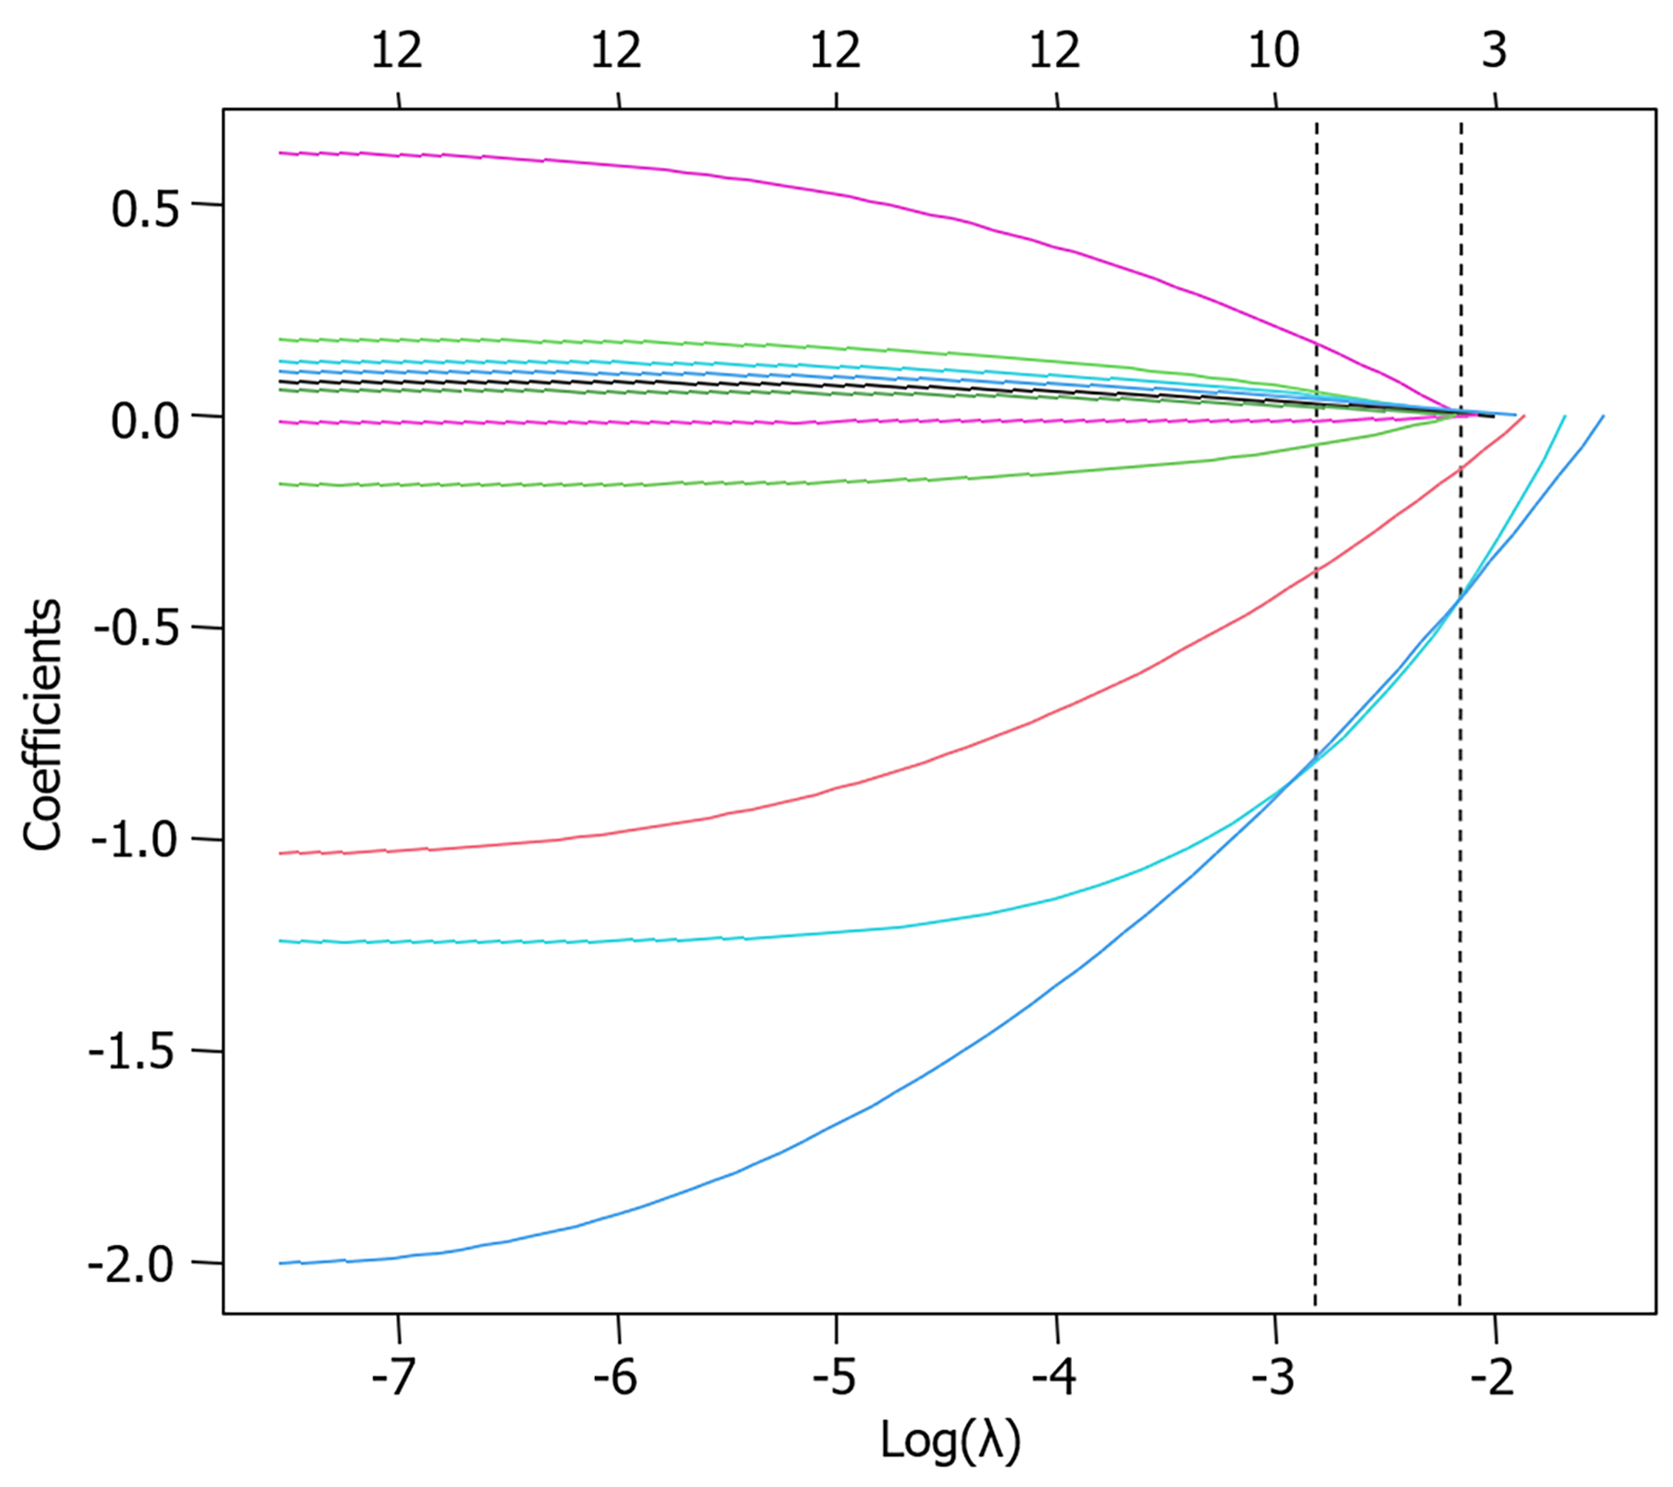
Figure 3 LASSO regression path diagram.
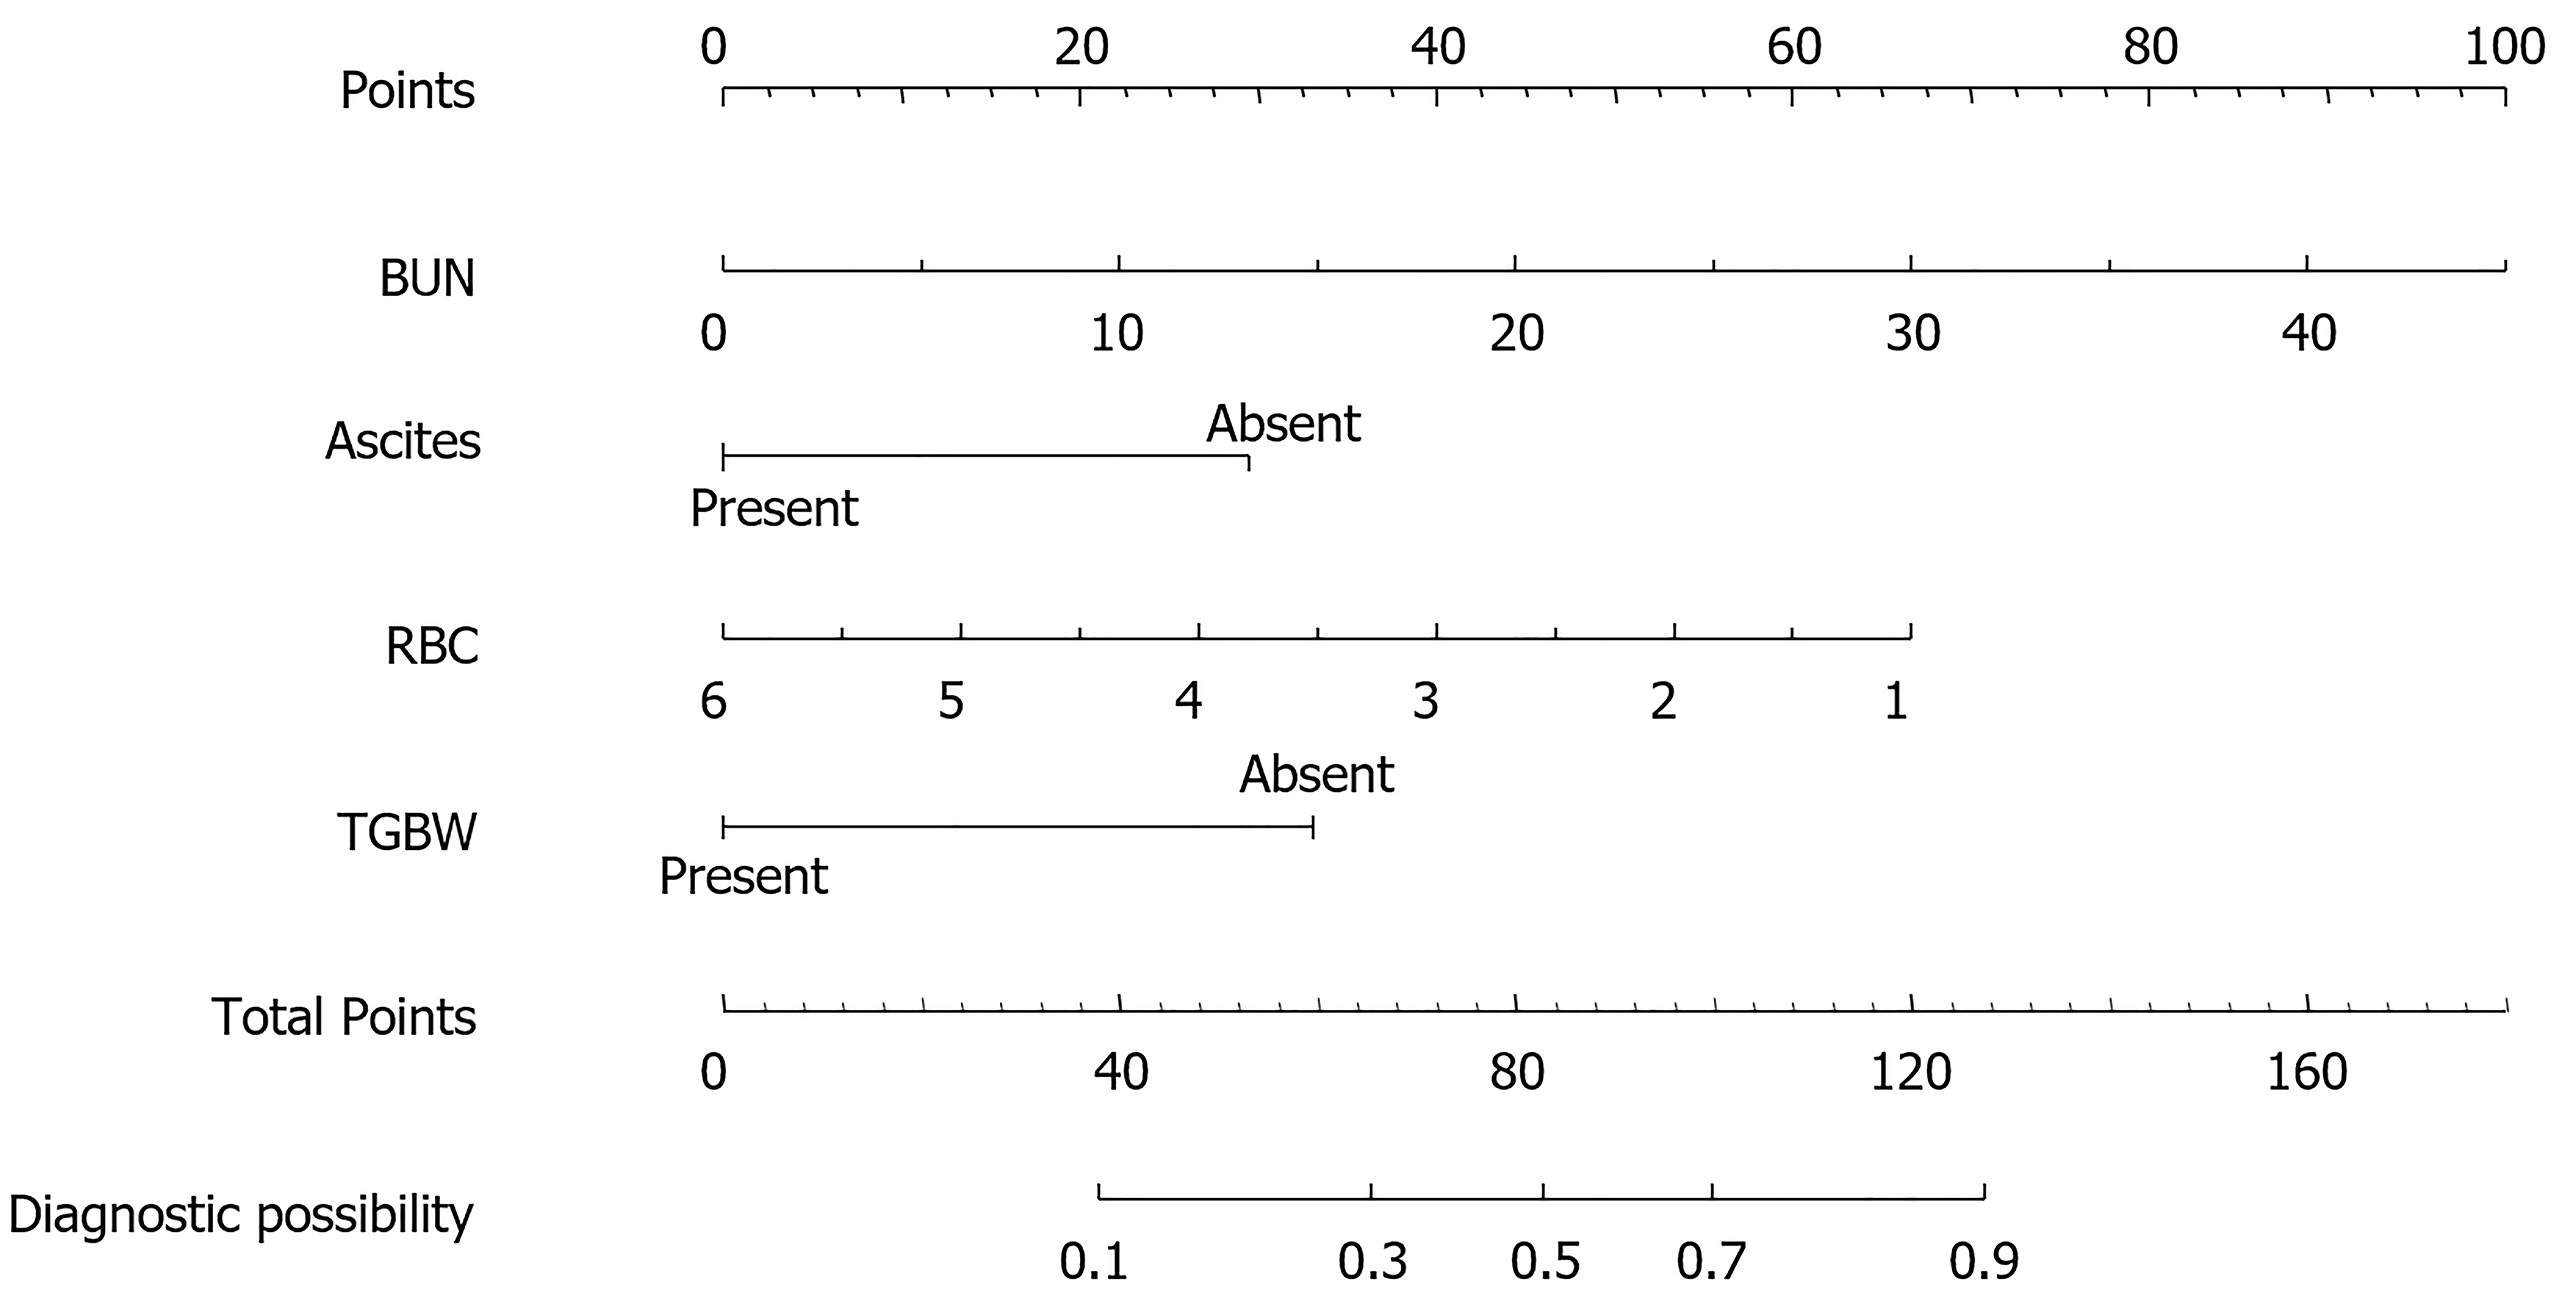
Figure 4 Risk prediction nomogram.
BUN: Blood urea nitrogen; RBC: Red blood cell; TGBW: Thickening of the gallbladder wall.
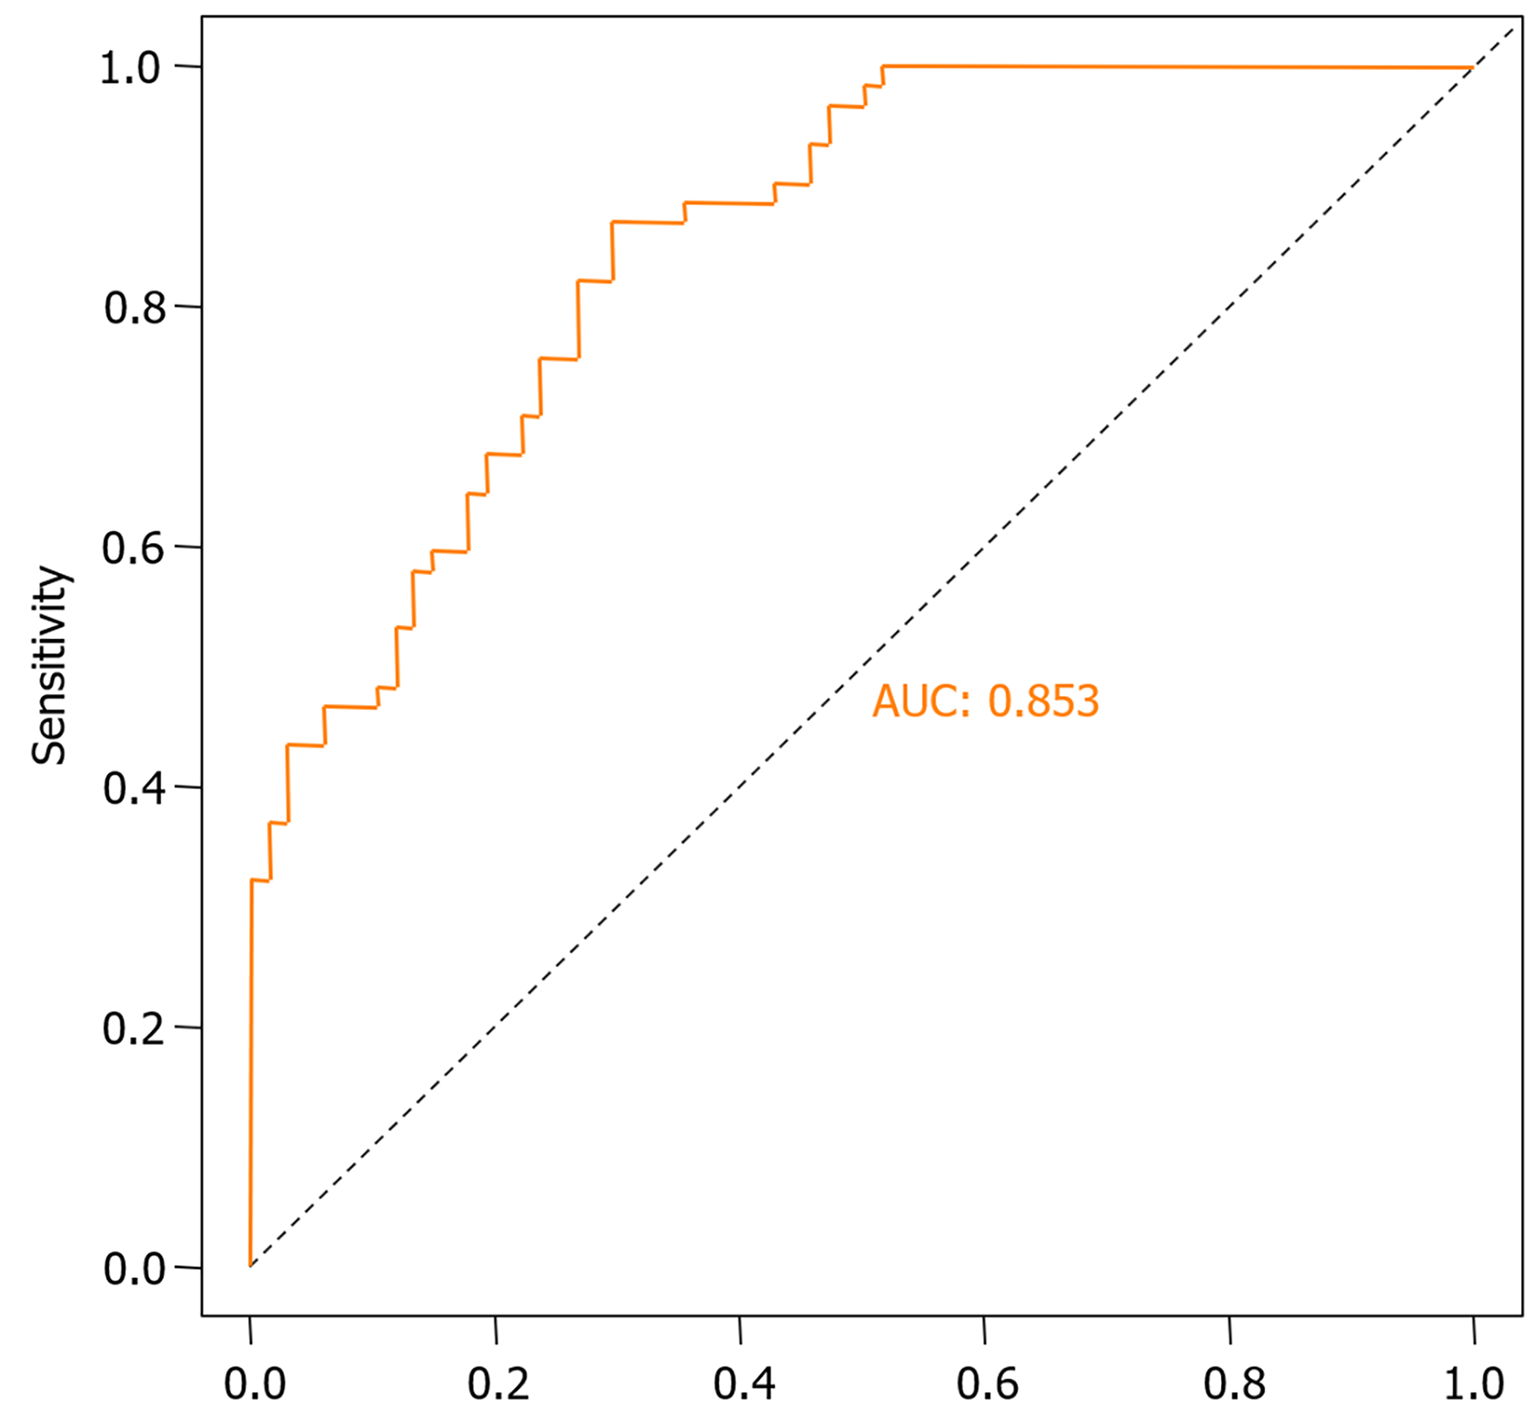
Figure 5 Receiver operating characteristic curve of training set.
AUC: Area under the curve.
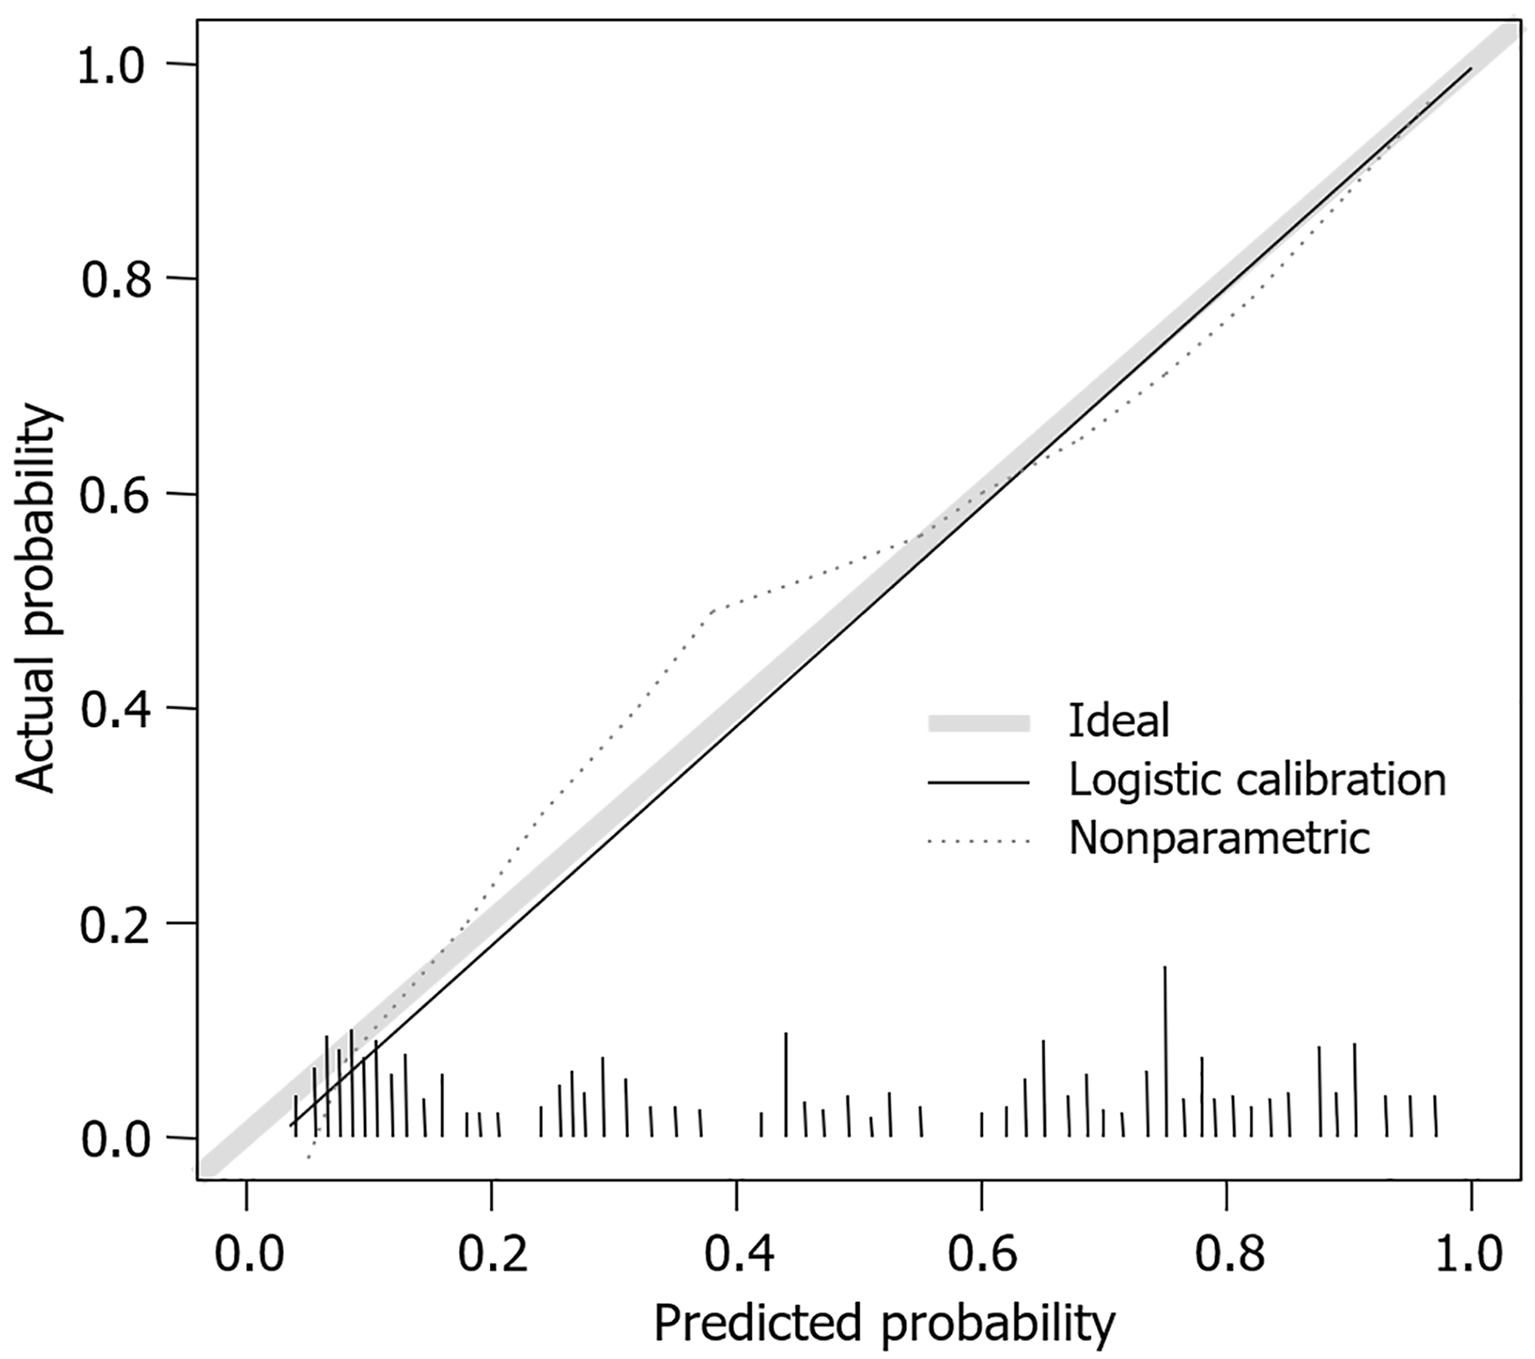
Figure 6 Calibration curve of training set.
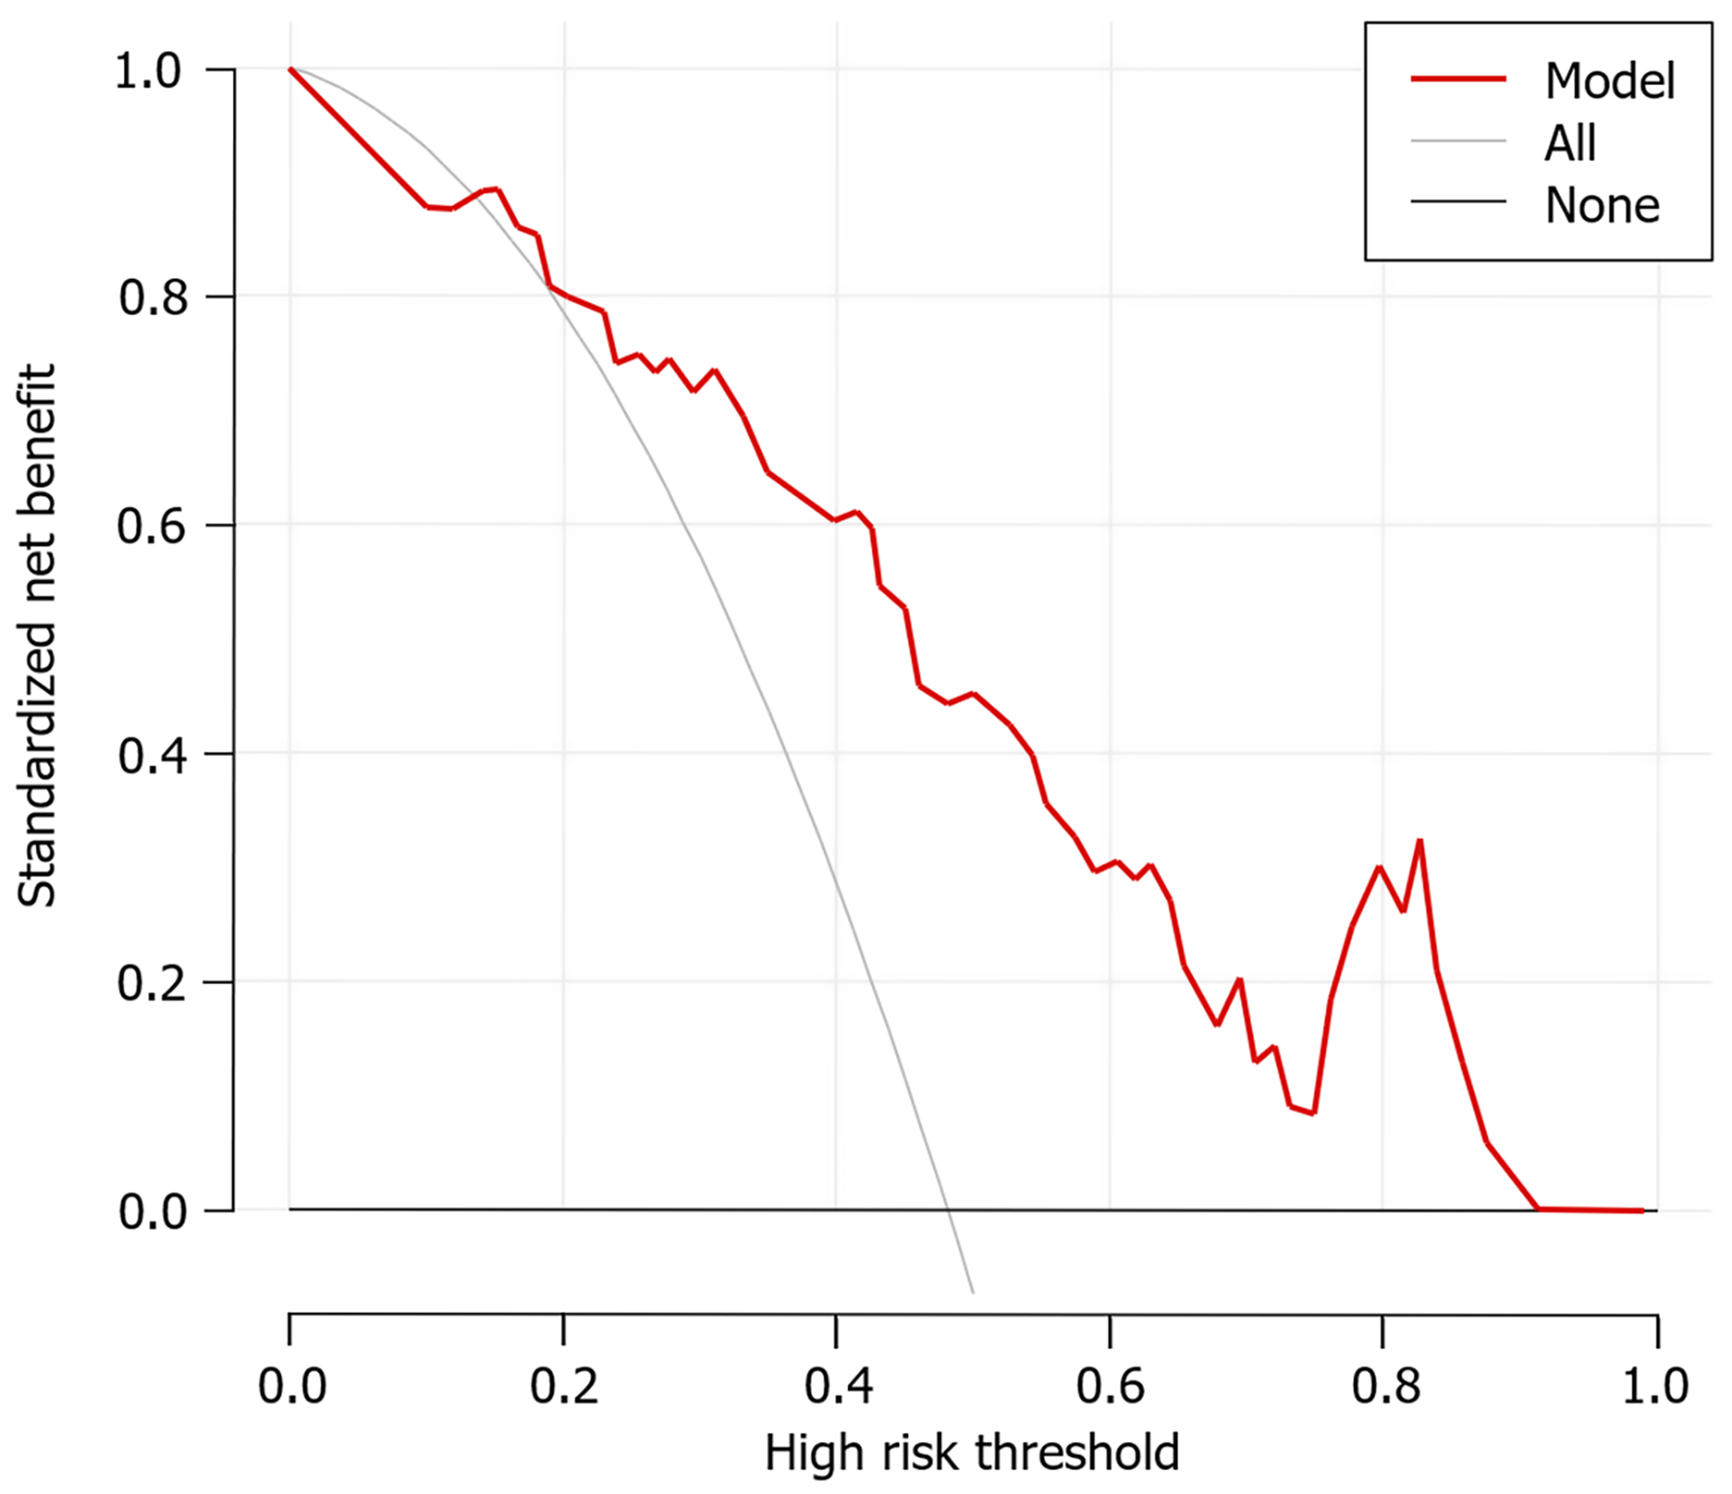
Figure 7 Clinical decision curve of training set.
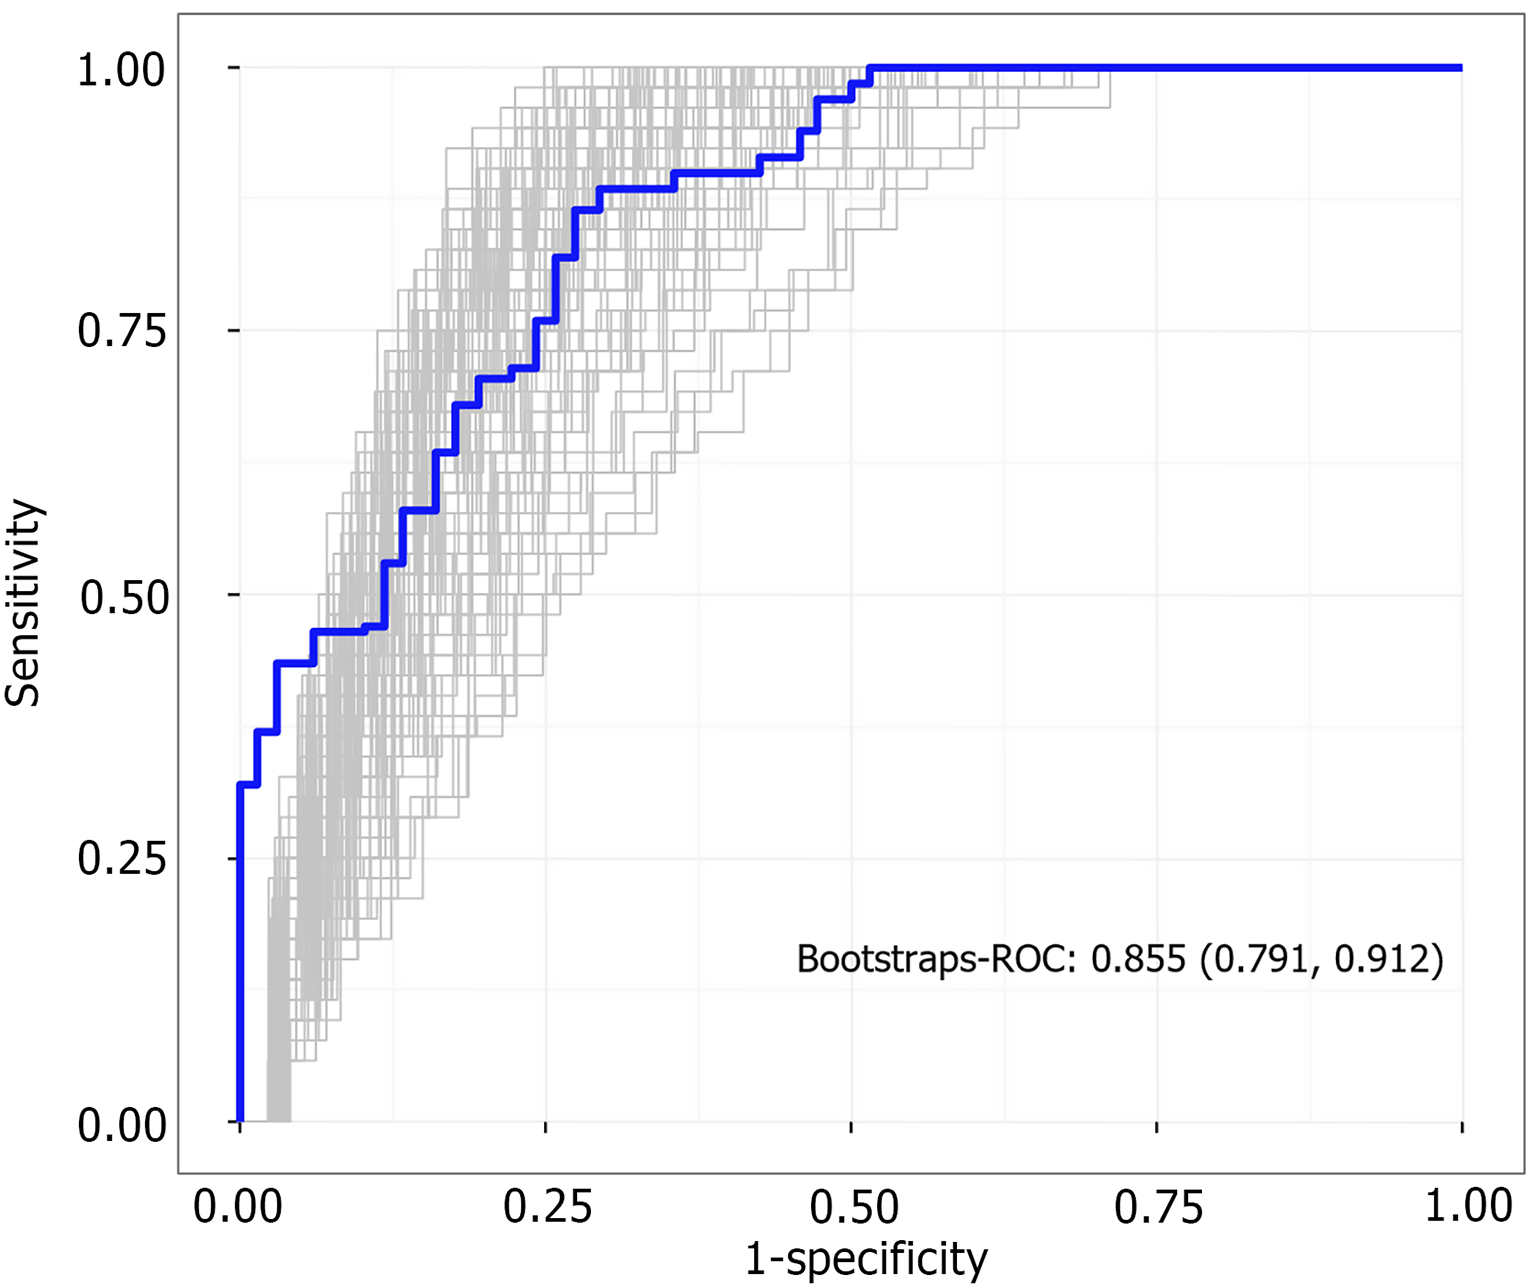
Figure 8 Bootstrap receiver operating characteristic curve.
ROC: Receiver operating characteristic.
- Citation: Li PP, Zhong X, Zhang DY, Bai FH. Analysis of risk factors and a prediction model for rebleeding in liver cirrhosis patients with esophagogastric variceal bleeding. World J Hepatol 2026; 18(9): 123456
- URL: https://www.wjgnet.com/1948-5182/full/v18/i9/123456.htm
- DOI: https://dx.doi.org/10.4254/wjh.123456