Copyright
©The Author(s) 2025.
World J Hepatol. Jun 27, 2025; 17(6): 107160
Published online Jun 27, 2025. doi: 10.4254/wjh.v17.i6.107160
Published online Jun 27, 2025. doi: 10.4254/wjh.v17.i6.107160
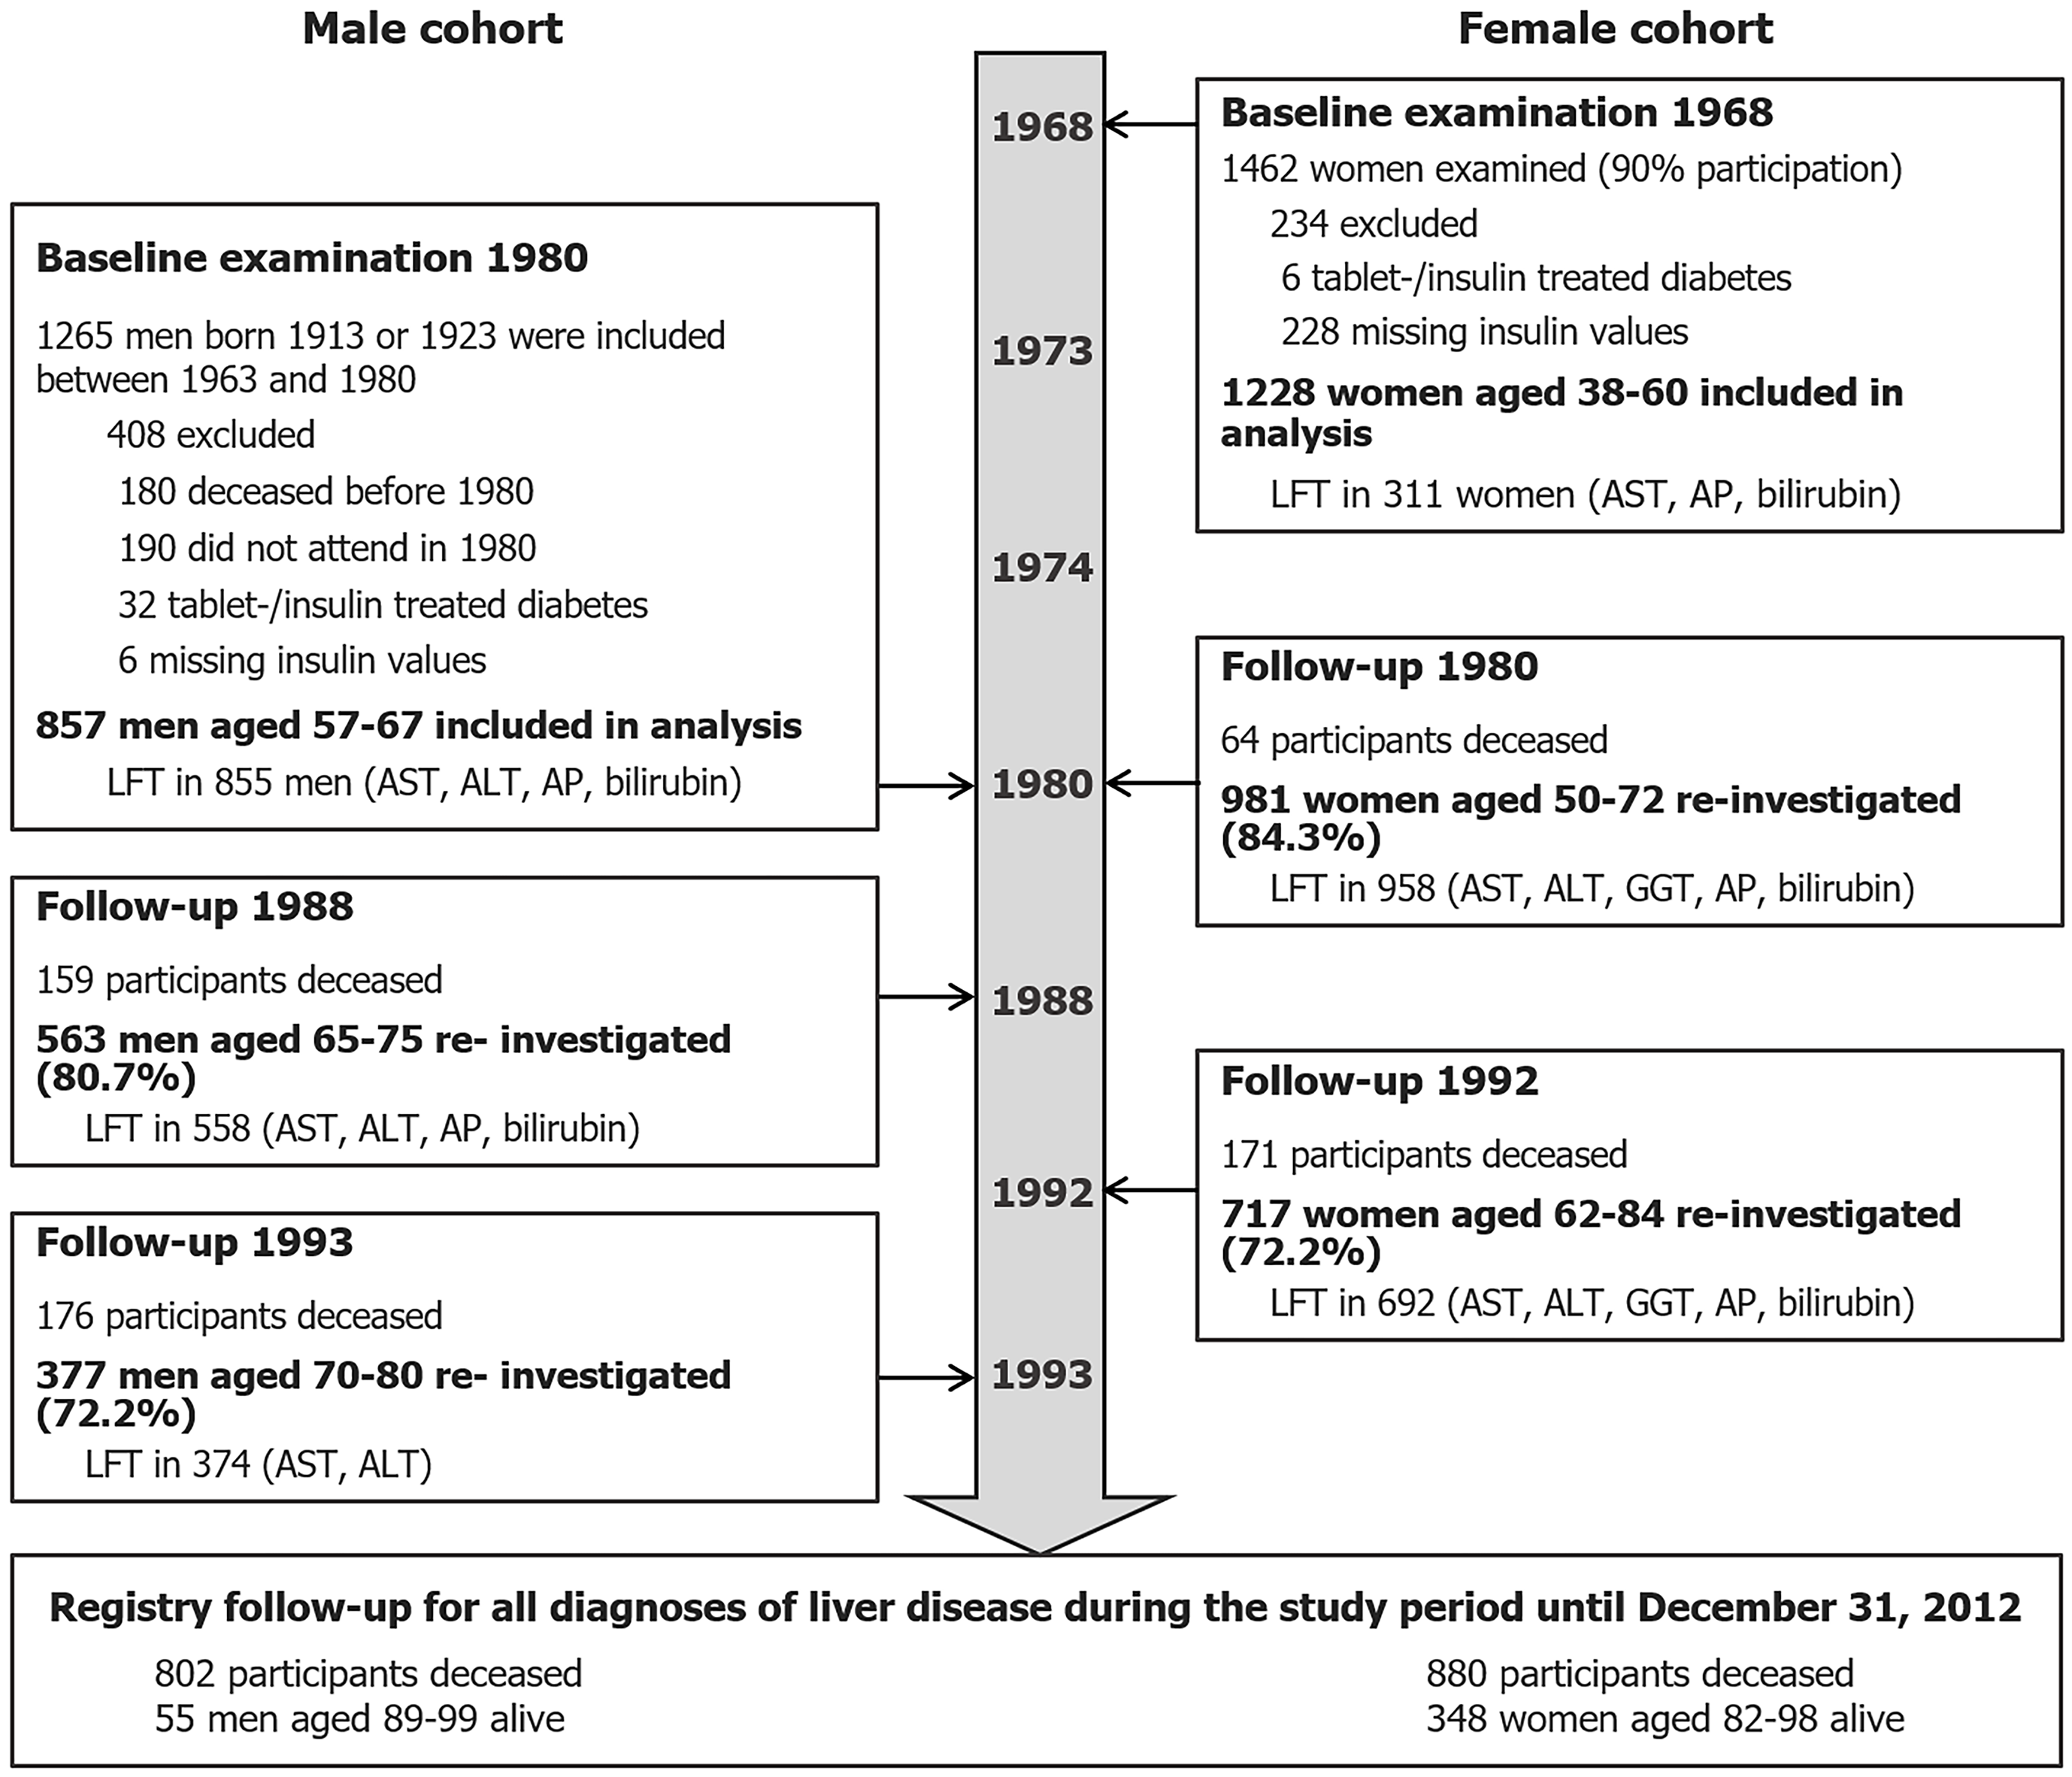
Figure 1 Flow chart of the study cohorts.
ALT: Alanine aminotransferase; AP: Alkaline phosphatase; AST: Aspartate aminotransferase; LFT: Liver function tests.
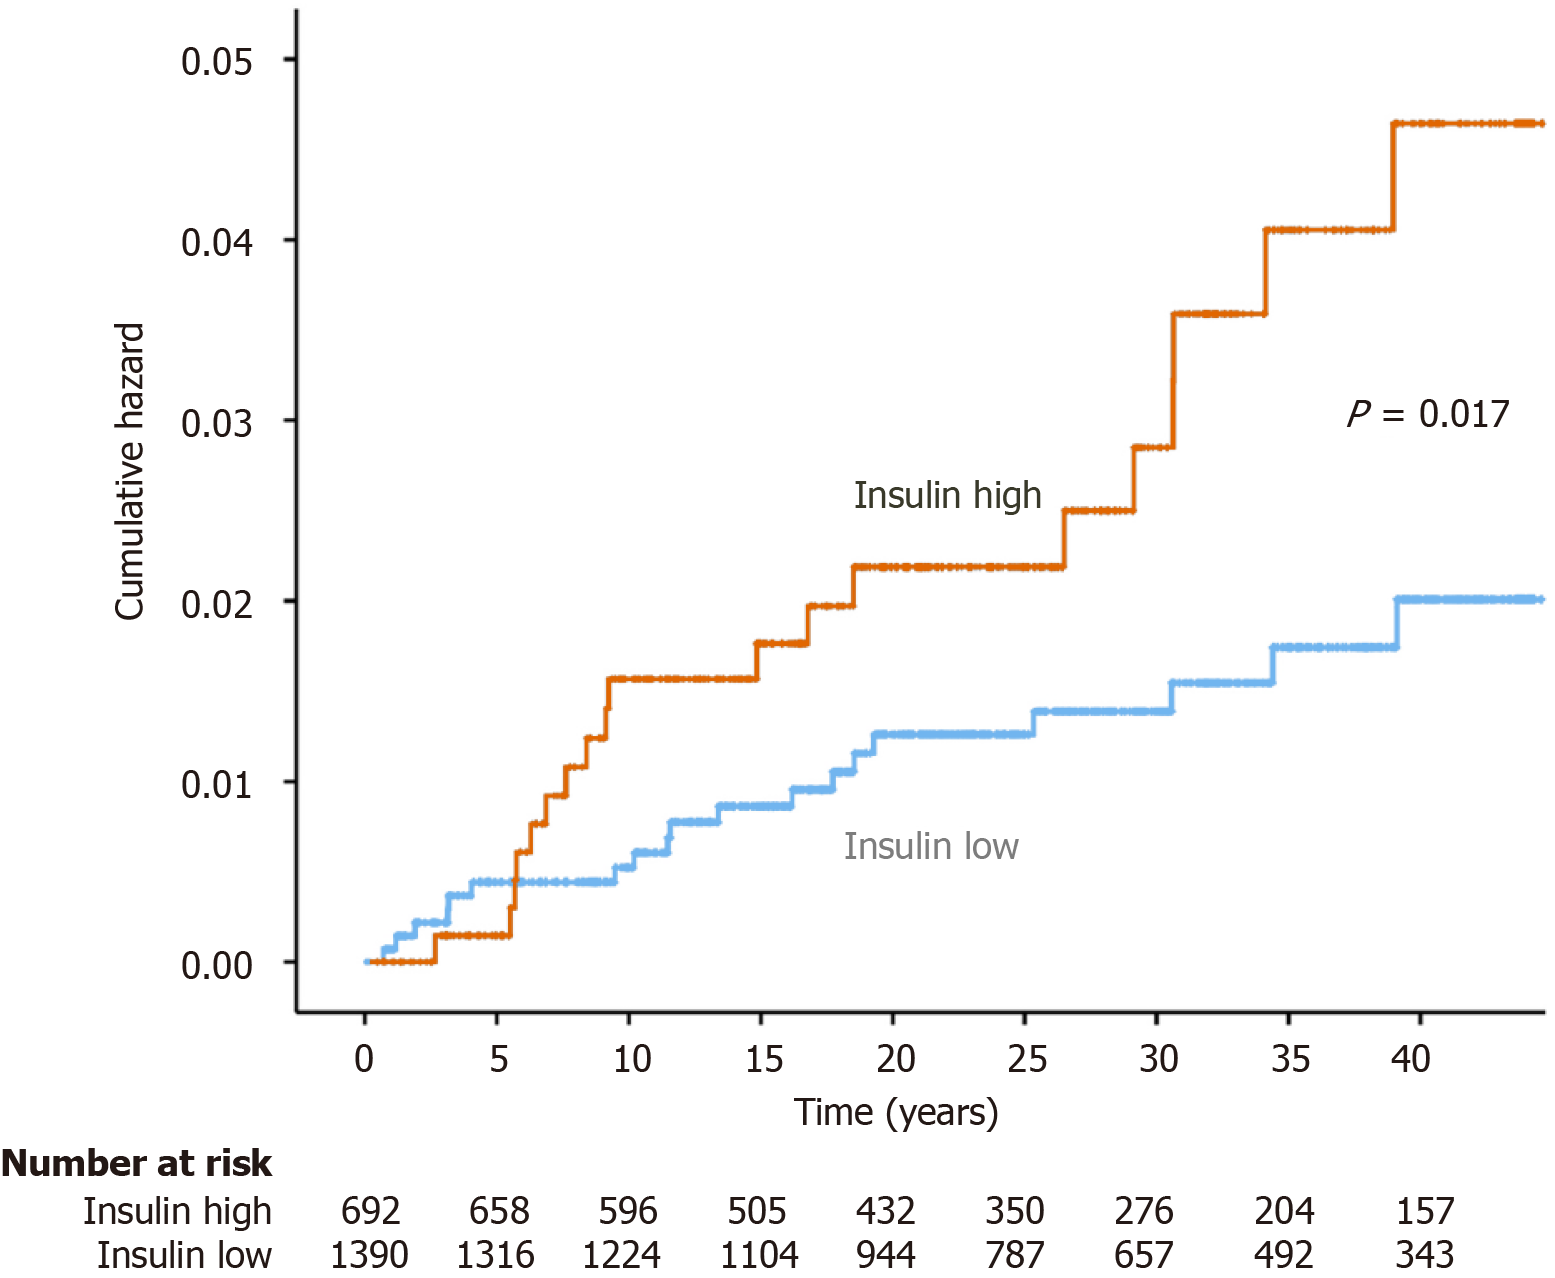
Figure 2 Cumulative hazard function for incident cases of liver disease.
Insulin high represents the upper tertile of insulin levels, Insulin low represents the middle and lower tertile.
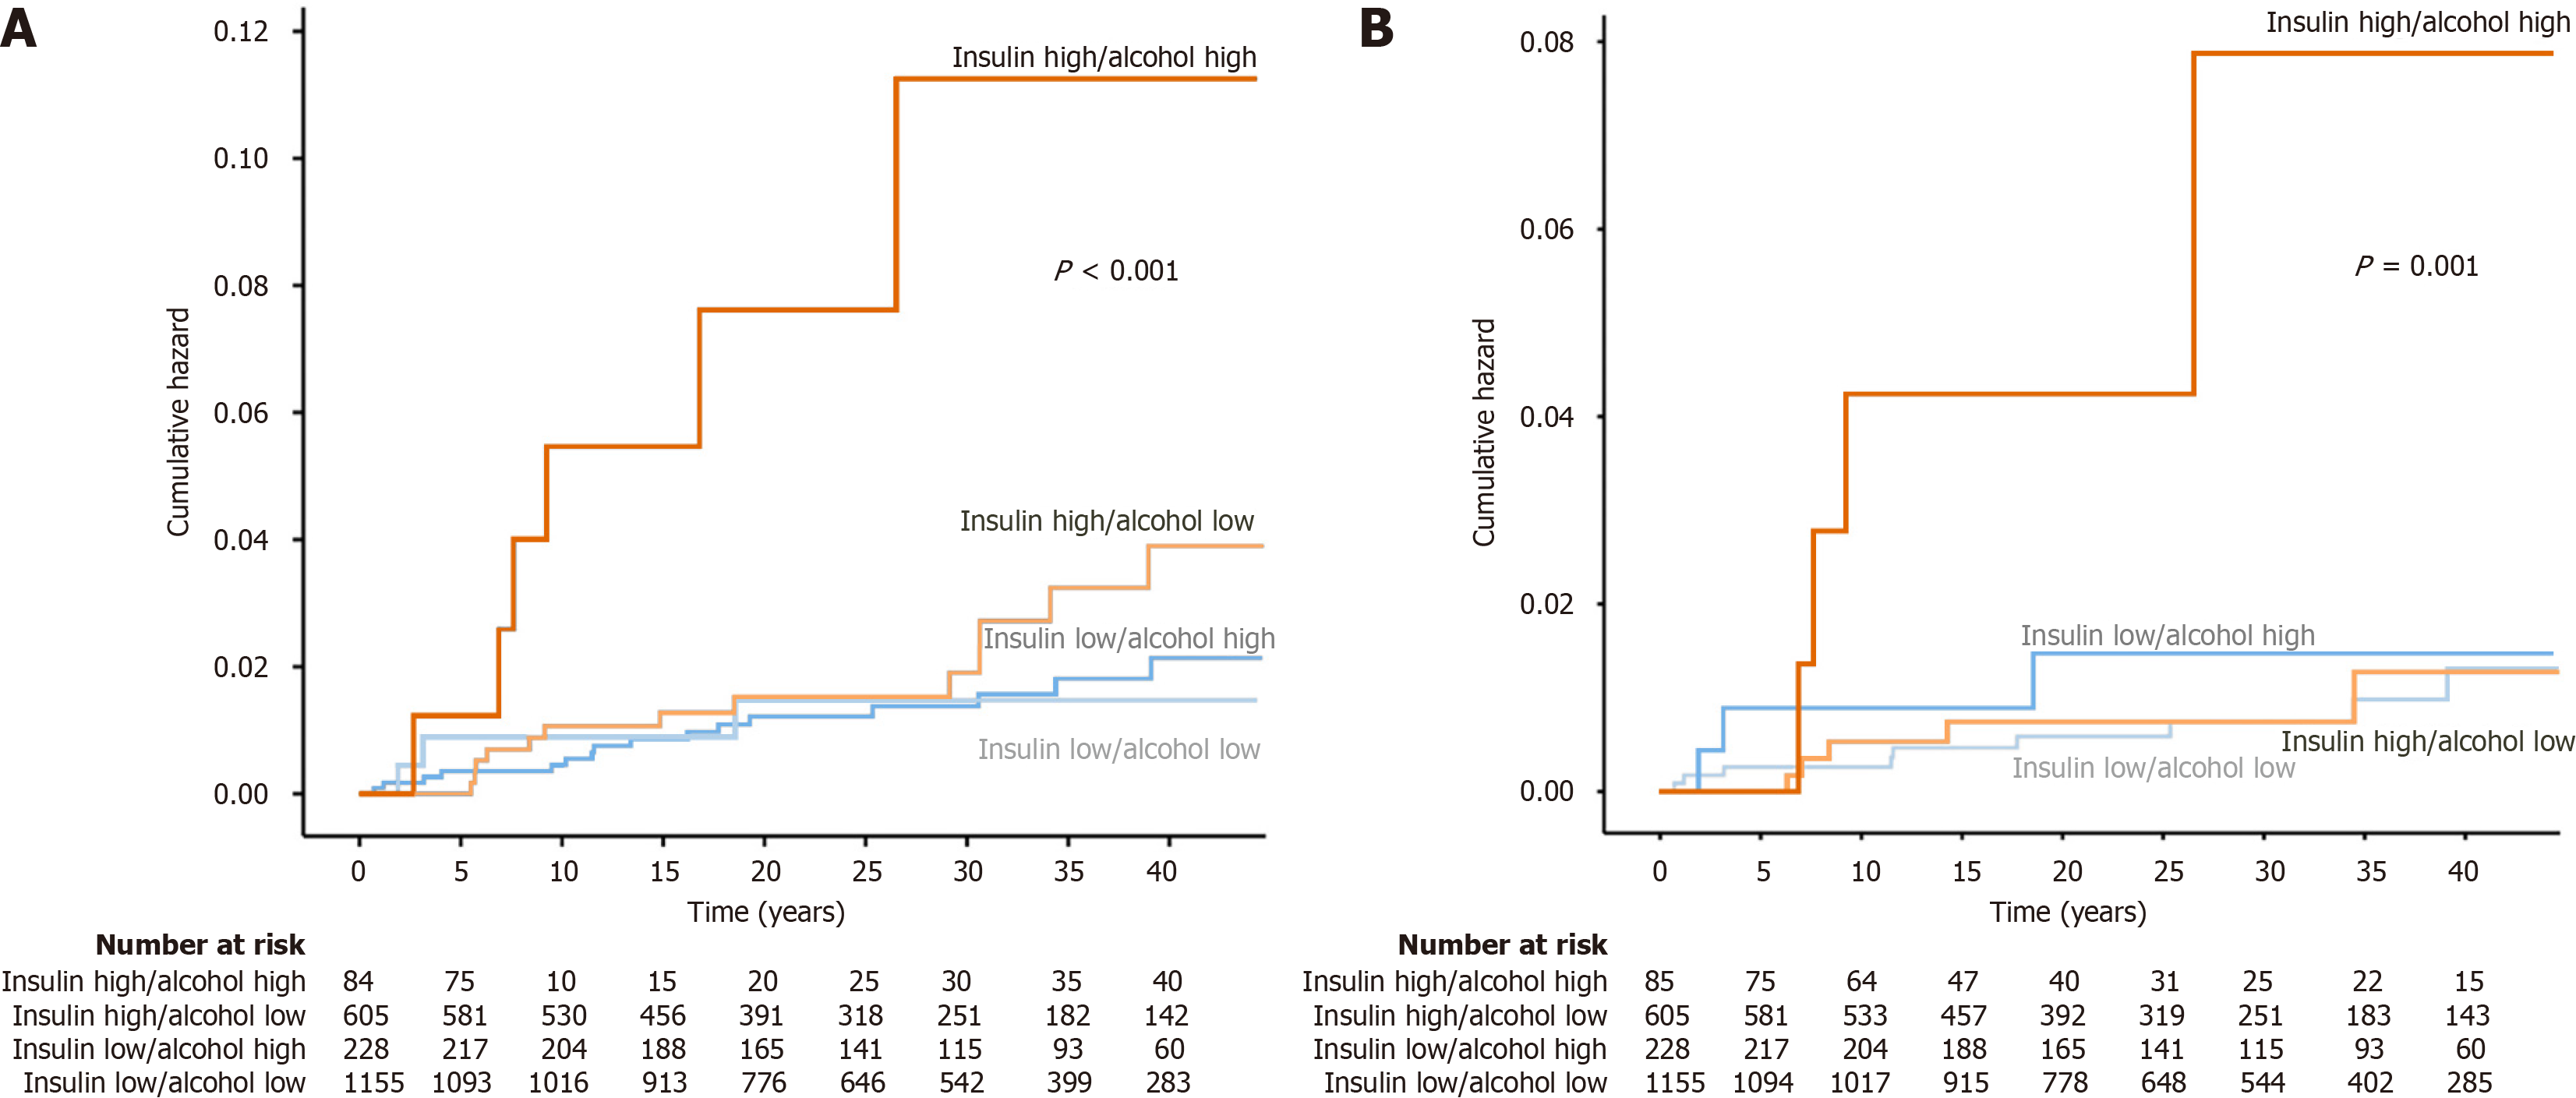
Figure 3 Cumulative hazard function for incident cases related to insulin and alcohol categories.
A: Liver disease; B: Liver cirrhosis. Insulin high represents the upper tertile of insulin levels, insulin low represents the middle and lower tertile. Alcohol high represents consumption above metabolic dysfunction-associated steatohepatitis cut-offs. P value indicates log-rank test for overall comparison.
- Citation: Schult A, Mehlig K, Svärdsudd K, Wallerstedt S, Björkelund C, Hansson PO, Zetterberg H, Kaczynski J. Association between insulin and liver function tests, liver disease and cirrhosis in population-based cohorts with long term follow-up. World J Hepatol 2025; 17(6): 107160
- URL: https://www.wjgnet.com/1948-5182/full/v17/i6/107160.htm
- DOI: https://dx.doi.org/10.4254/wjh.v17.i6.107160


