Copyright
©The Author(s) 2025.
World J Hepatol. Jun 27, 2025; 17(6): 103217
Published online Jun 27, 2025. doi: 10.4254/wjh.v17.i6.103217
Published online Jun 27, 2025. doi: 10.4254/wjh.v17.i6.103217
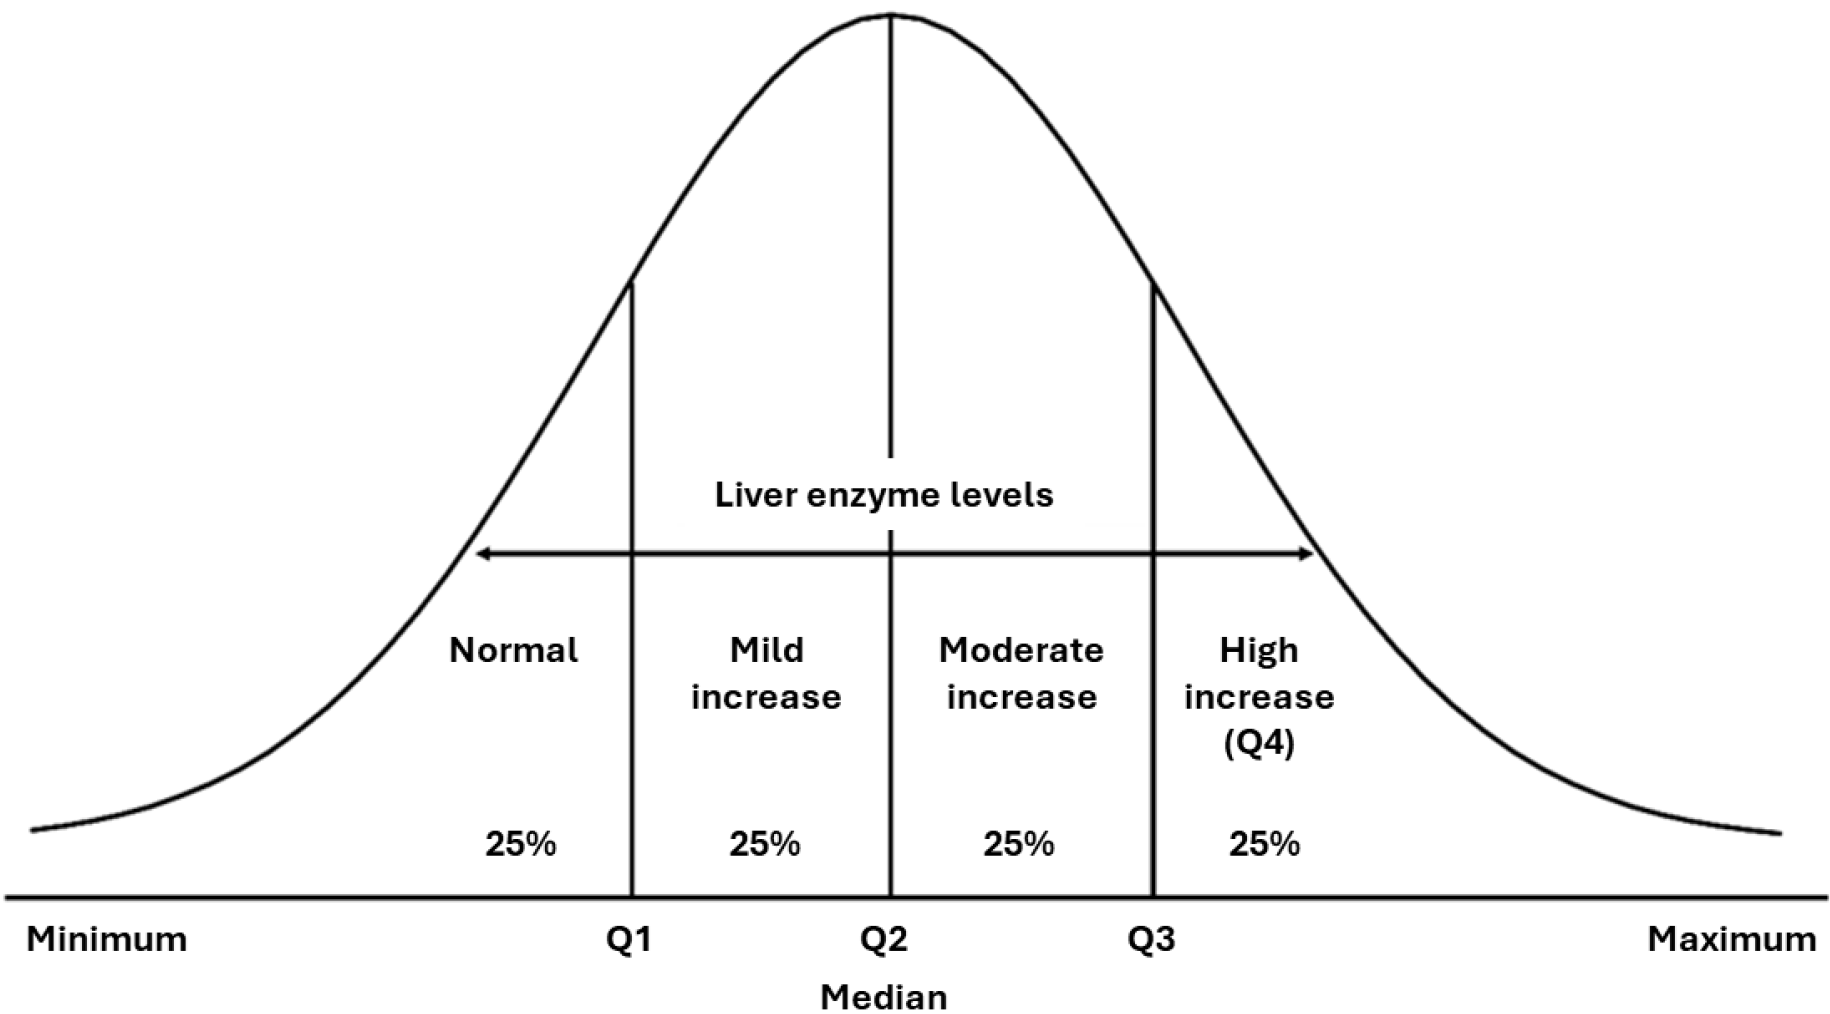
Figure 1 Spectrum of non-alcoholic fatty liver disease severity, based on the statistical distribution of liver enzyme levels (subgroup of interest 1).
Q: Quartile.
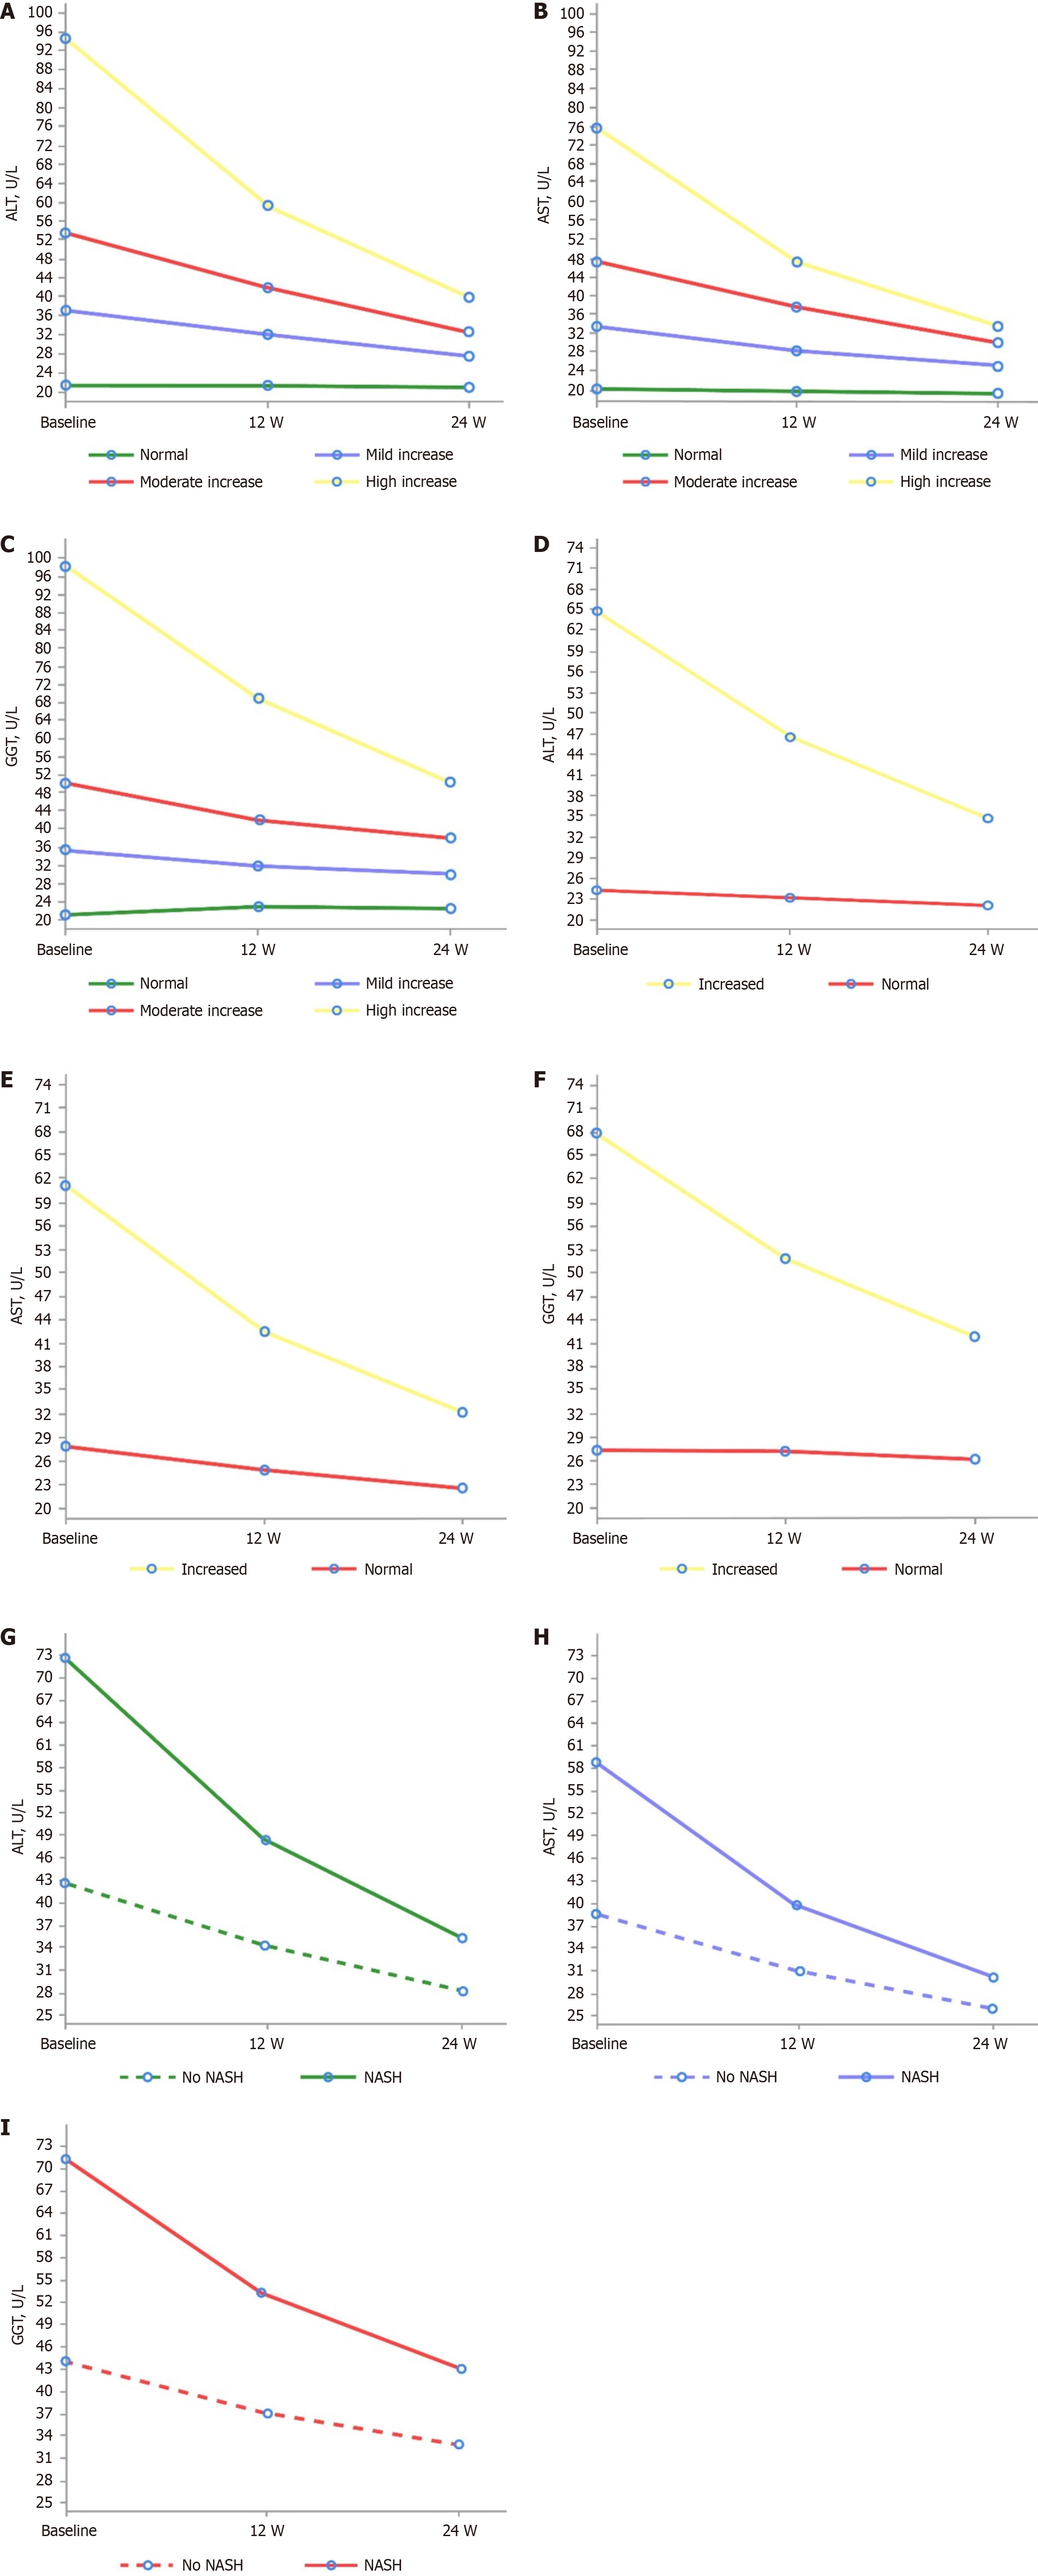
Figure 2 Changes in liver enzyme levels throughout the 24-week period for each subgroup of interest (1, 2 and 3).
A: Alanine aminotransferase (ALT) levels for subgroup of interest 1; B: Aspartate aminotransferase (AST) levels for subgroup of interest 1; C: Gamma-glutamyl transferase (GGT) levels for subgroup of interest 1; D: ALT levels for subgroup of interest 2; E: AST levels for subgroup of interest 2; F: GGT levels for subgroup of interest 2; G: ALT levels for subgroup of interest 3; H: AST levels for subgroup of interest 3; I: GGT levels for subgroup of interest 3. NASH: Non-alcoholic steatohepatitis; W: Week.
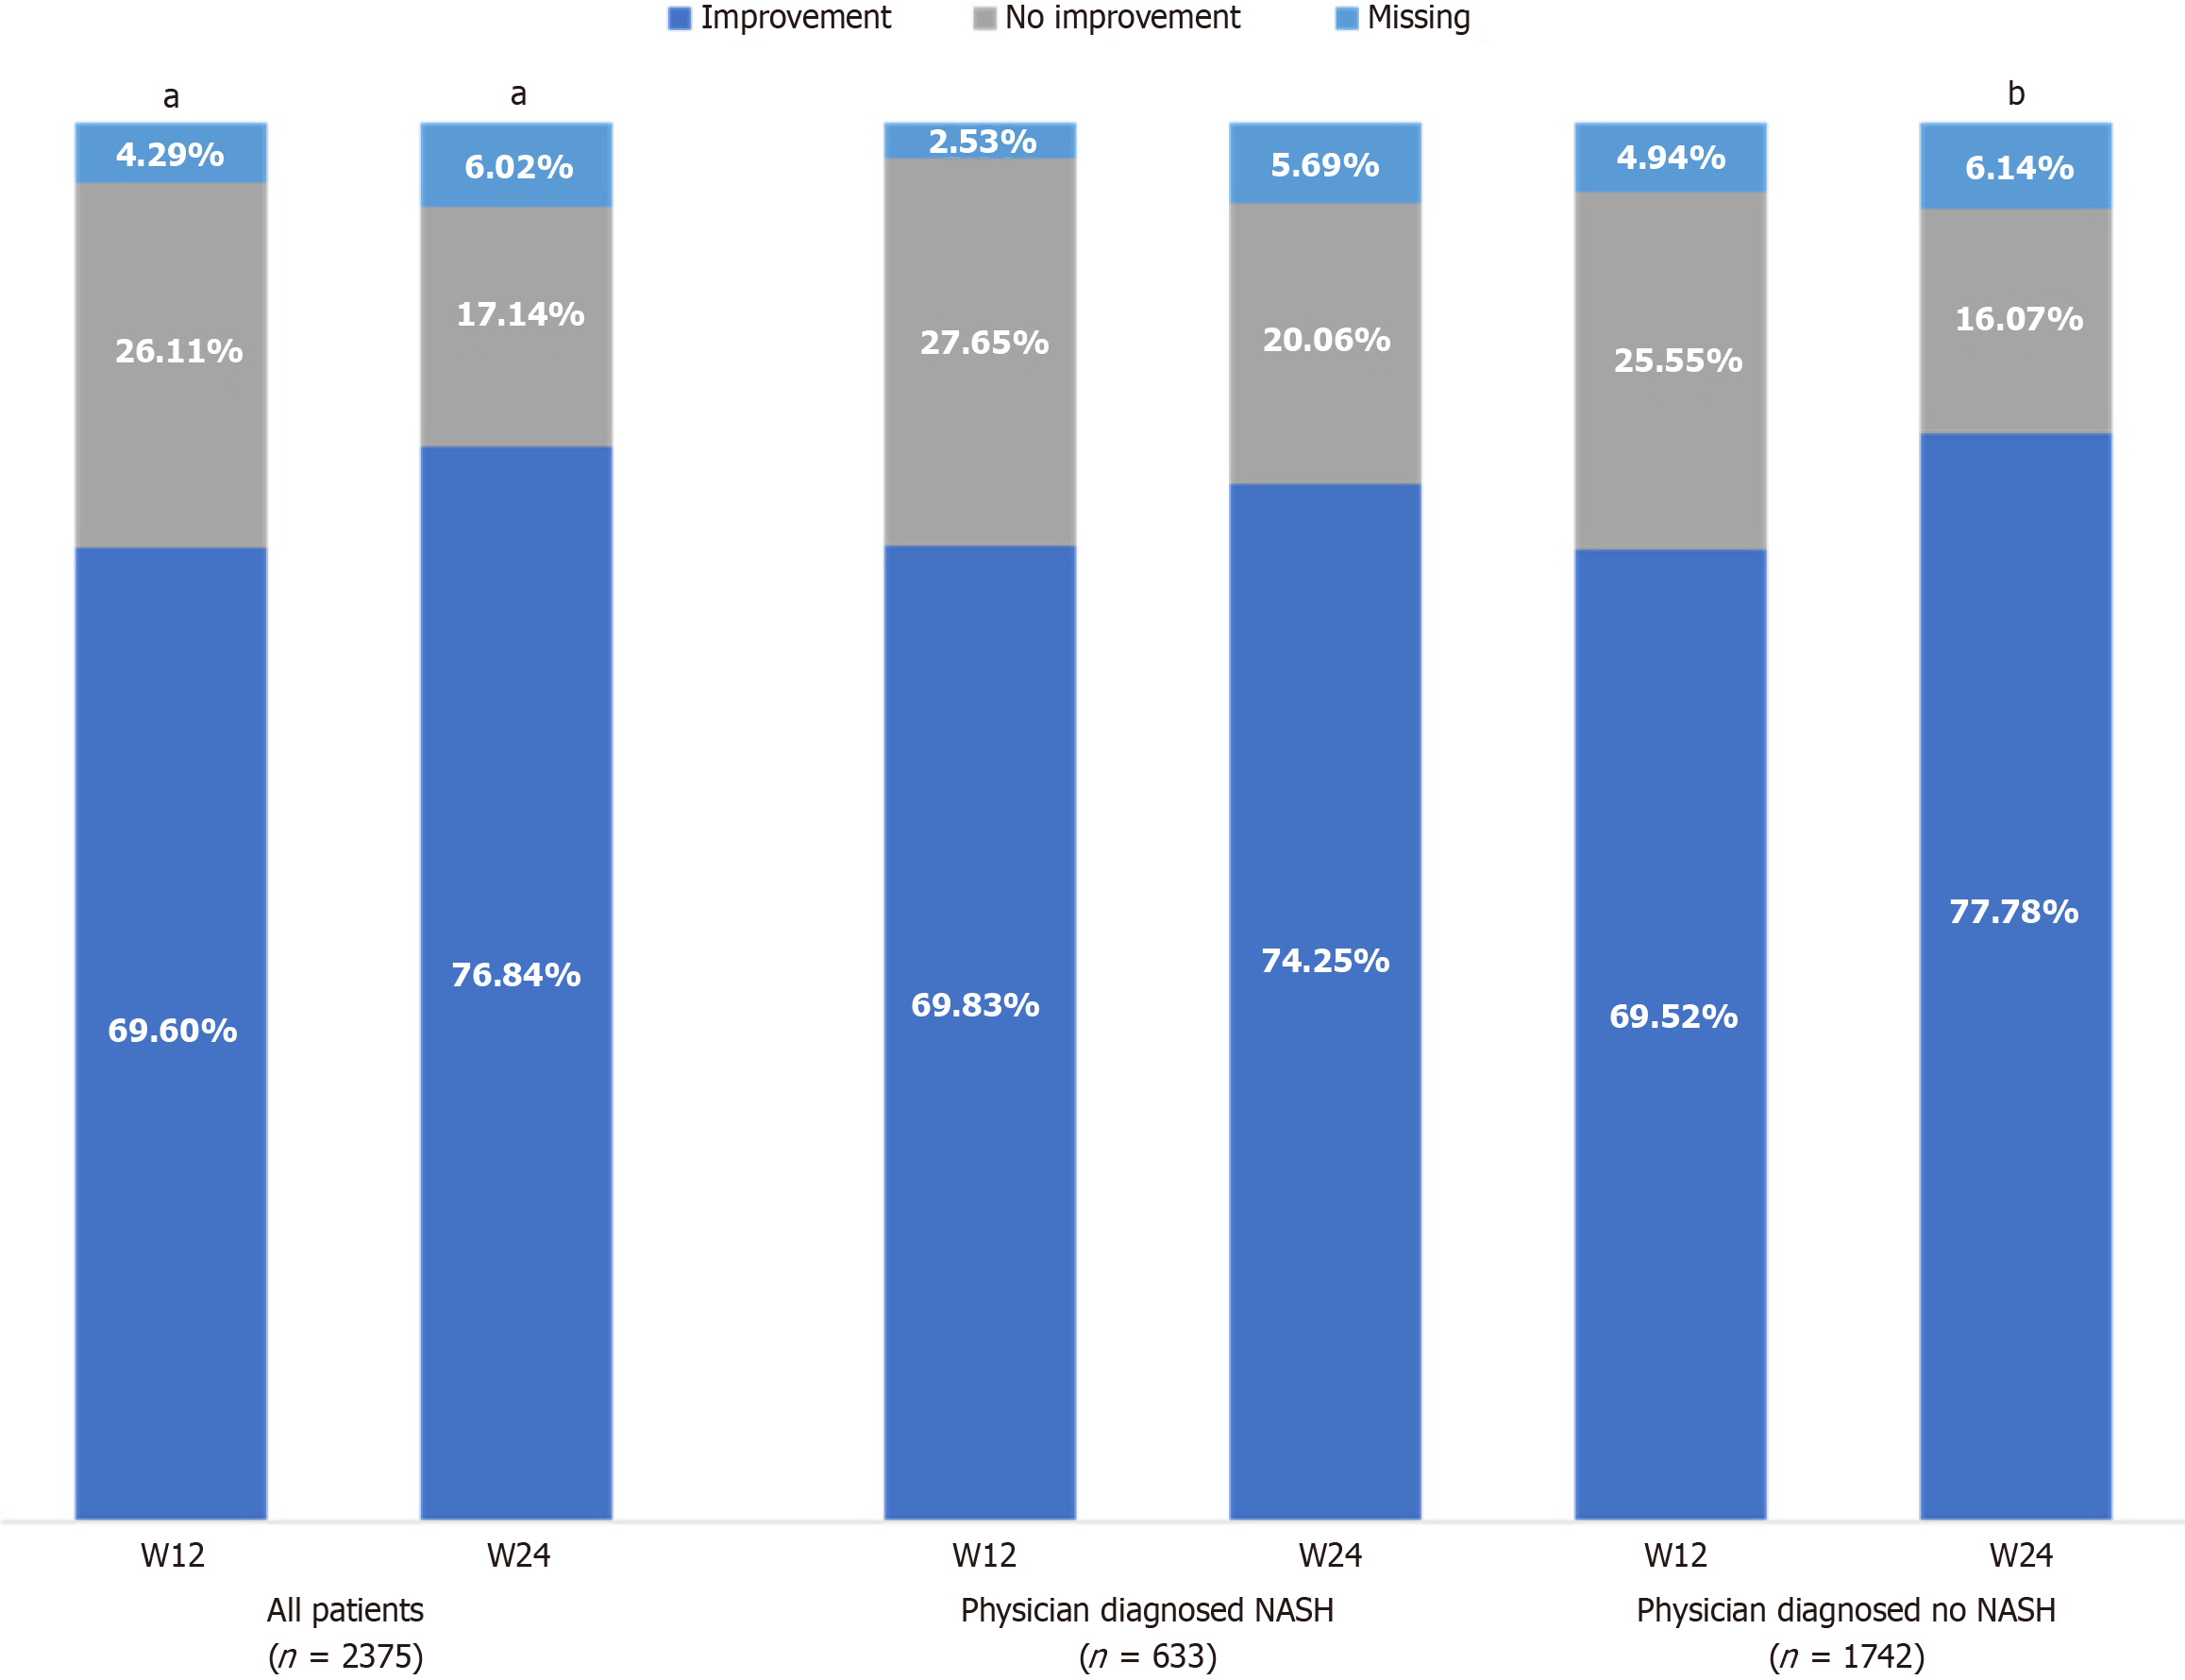
Figure 3 Changes in diffuse liver hyperechogenicity at week 12 and week 24 in the overall population and stratified by non-alcoholic steatohepatitis diagnosis.
aP value < 0.05 for significant difference at week 12 or week 24 vs baseline. bP value < 0.05 for significant difference between groups at week 12 or week 24. NASH: Non-alcoholic steatohepatitis; W: Week.
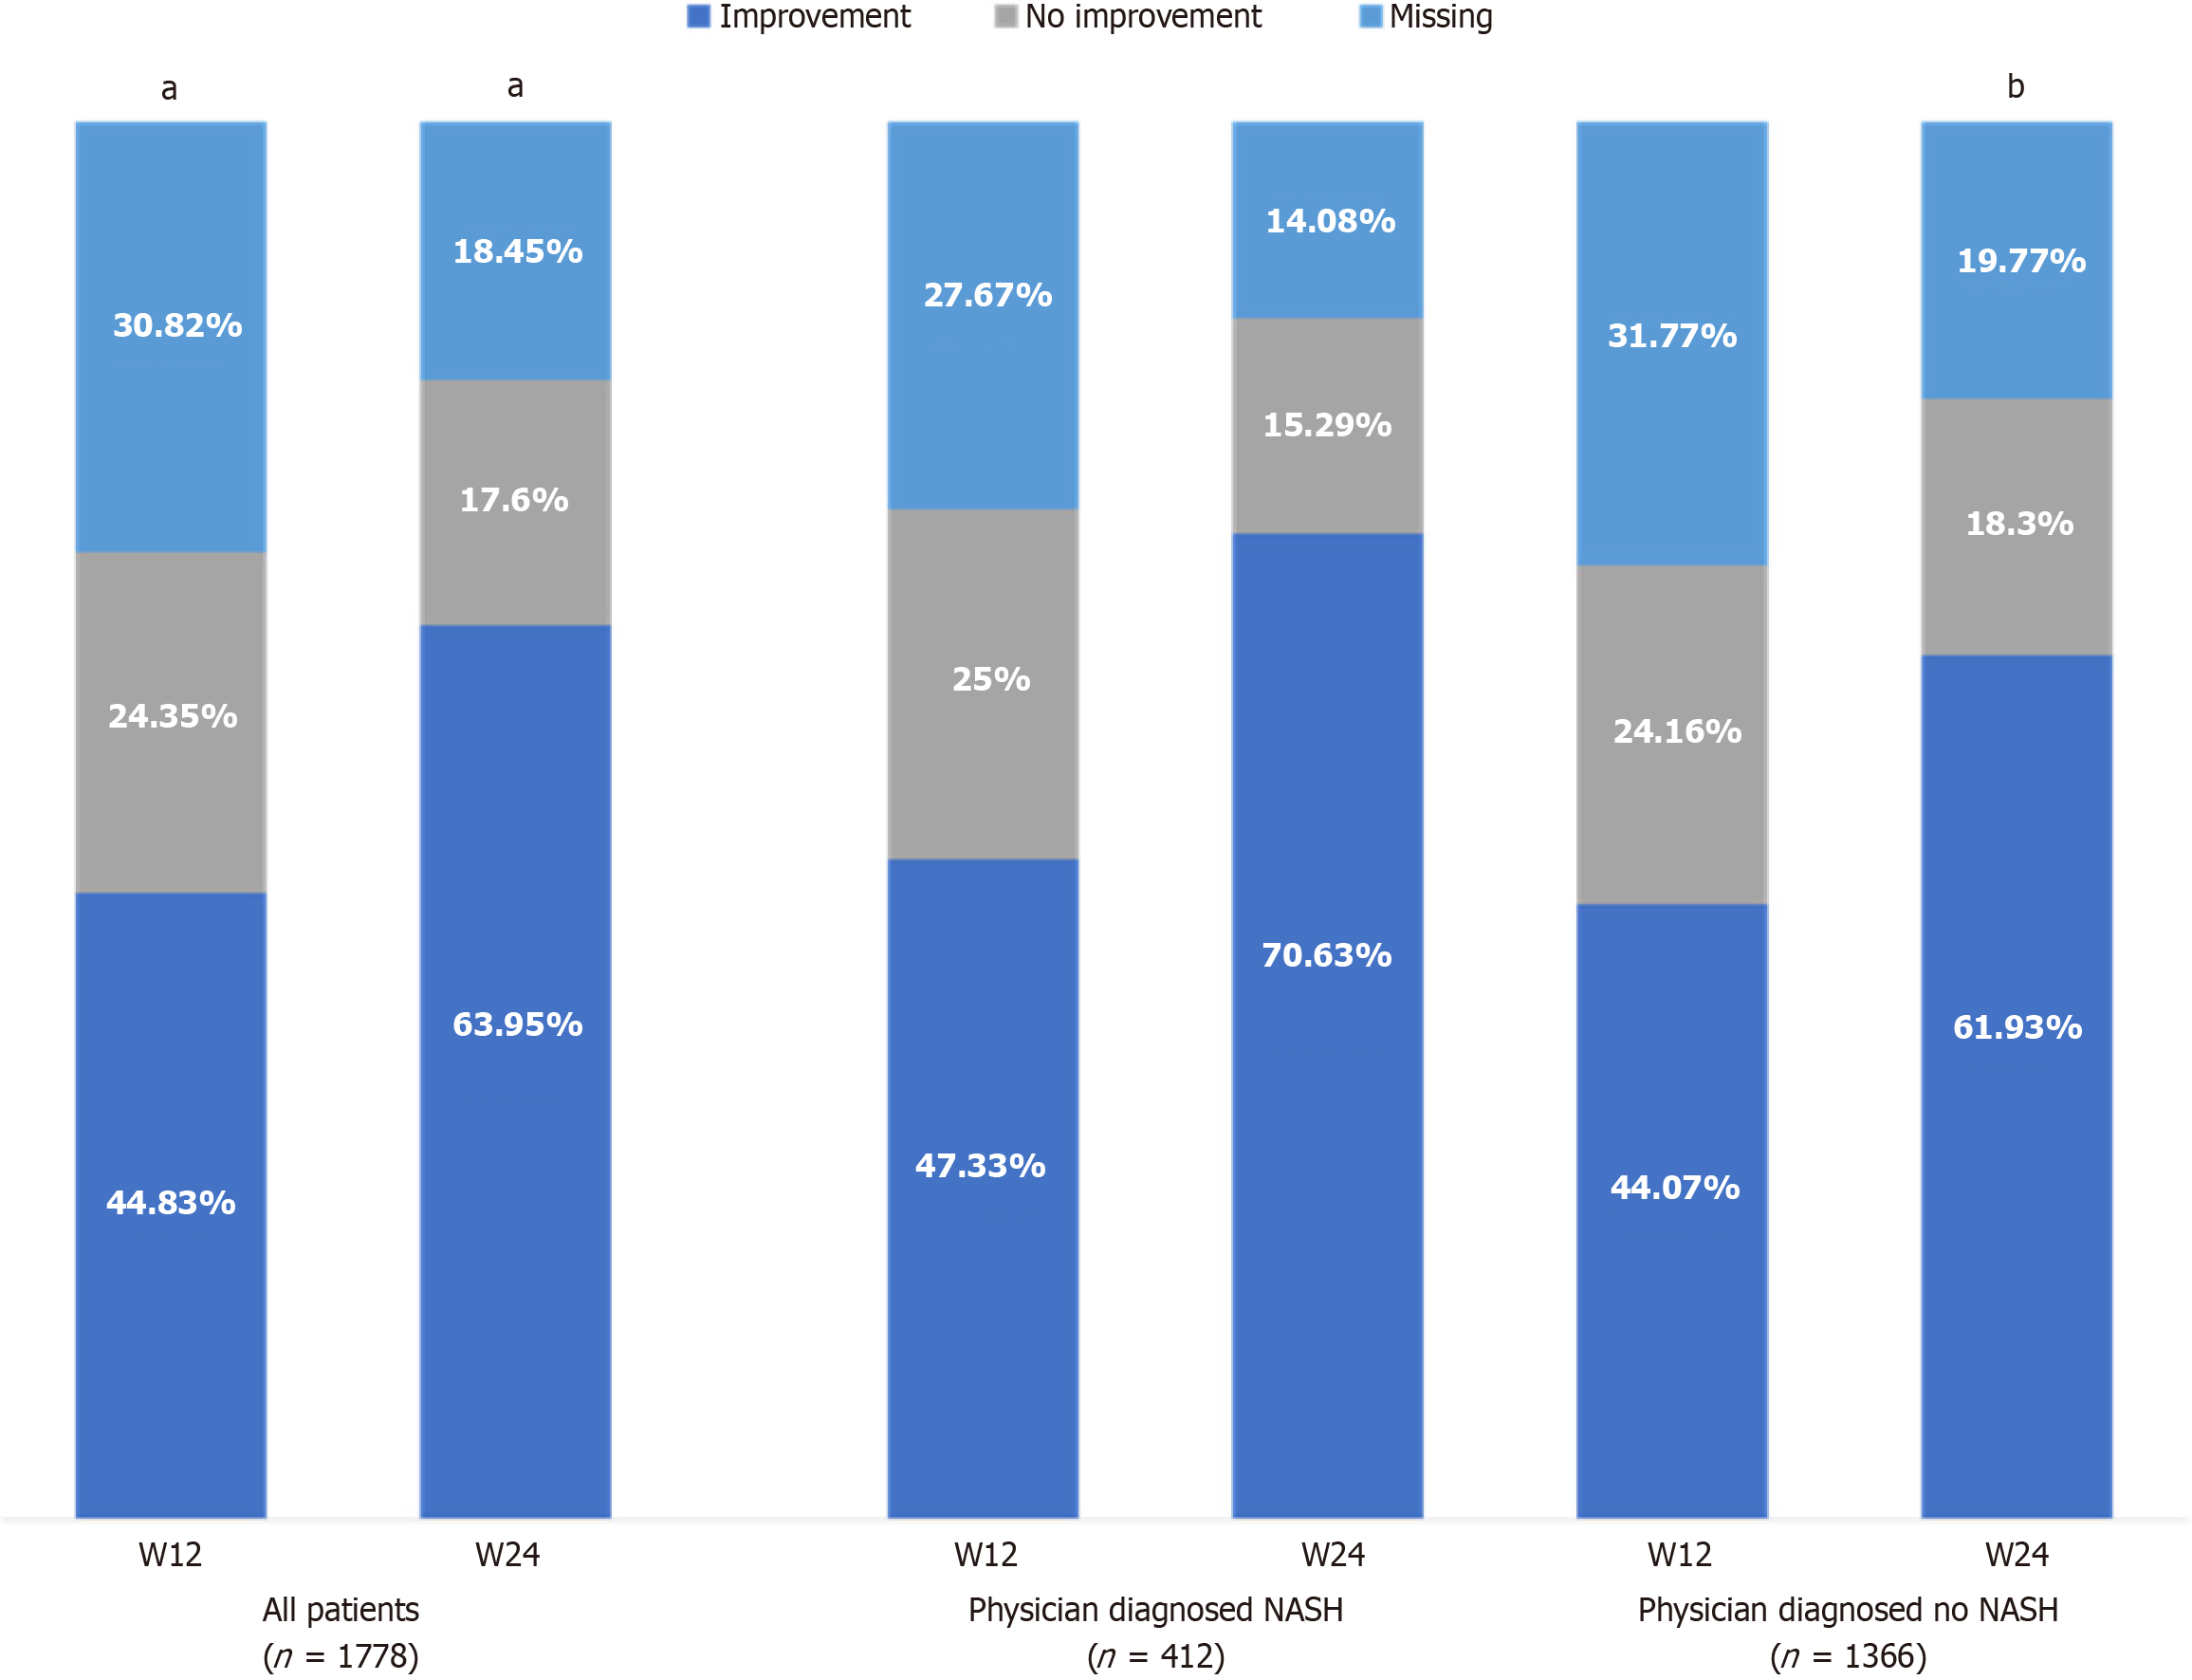
Figure 4 Changes in heterogeneous liver structure at week 12 and week 24 in the overall population and stratified by non-alcoholic steatohepatitis diagnosis.
aP value < 0.05 for significant difference at week 12 or week 24 vs baseline. bP value < 0.05 for significant difference between groups at week 12 or week 24. NASH: Non-alcoholic steatohepatitis.
- Citation: Dajani AI, Popovic B, Amand C, Tong S, Starostin KM, Goncharuk V. MANPOWER study: Real-world post-hoc analysis assessing essential phospholipids for non-alcoholic fatty liver disease from the Russian registry. World J Hepatol 2025; 17(6): 103217
- URL: https://www.wjgnet.com/1948-5182/full/v17/i6/103217.htm
- DOI: https://dx.doi.org/10.4254/wjh.v17.i6.103217


