Copyright
©The Author(s) 2023.
World J Hepatol. Feb 27, 2023; 15(2): 311-317
Published online Feb 27, 2023. doi: 10.4254/wjh.v15.i2.311
Published online Feb 27, 2023. doi: 10.4254/wjh.v15.i2.311
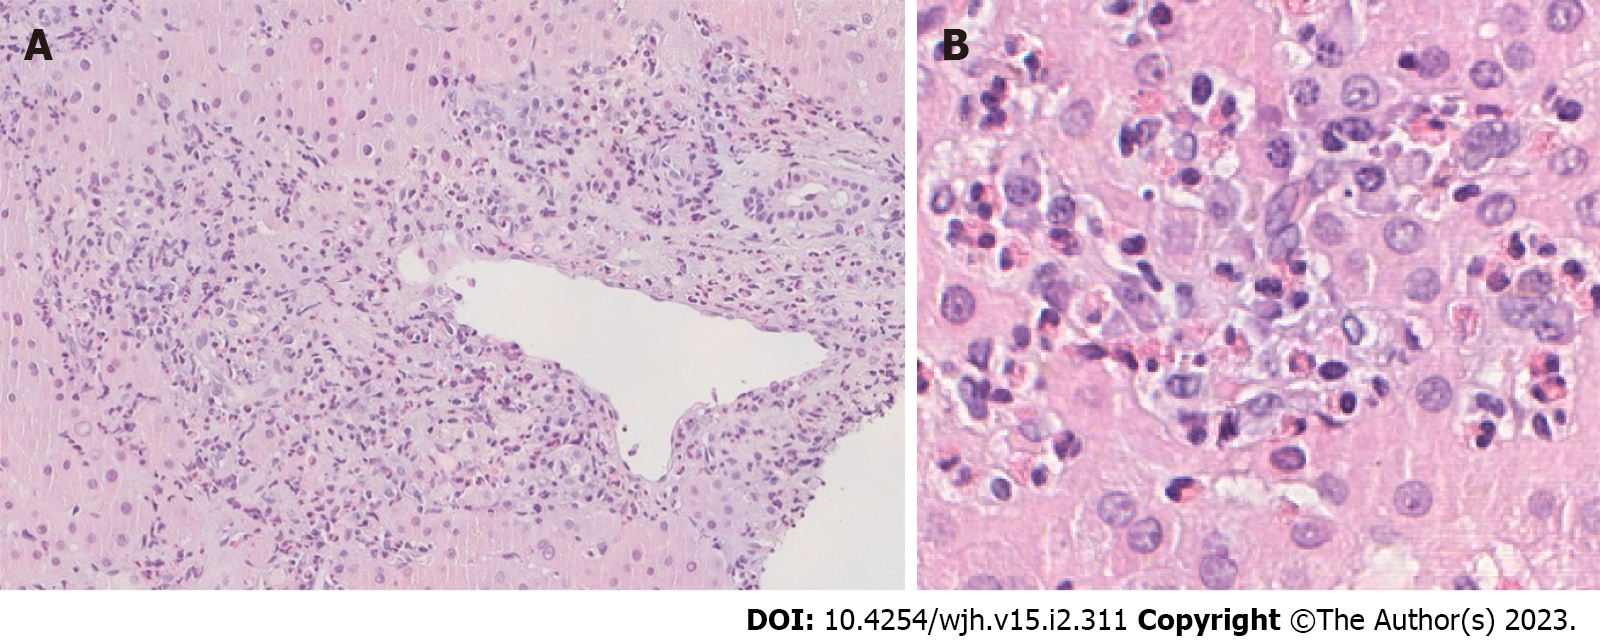
Figure 1 Liver biopsy.
A: Portal tract inflammation with intense lymphoplasmacytic infiltrate and interface hepatitis (HE ×20); B: Intralobular hepatic parenchyma with numerous eosinophils (HE ×400).
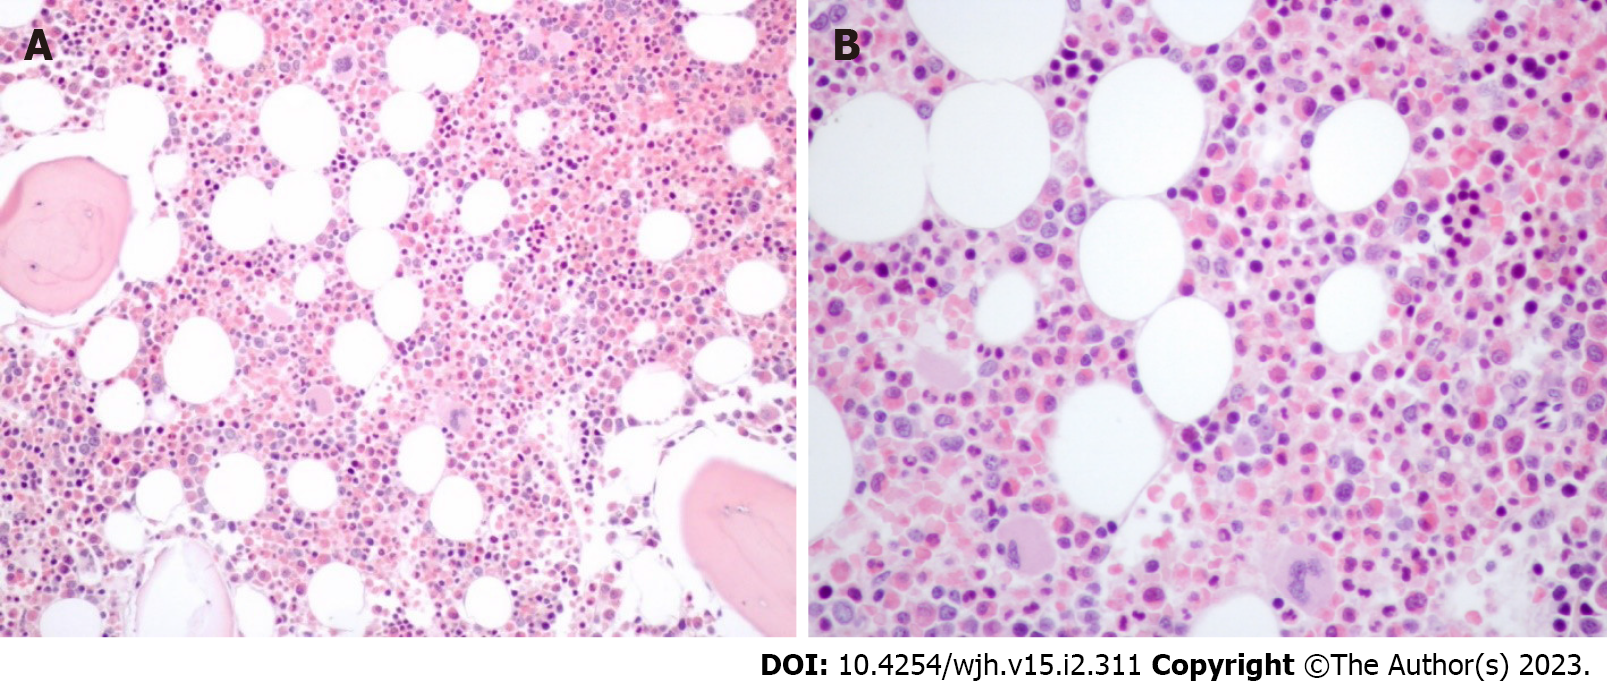
Figure 2 Bone marrow biopsy.
A: Bone marrow slightly hyperplastic, trilinear, with myeloid predominance and eosinophilia (HE ×100); B: Increased number of eosinophils (both precursors and mature forms) (HE, ×400).
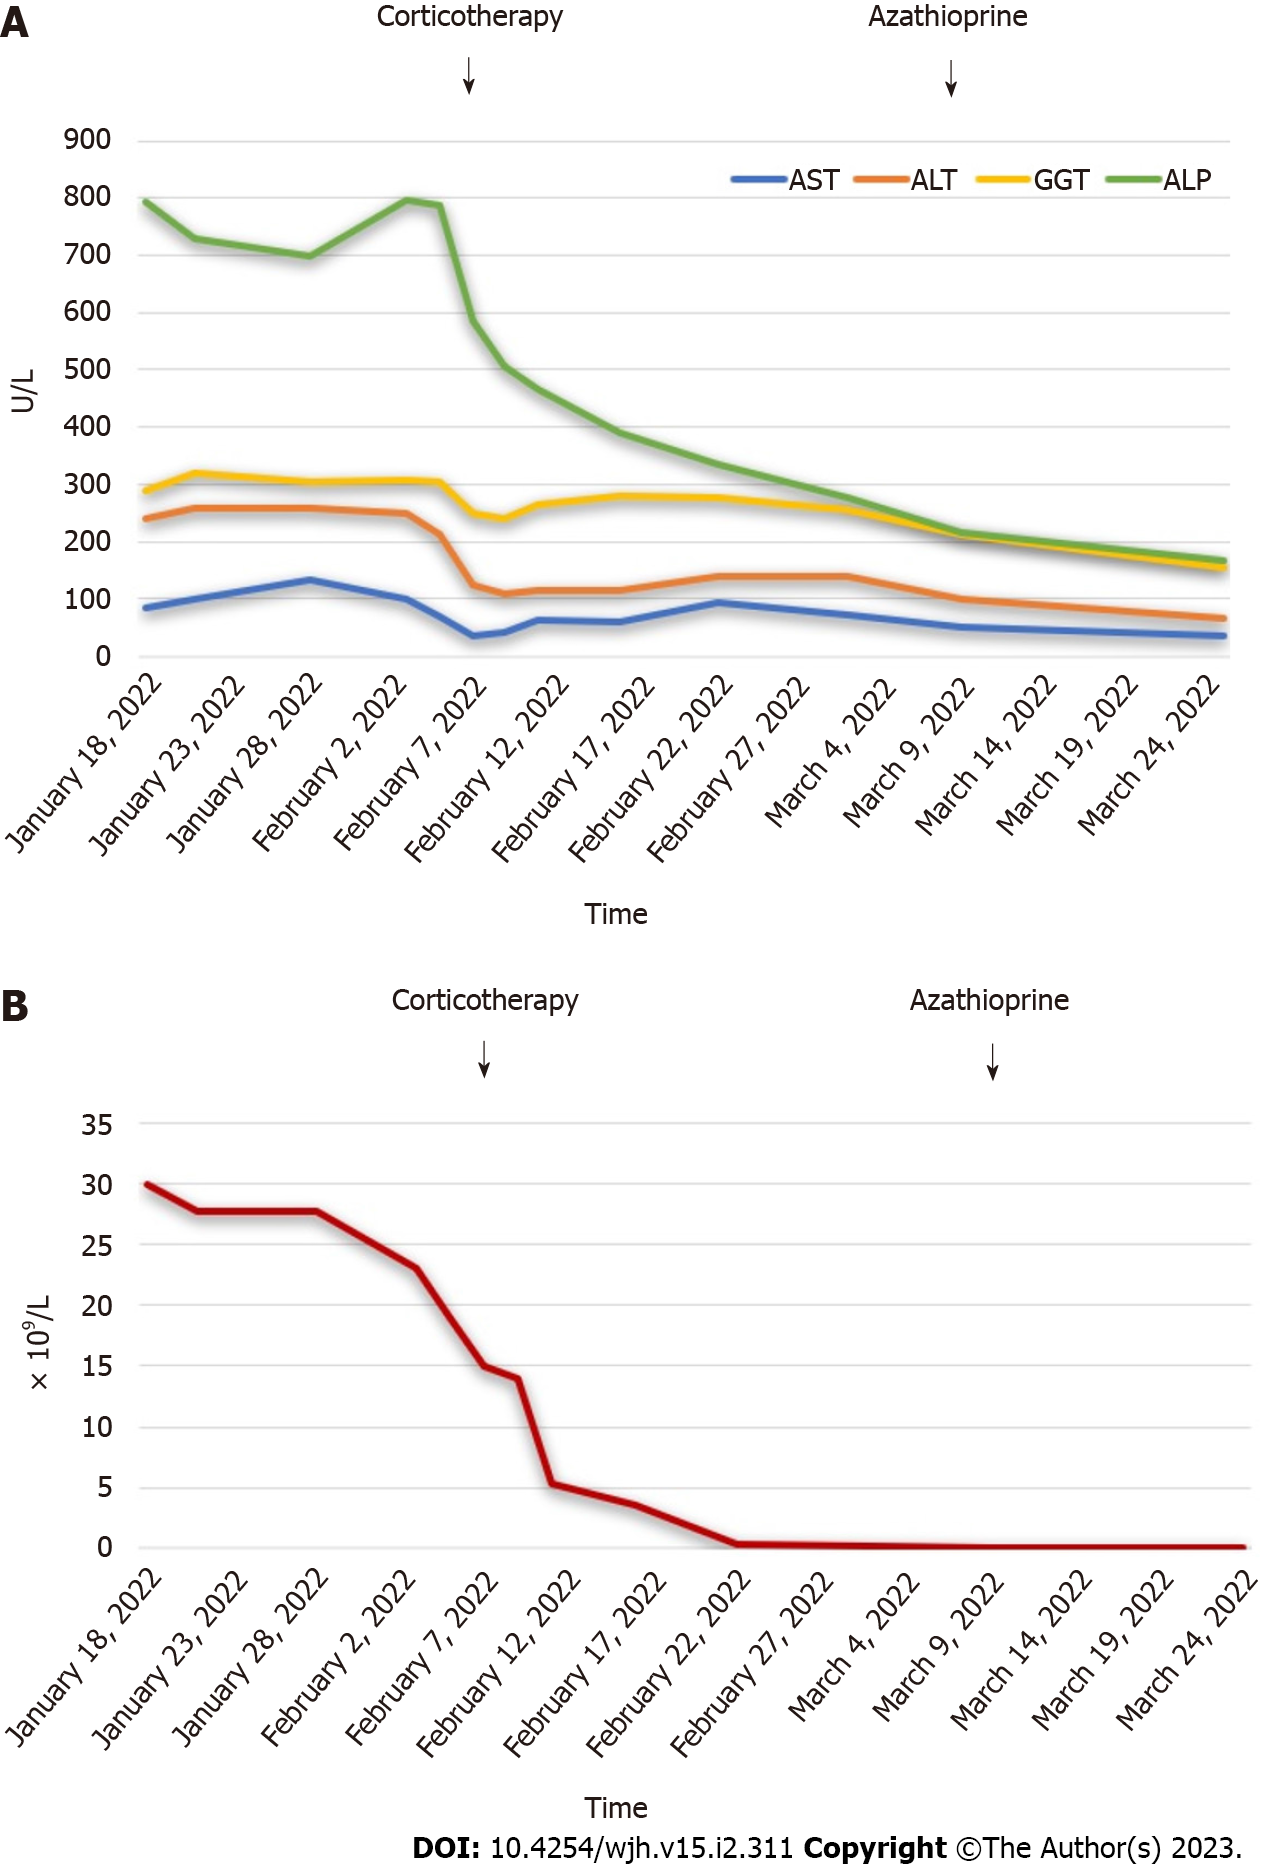
Figure 3 Follow-up.
A: Evolution of liver function tests; B: Evolution of eosinophil count.
- Citation: Garrido I, Lopes S, Fonseca E, Carneiro F, Macedo G. Autoimmune hepatitis and eosinophilia: A rare case report. World J Hepatol 2023; 15(2): 311-317
- URL: https://www.wjgnet.com/1948-5182/full/v15/i2/311.htm
- DOI: https://dx.doi.org/10.4254/wjh.v15.i2.311


