Copyright
©The Author(s) 2022.
World J Hepatol. Jul 27, 2022; 14(7): 1480-1494
Published online Jul 27, 2022. doi: 10.4254/wjh.v14.i7.1480
Published online Jul 27, 2022. doi: 10.4254/wjh.v14.i7.1480
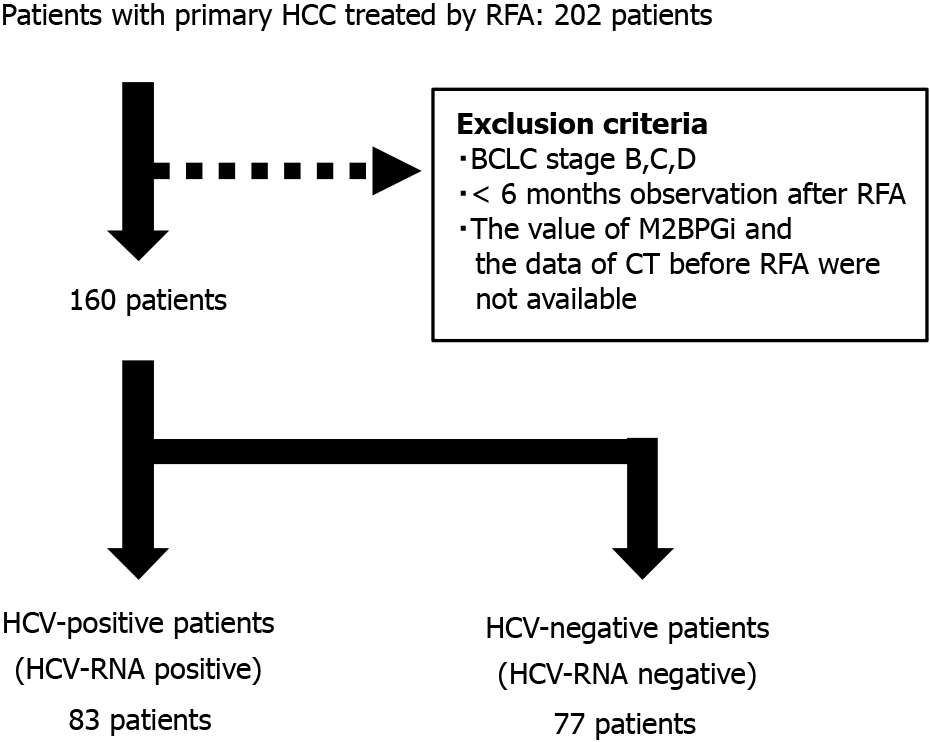
Figure 1 Patients’ flow.
HCV: Hepatitis C virus; HCC: Hepatocellular carcinoma; RFA: Radiofrequency ablation; BCLC: Barcelona Clinic Liver Cancer; CT: Computed tomography.
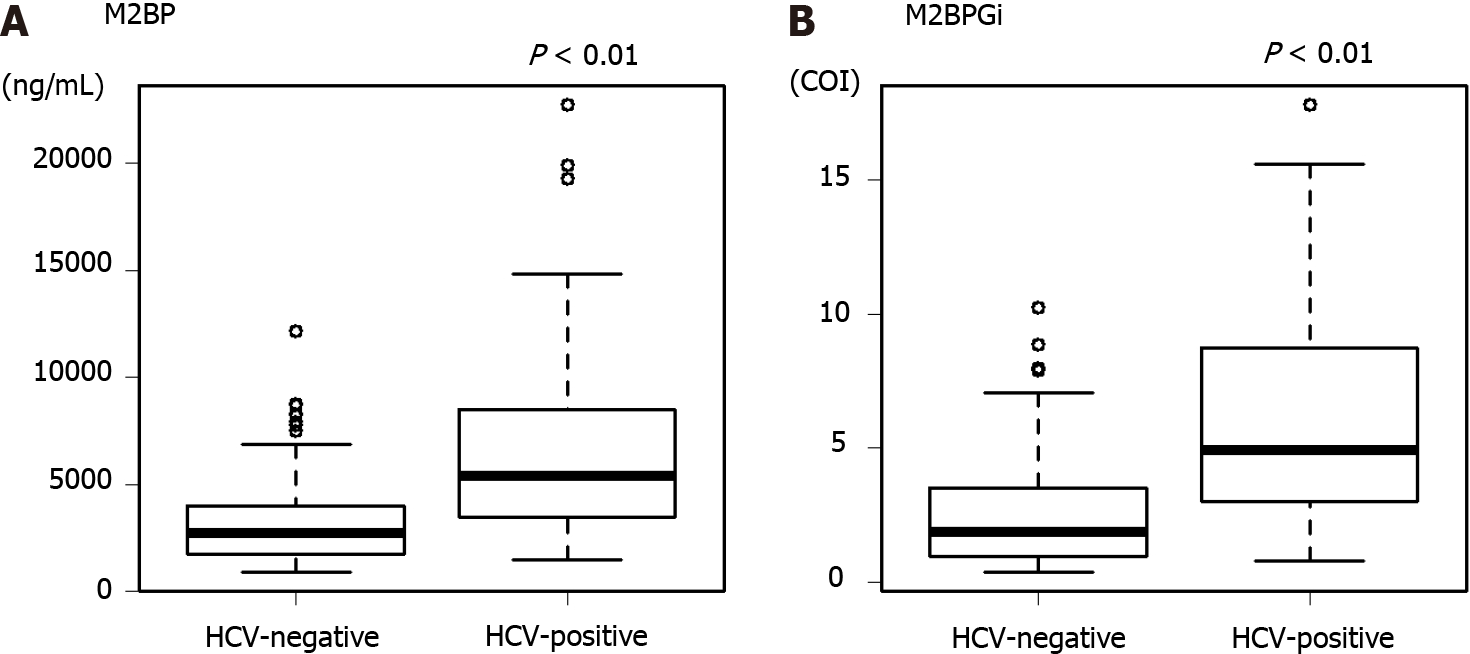
Figure 2 The value of Mac-2 binding protein and Mac-2 binding protein glycosylation isomer in hepatitis C virus-positive and -negative patients.
A: The values of Mac-2 binding protein in hepatitis C virus (HCV)-negative and -positive groups; B: The values of Mac-2 binding protein glycosylation isomer in HCV-negative and -positive groups. The box charts for the Y-axis indicate the median as bold lines in the boxes, 25th and 75th percentiles as boxes, and 10th and 90th percentiles as lines for each edge. HCV: Hepatitis C virus; M2BPGi: Mac-2 binding protein; M2BPGi: Mac-2 binding protein glycosylation isomer; COI: Cutoff index.
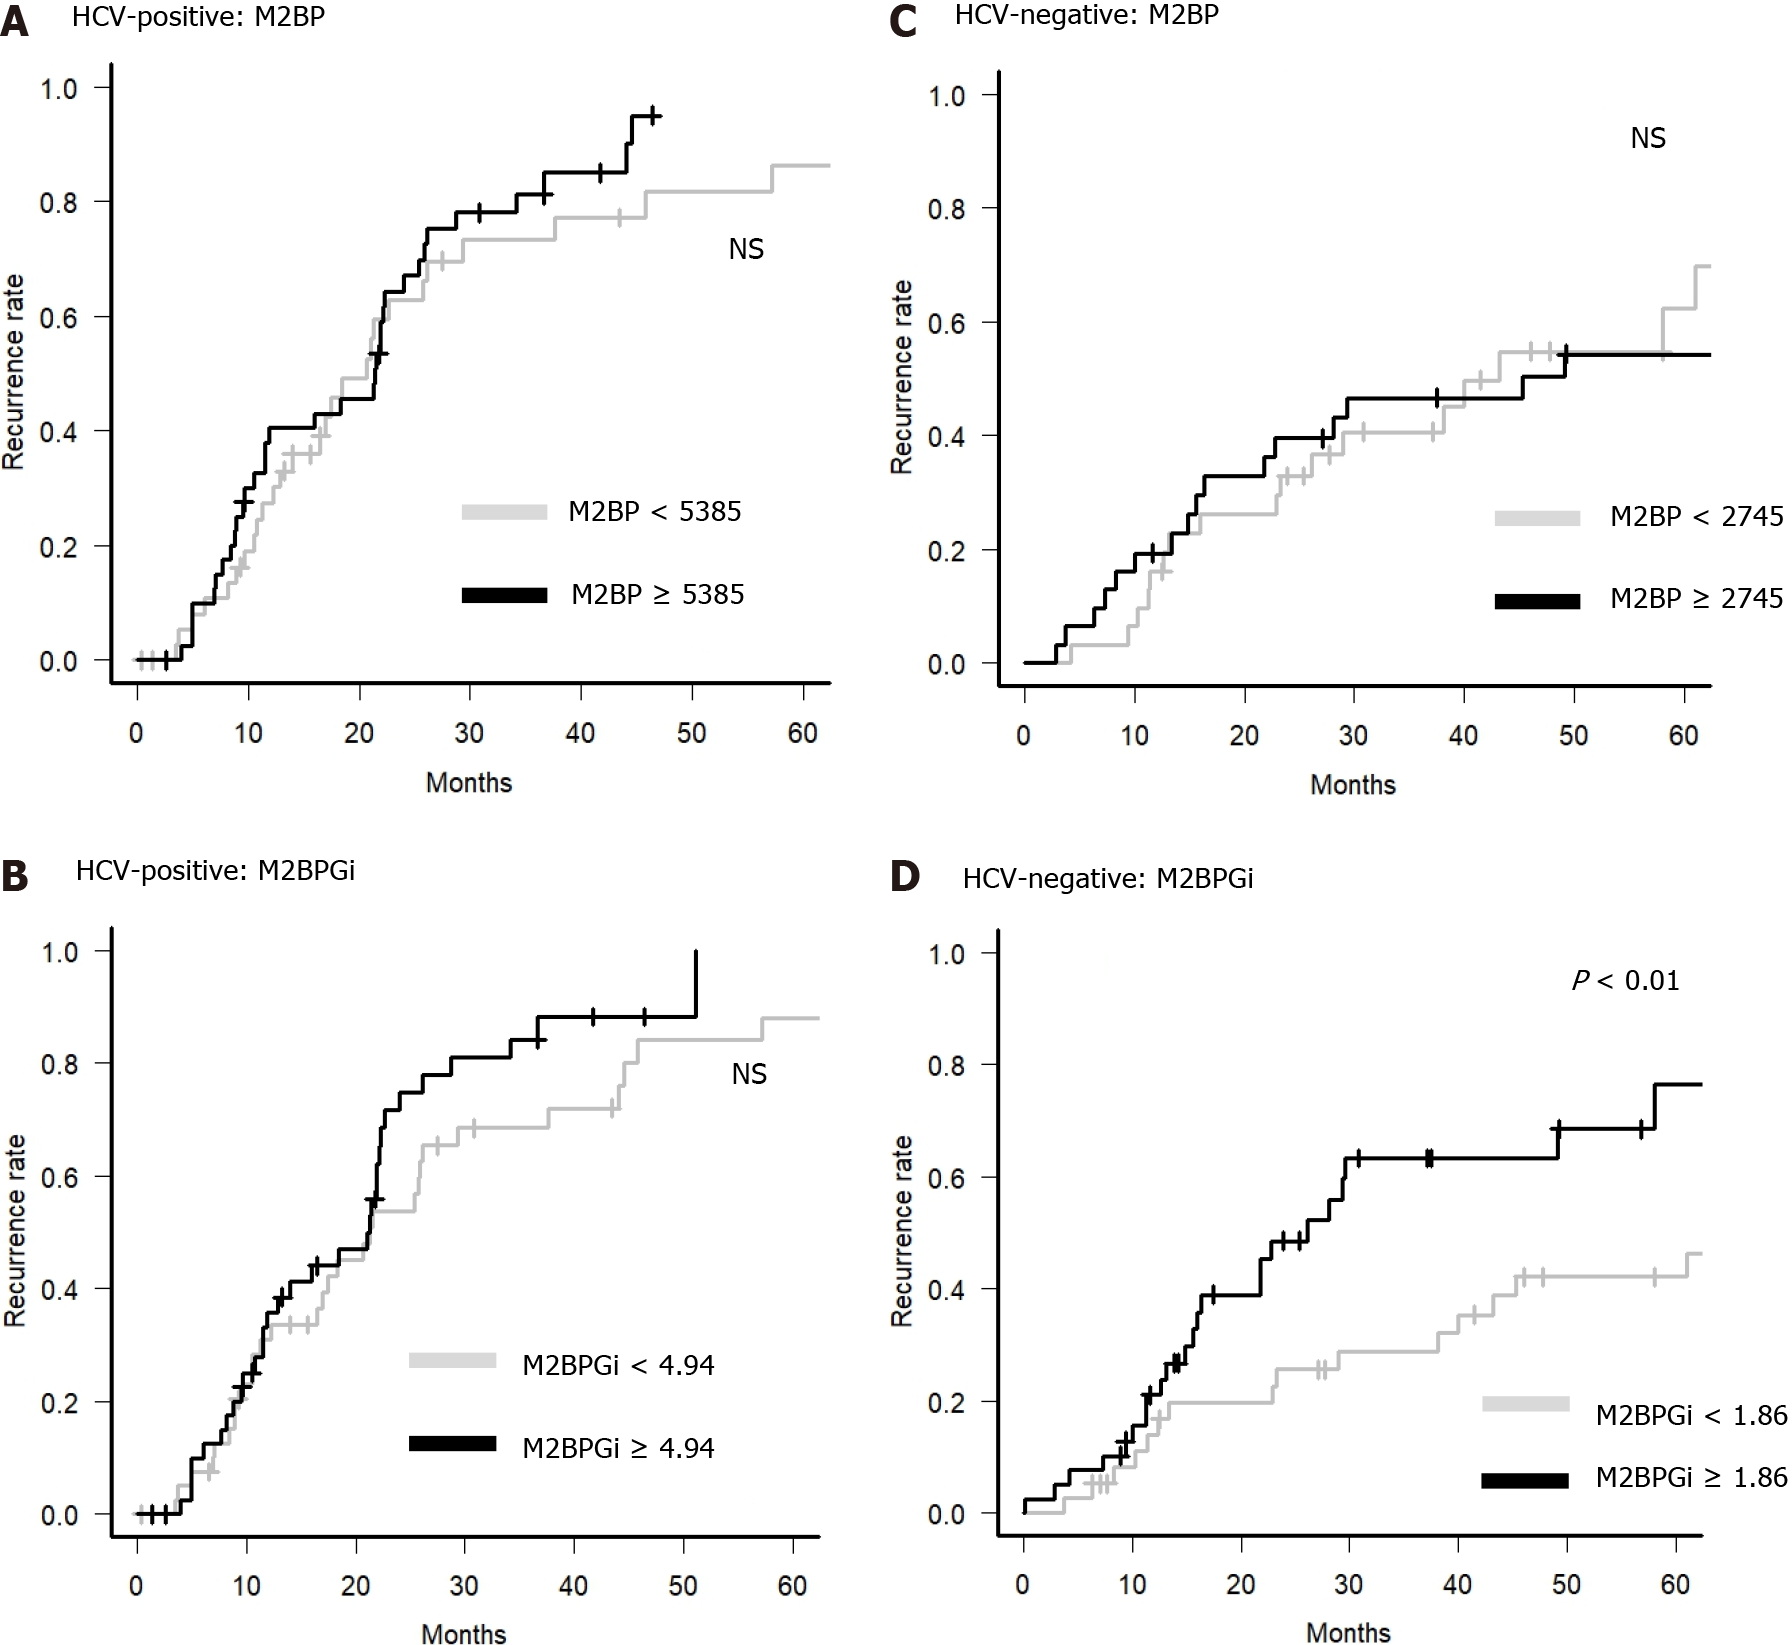
Figure 3 Recurrence rate according to the value of Mac-2 binding protein and Mac-2 binding protein glycosylation isomer.
The hepatocellular carcinoma recurrence rate was divided into two groups according to the value of Mac-2 binding protein (M2BP) or M2BP glycosylation isomer (M2BPGi) before radiofrequency ablation. A: Hepatitis C virus (HCV)-positive group divided by M2BP value. The gray line indicates patients with M2BP < 5385 ng/mL, and the black line indicates patients with M2BP ≥ 5385 ng/mL; B: HCV-positive group divided by M2BPGi value. The gray line indicates patients with M2BPGi < 4.94 cutoff index (COI), and the black line indicates patients with M2BPGi ≥ 4.94 COI; C: HCV-negative group divided by M2BP value. The gray line indicates patients with M2BP < 2745 ng/mL, and the black line indicates patients with M2BP ≥ 2745 ng/mL; D: HCV-negative group divided by M2BPGi value. The gray line indicates patients with M2BP < 1.86 COI, and the black line indicates patients with M2BPGi ≥ 1.86 COI. HCV: Hepatitis C virus; M2BPGi: Mac-2 binding protein; M2BPGi: Mac-2 binding protein glycosylation isomer; NS: No significance.
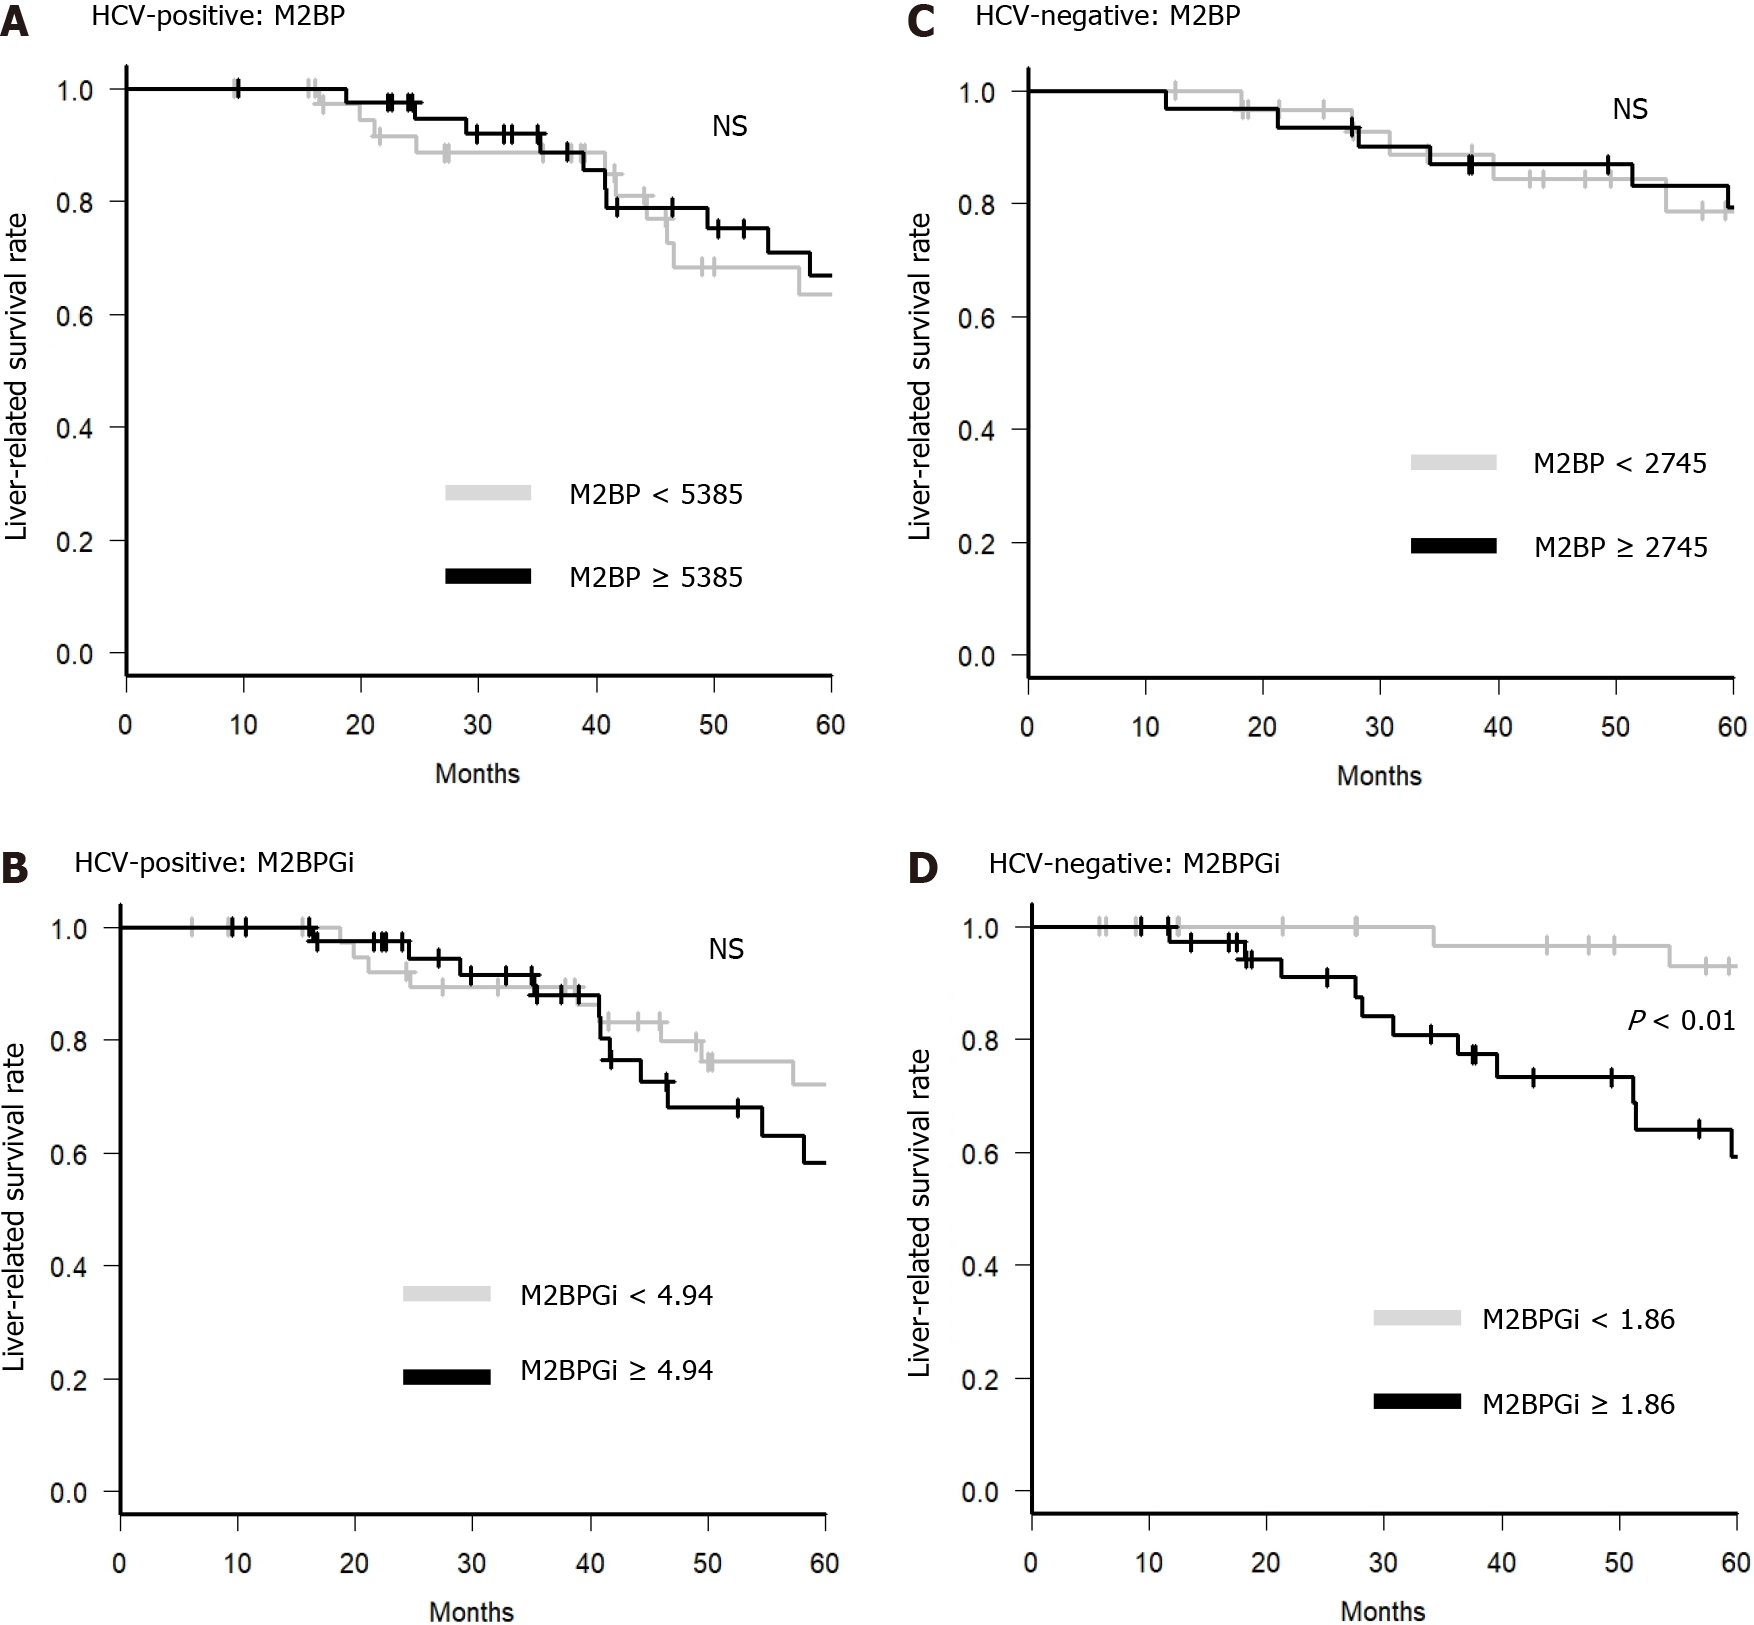
Figure 4 Survival rate according to the value of Mac-2 binding protein and Mac-2 binding protein glycosylation isomer.
The liver disease-related death-free survival rate was divided into two groups according to the value of Mac-2 binding protein (M2BP) or M2BP glycosylation isomer (M2BPGi) before radiofrequency ablation. A: Hepatitis C virus (HCV)-positive patients divided by M2BP value. The gray line indicates patients with M2BP < 5385 ng/mL, and the black line indicates patients with M2BP ≥ 5385 ng/mL; B: HCV-positive patients divided by M2BPGi value. The gray line indicates patients with M2BPGi < 4.94 cutoff index (COI), and the black line indicates patients with M2BPGi ≥ 4.94 COI; C: HCV-negative patients divided by M2BP value. The gray line indicates patients with M2BP < 2745 ng/mL, and the black line indicates patients with M2BP ≥ 2745 ng/mL; D: HCV-negative patients divided by M2BPGi value. The gray line indicates patients with M2BPGi < 1.86 COI, and the black line indicates patients with M2BPGi ≥ 1.86 COI. HCV: Hepatitis C virus; M2BPGi: Mac-2 binding protein; M2BPGi: Mac-2 binding protein glycosylation isomer; NS: No significance.
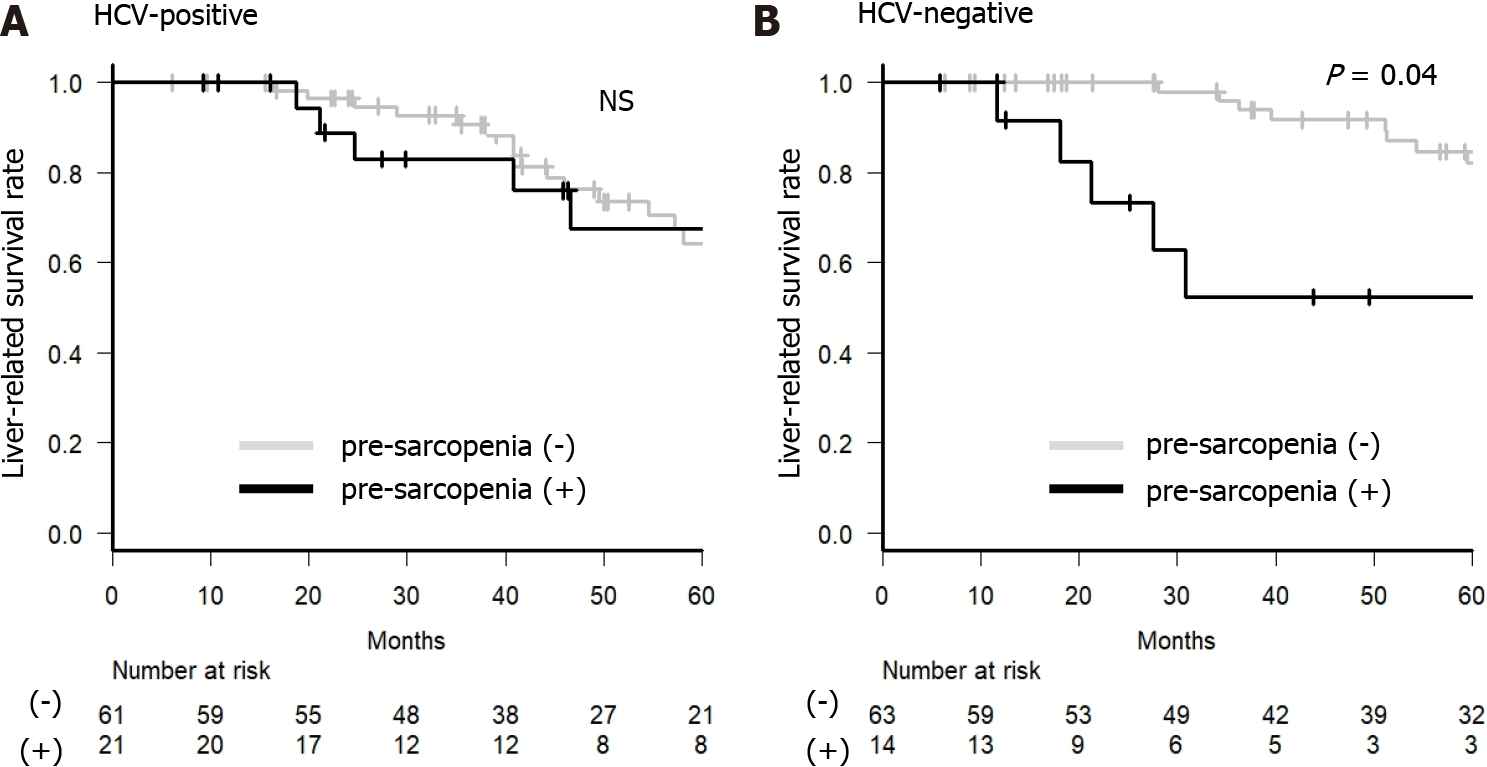
Figure 5 Survival rate with or without pre-sarcopenia.
The liver disease-related survival rate was divided into two groups according to the presence of pre-sarcopenia before radiofrequency ablation. A: Hepatitis C virus (HCV)-positive group; B: HCV-negative group. The gray line indicates patients without pre-sarcopenia, and the black line indicates patients with pre-sarcopenia. The numbers under each group indicate the number at risk for each group. HCV: Hepatitis C virus; M2BPGi: Mac-2 binding protein; M2BPGi: Mac-2 binding protein glycosylation isomer; NS: No significance.
- Citation: Nakai M, Morikawa K, Hosoda S, Yoshida S, Kubo A, Tokuchi Y, Kitagataya T, Yamada R, Ohara M, Sho T, Suda G, Ogawa K, Sakamoto N. Pre-sarcopenia and Mac-2 binding protein glycosylation isomer as predictors of recurrence and prognosis of early-stage hepatocellular carcinoma. World J Hepatol 2022; 14(7): 1480-1494
- URL: https://www.wjgnet.com/1948-5182/full/v14/i7/1480.htm
- DOI: https://dx.doi.org/10.4254/wjh.v14.i7.1480


