Copyright
©The Author(s) 2021.
World J Hepatol. Mar 27, 2021; 13(3): 328-342
Published online Mar 27, 2021. doi: 10.4254/wjh.v13.i3.328
Published online Mar 27, 2021. doi: 10.4254/wjh.v13.i3.328
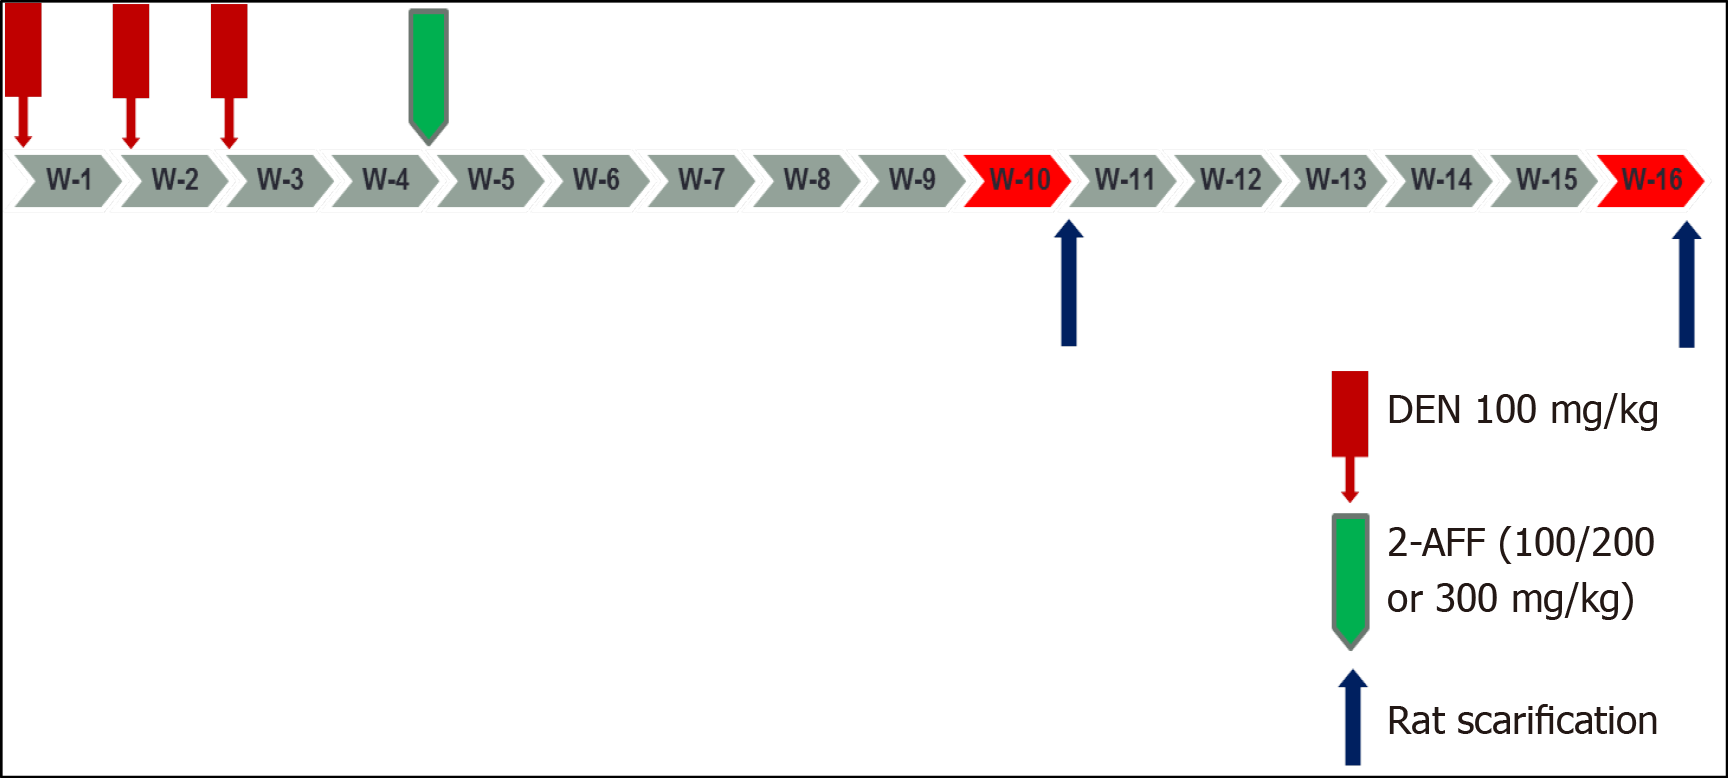
Figure 1 Schematic of the study design.
DEN: Diethylnitrosamine; 2-AAF: 2-Acetylaminofluorene.
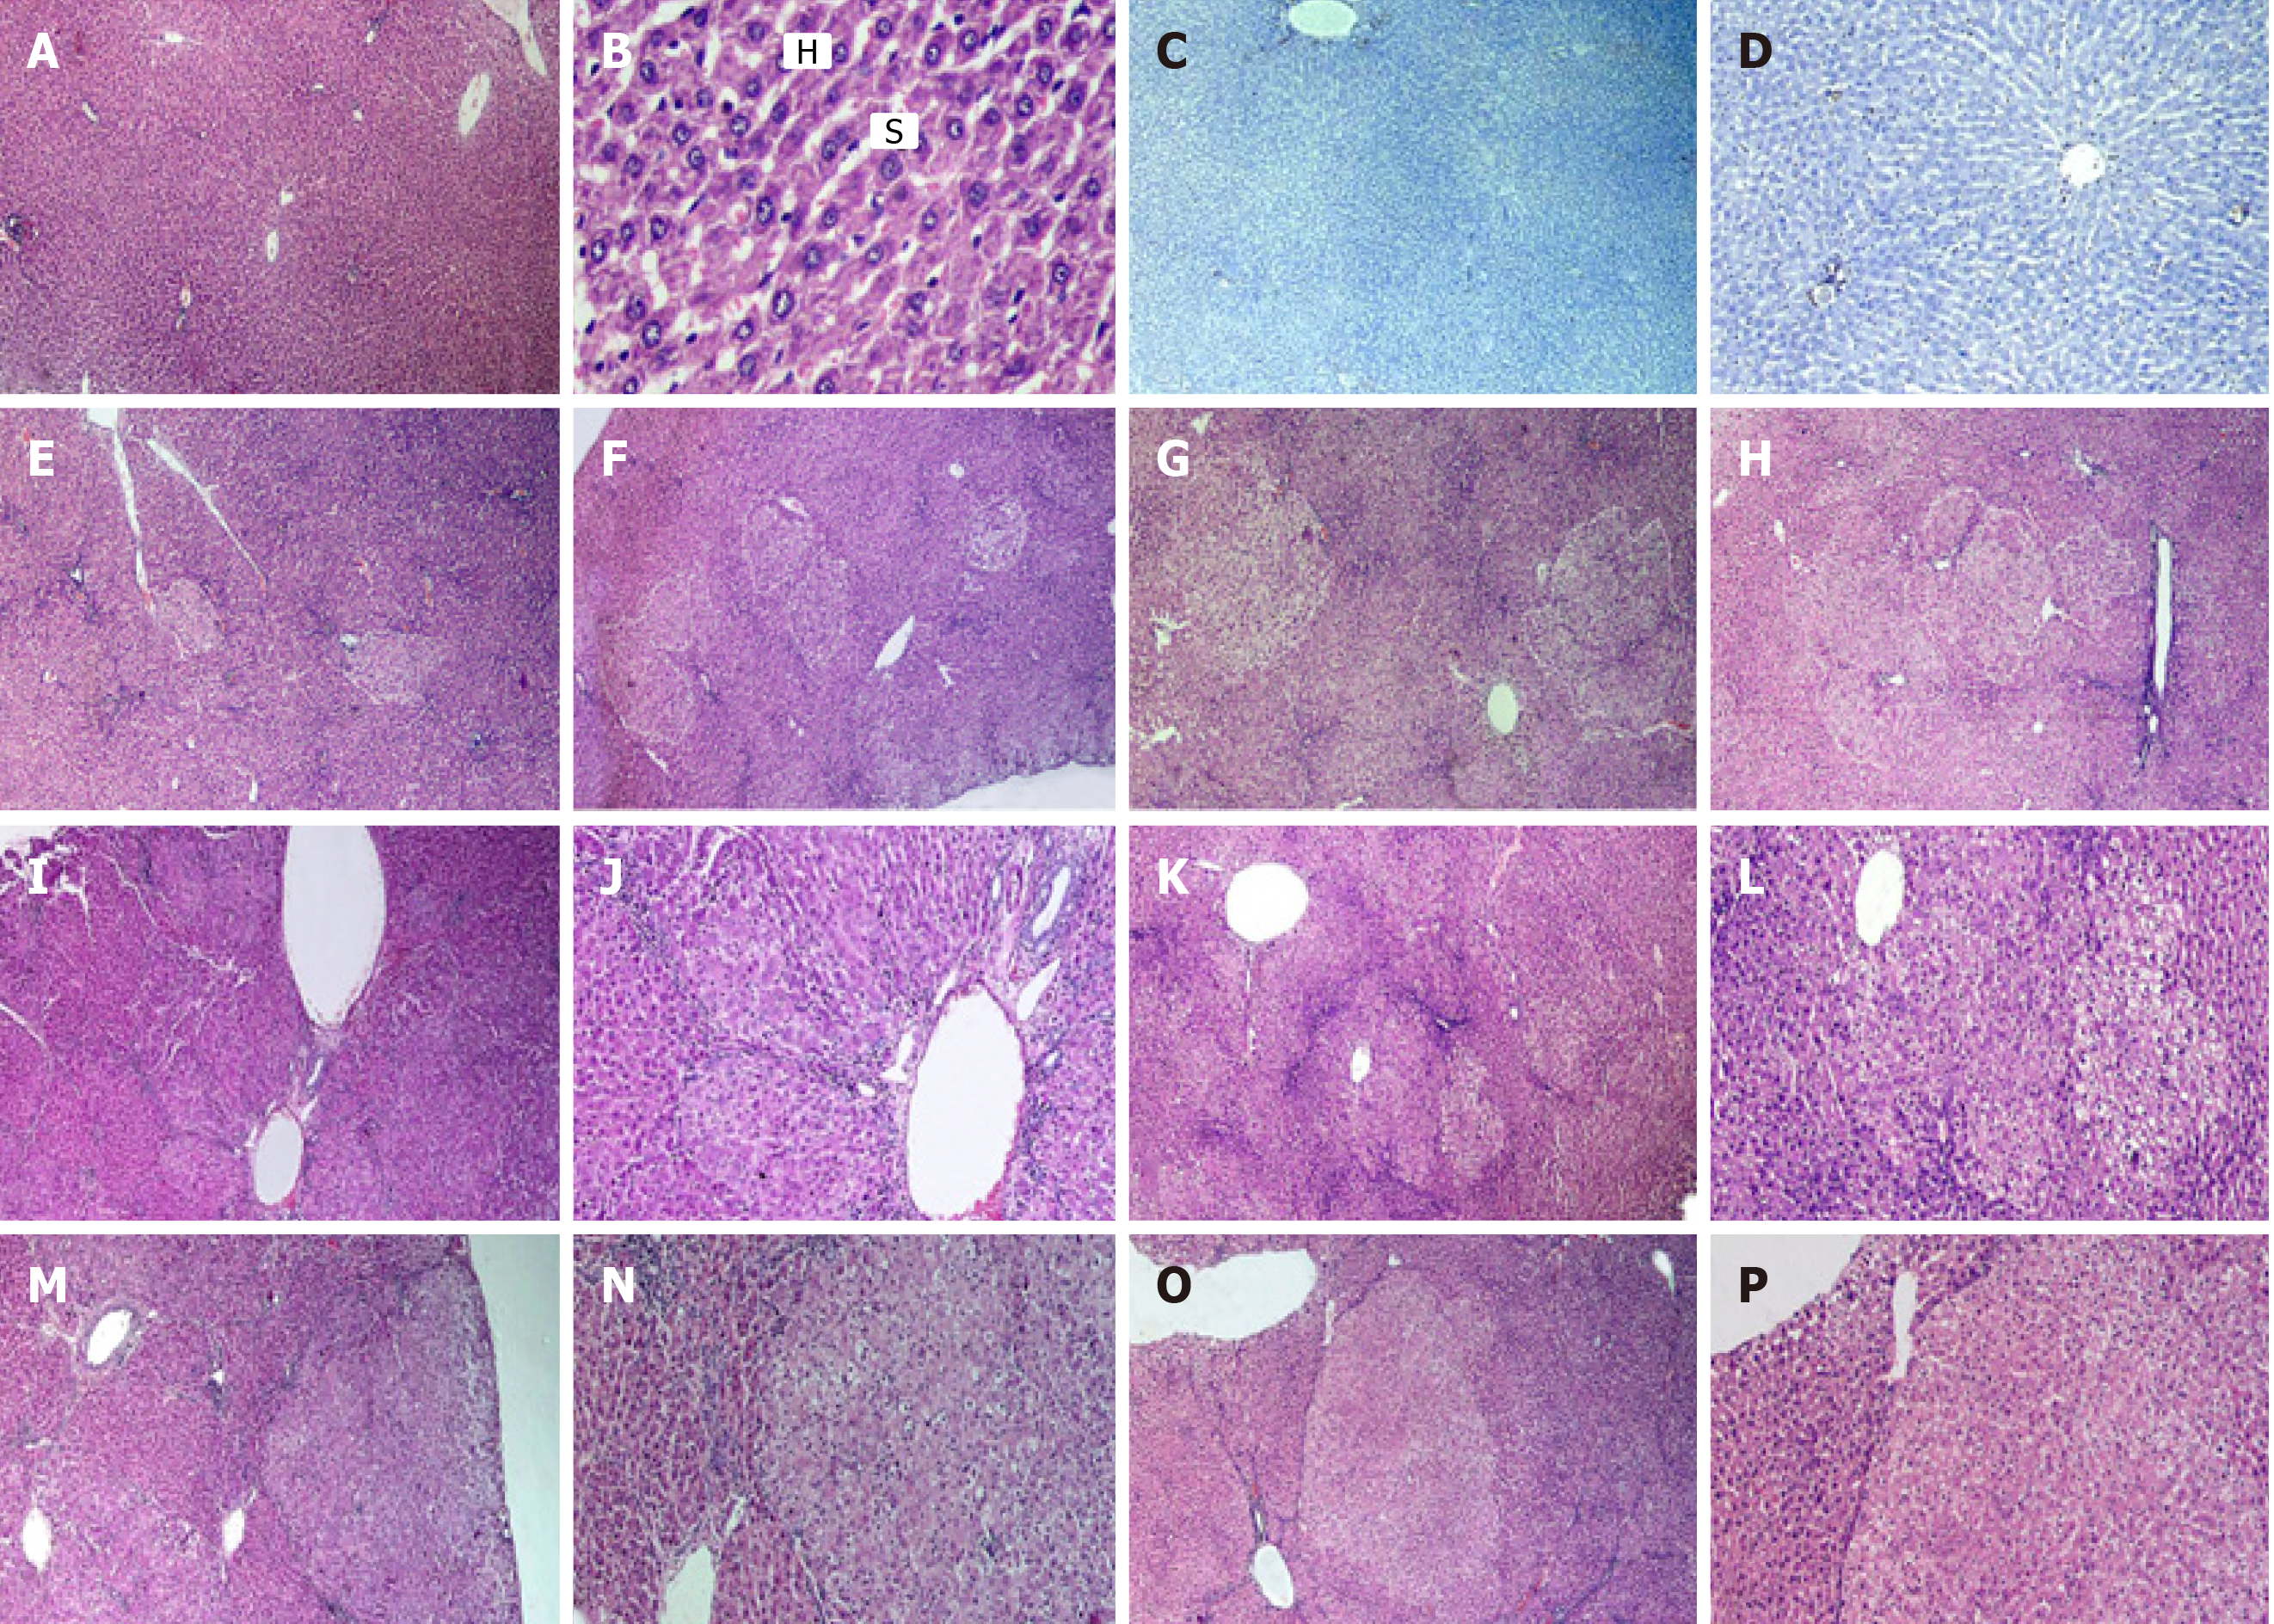
Figure 2 Histological and immunohistochemical examination.
A-D: Images of liver sections of naive group. Hematoxylin-eosin (HE) stained sections show normal hepatic architecture, portal triad, central vein and radiating cords of hepatocytes (H) with blood sinusoids (S) present in between (A and B). Immunohistochemically-stained section with anti-glutathione S transferase-P demonstrating negative reaction (C). Immunohistochemically-stained section with proliferating cell nuclear antigen antibodies (D); E-H: HE images of liver sections of rats that received diethylnitrosamine (DEN) and different doses of 2-acetylaminofluorene (2-AAF) and were sacrificed at week 10. Show multiple foci of cellular alteration of different sizes (dotted shapes), not compressing the surrounding hepatic parenchyma. DEN group (E), DEN+ 2-AAF 100 mg group (F), DEN + 2-AAF 200 mg group (G) and DEN + 2-AAF 300 mg group (H); I-P: HE liver sections of rats that received DEN and different doses of 2-AAF sacrificed at week 16, show larger, well discriminated, less differentiated dysplastic nodules compressing the surrounding liver tissue with disruption of hepatic lobular architecture were observed. DEN group (I and J), DEN + 100 mg 2AAF group (K and L), DEN + 200 mg 2AAF group (M and N), DEN + 300 mg 2AAF group (O and P). A, C, E-H × 40; D, J, L, N and P × 100; I, K, M and O × 40, B × 400.
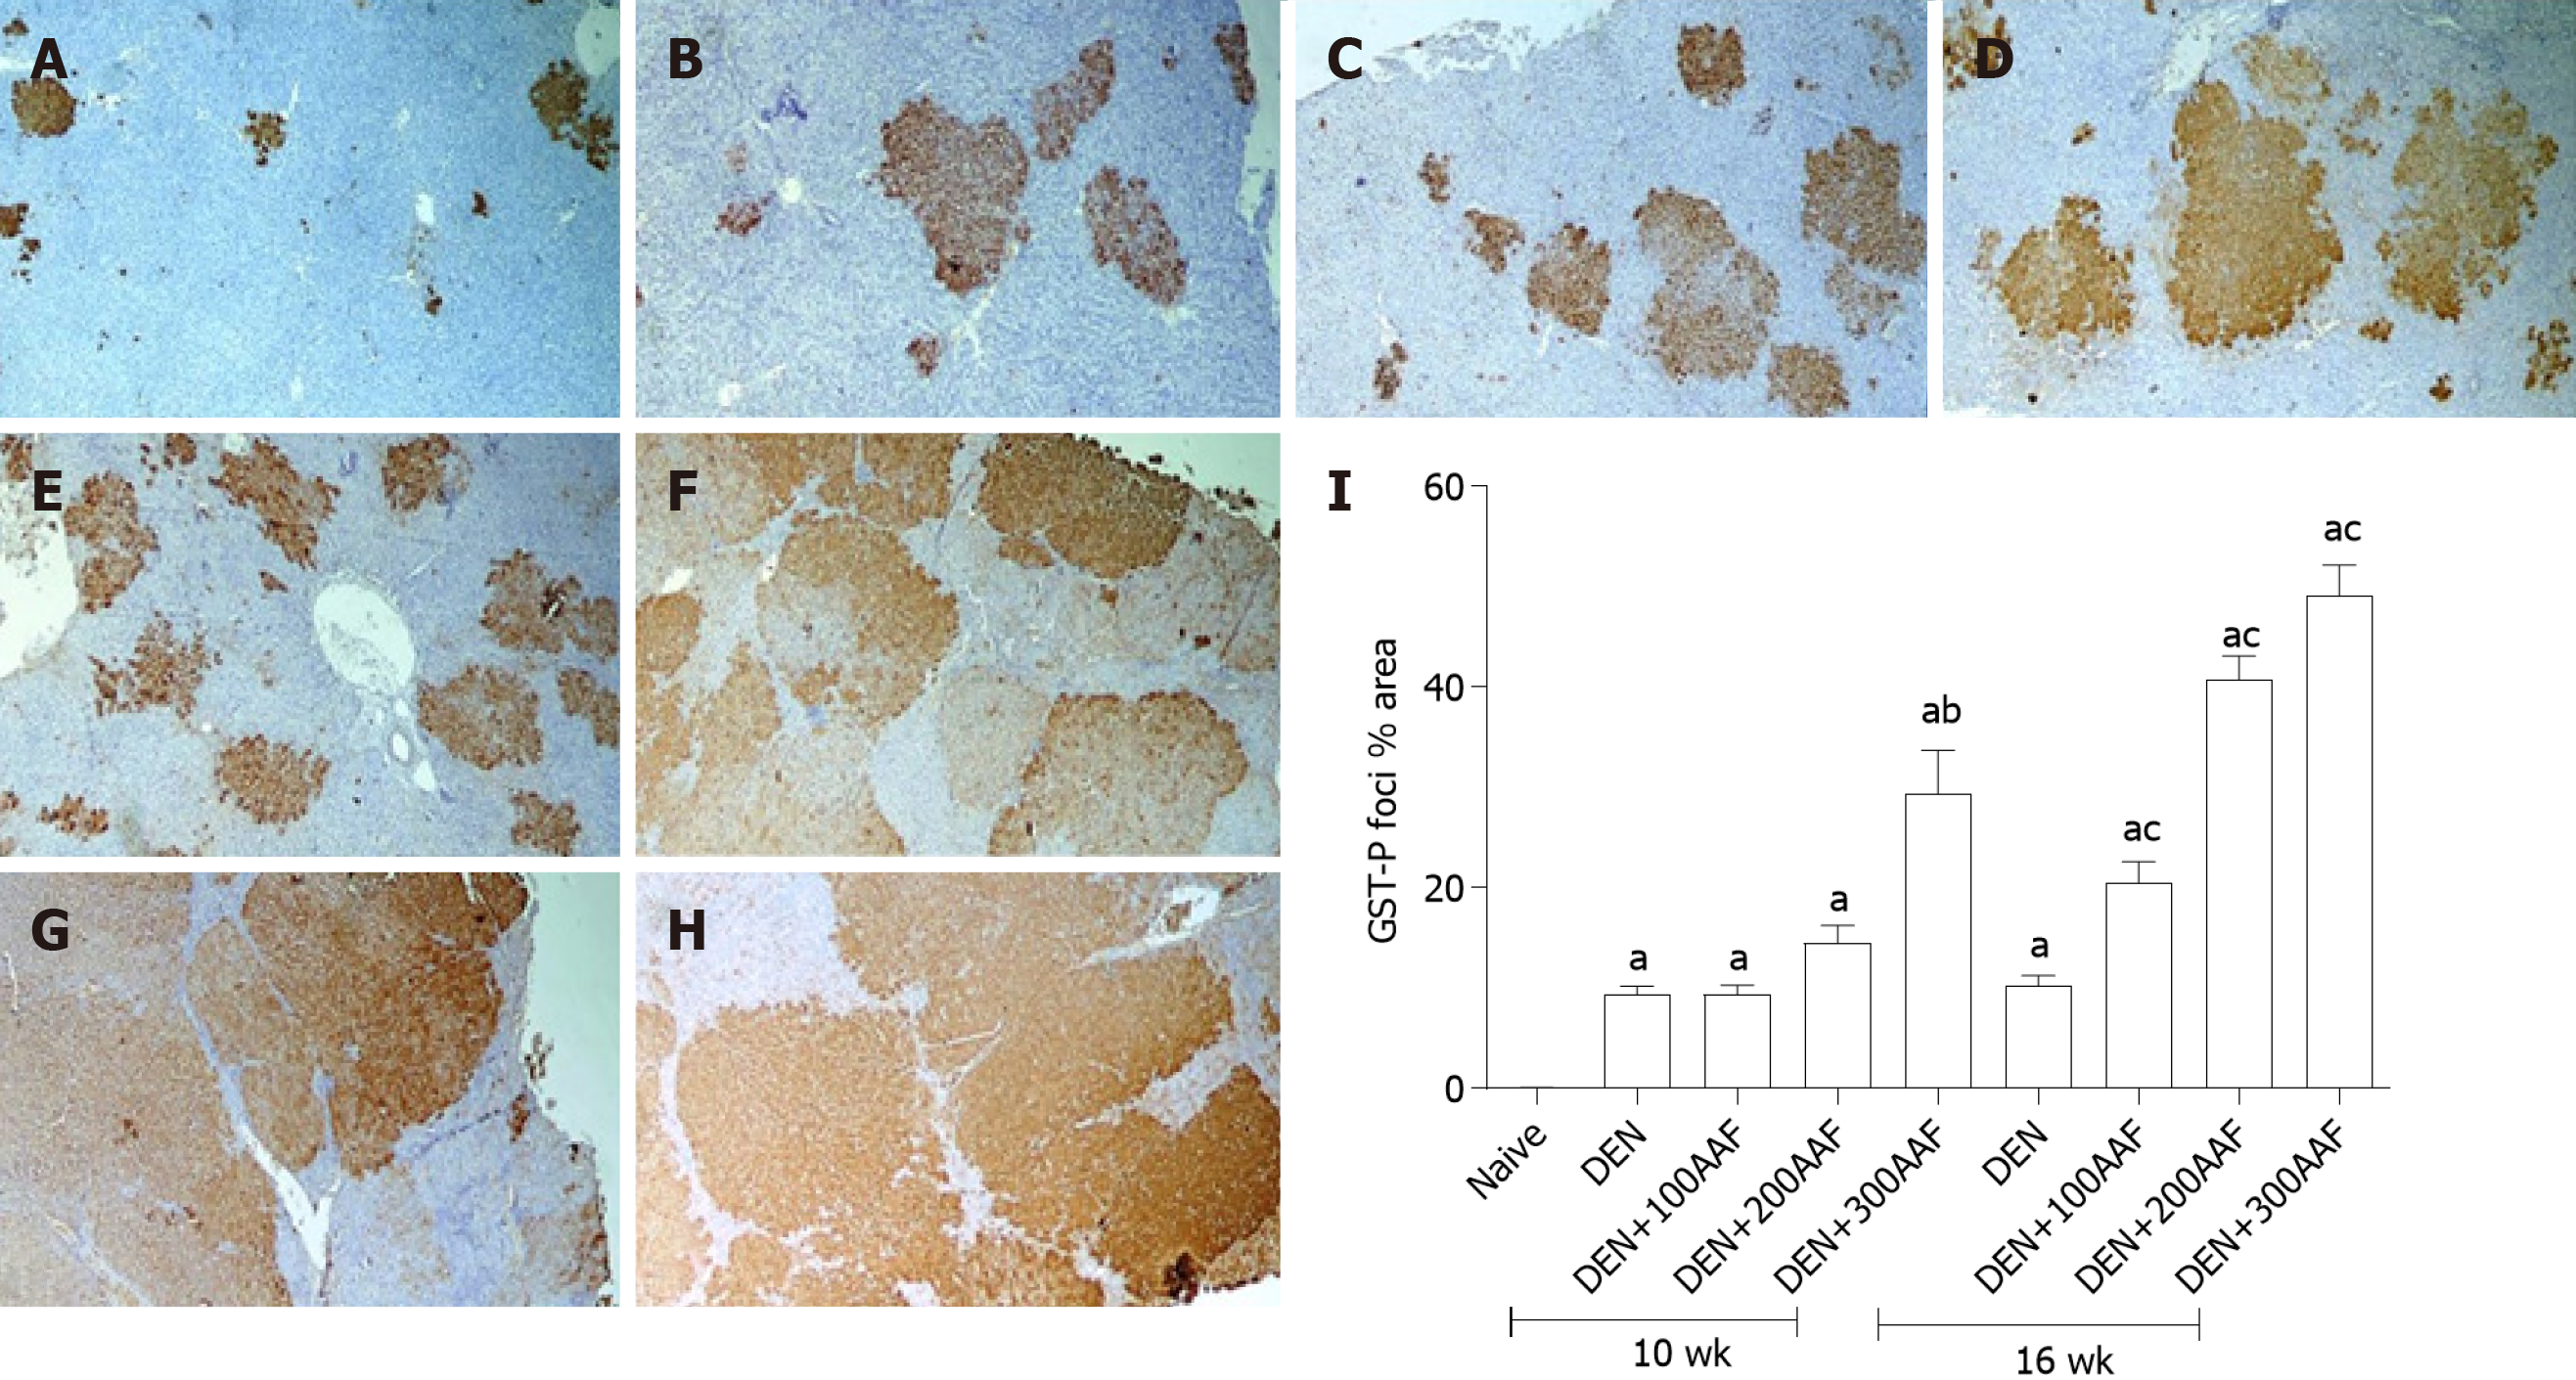
Figure 3 Histological and immunohistochemical examination.
A-H: Images of rats' liver sections immunohistochemically-stained with glutathione S transferase-P (GST-P) antibody, show multiple GST-P-positive hepatic foci and nodules (brown stained collection of cells) of different sizes scatter in-between negatively stained hepatic parenchyma. Rats sacrificed at week 10 (A-D), rats sacrificed at week 16 (E-H) [A and E: diethylnitrosamine (DEN) group; B and F: DEN + 100mg 2-acetylaminofluorene (2-AAF) group; C and G: DEN + 200 mg 2-AAF group; D and H: DEN + 300 mg 2-AAF (× 40)]; I: shows the effect of DEN and 2-AAF at different doses on GSTP foci % area in the liver. Values are mean ± SE; number of animals = 6 rats/each group. aP < 0.05 compared to naïve group; bP < 0.05 compared to DEN group at week 10, cP < 0.05 compared to DEN at week 16 group. One-way ANOVA followed by Tukey's multiple comparison test. DEN: Diethylnitrosamine; 2-AAF: 2-Acetylaminofluorene; GST-P: Glutathione S transferase-P.
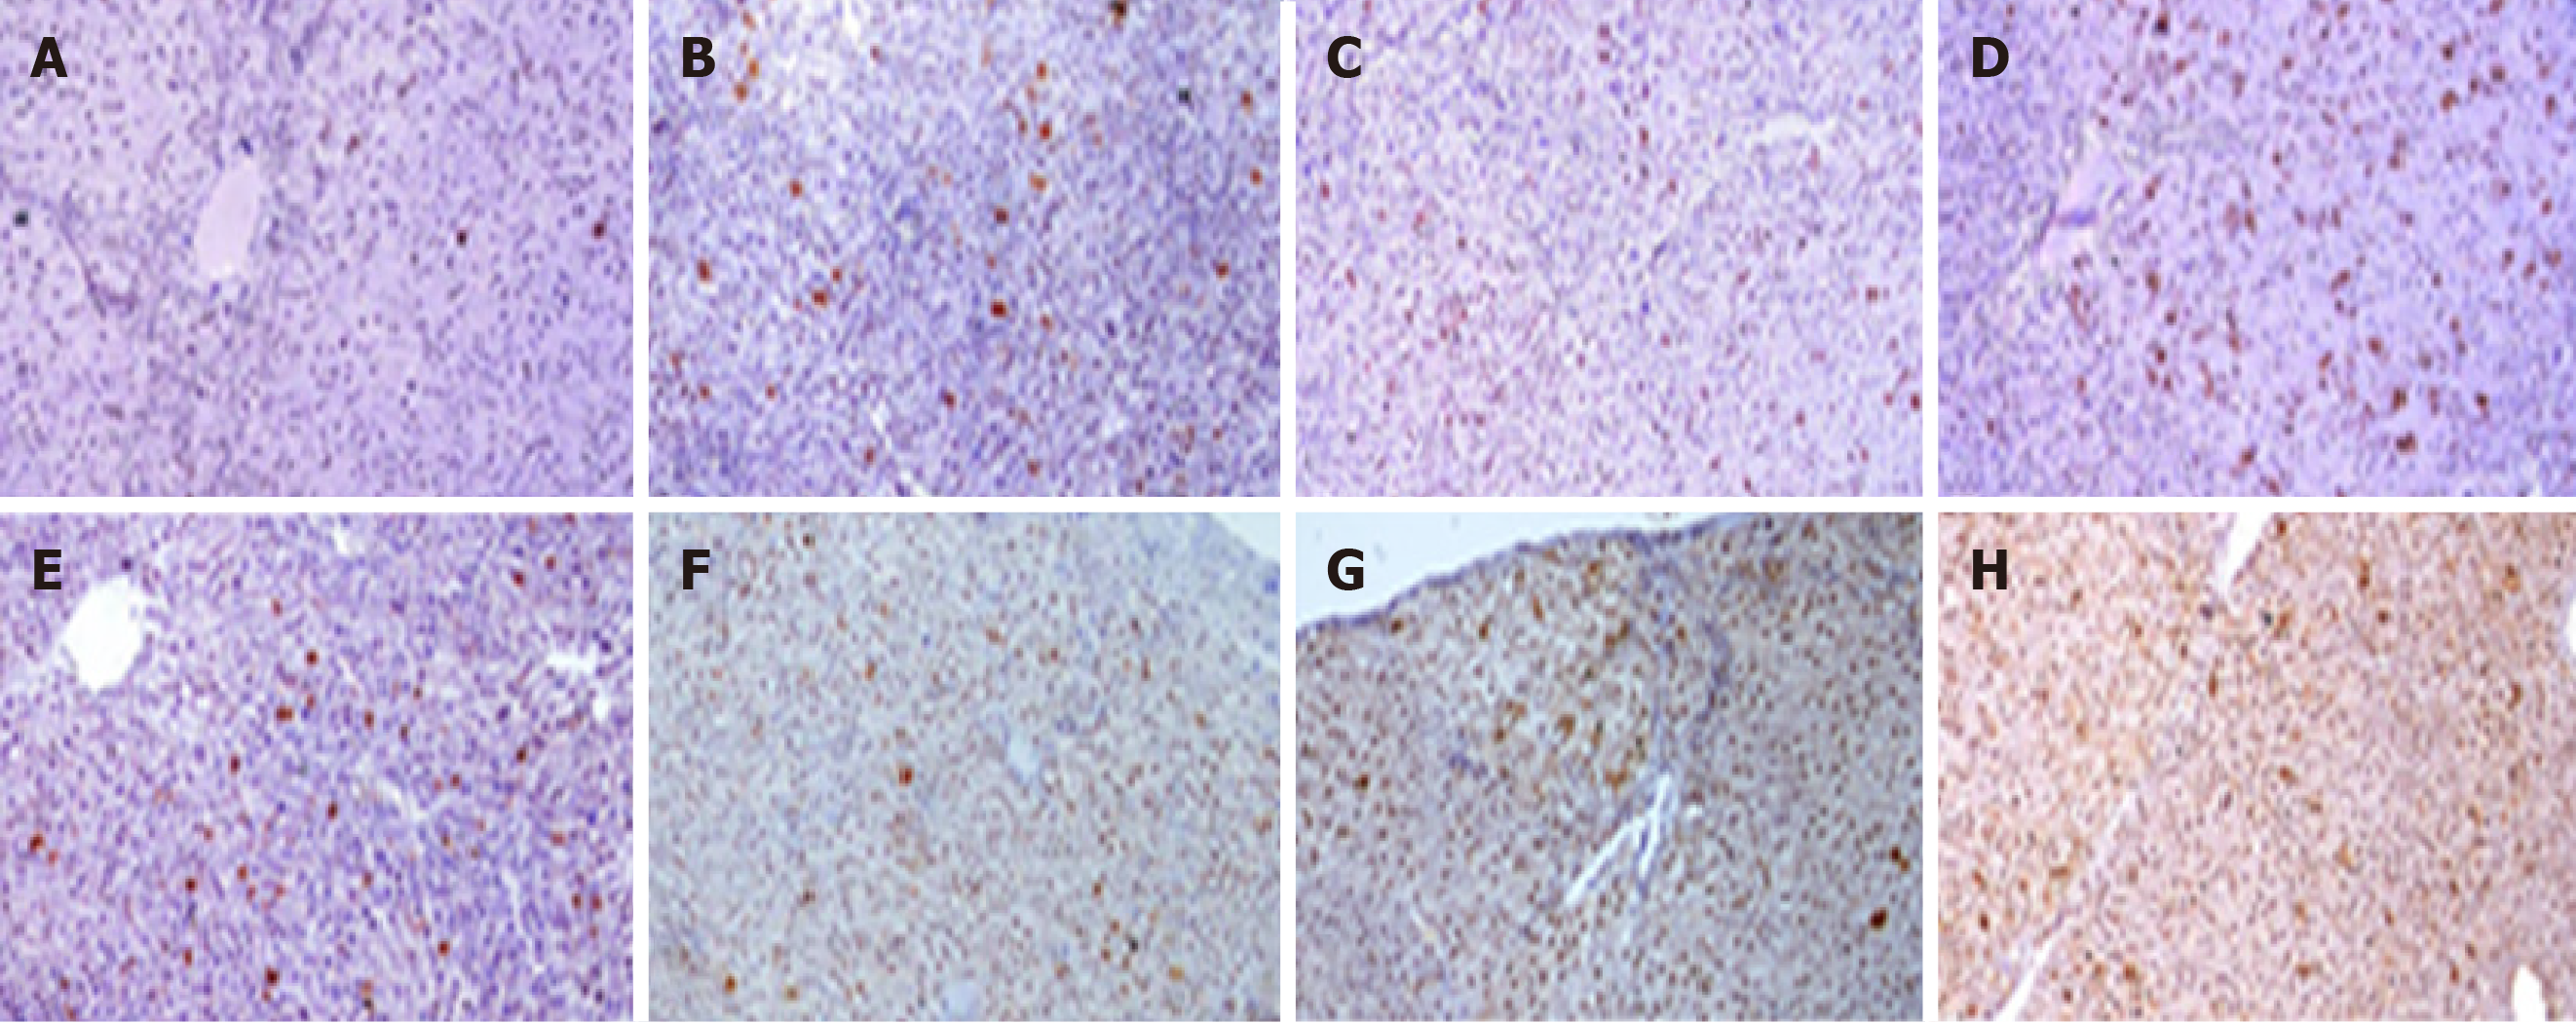
Figure 4 Images of rats' liver sections stained immunohistochemically with proliferating cell nuclear antigen.
Positive immune-reactive nucleus (brown dots) scatter in-between negatively stained liver tissue of rats who received diethylnitrosamine (DEN) and different doses of 2-acetylaminofluorene (2-AAF). A-D: Rats sacrificed at week 10; E-H: Rats sacrificed at week 16 (A and E: DEN group; B and F: DEN + 100 mg 2AAF group; C and G: DEN + 200 mg 2AAF group; D and H: DEN + 300 mg 2AAF; magnification × 100).
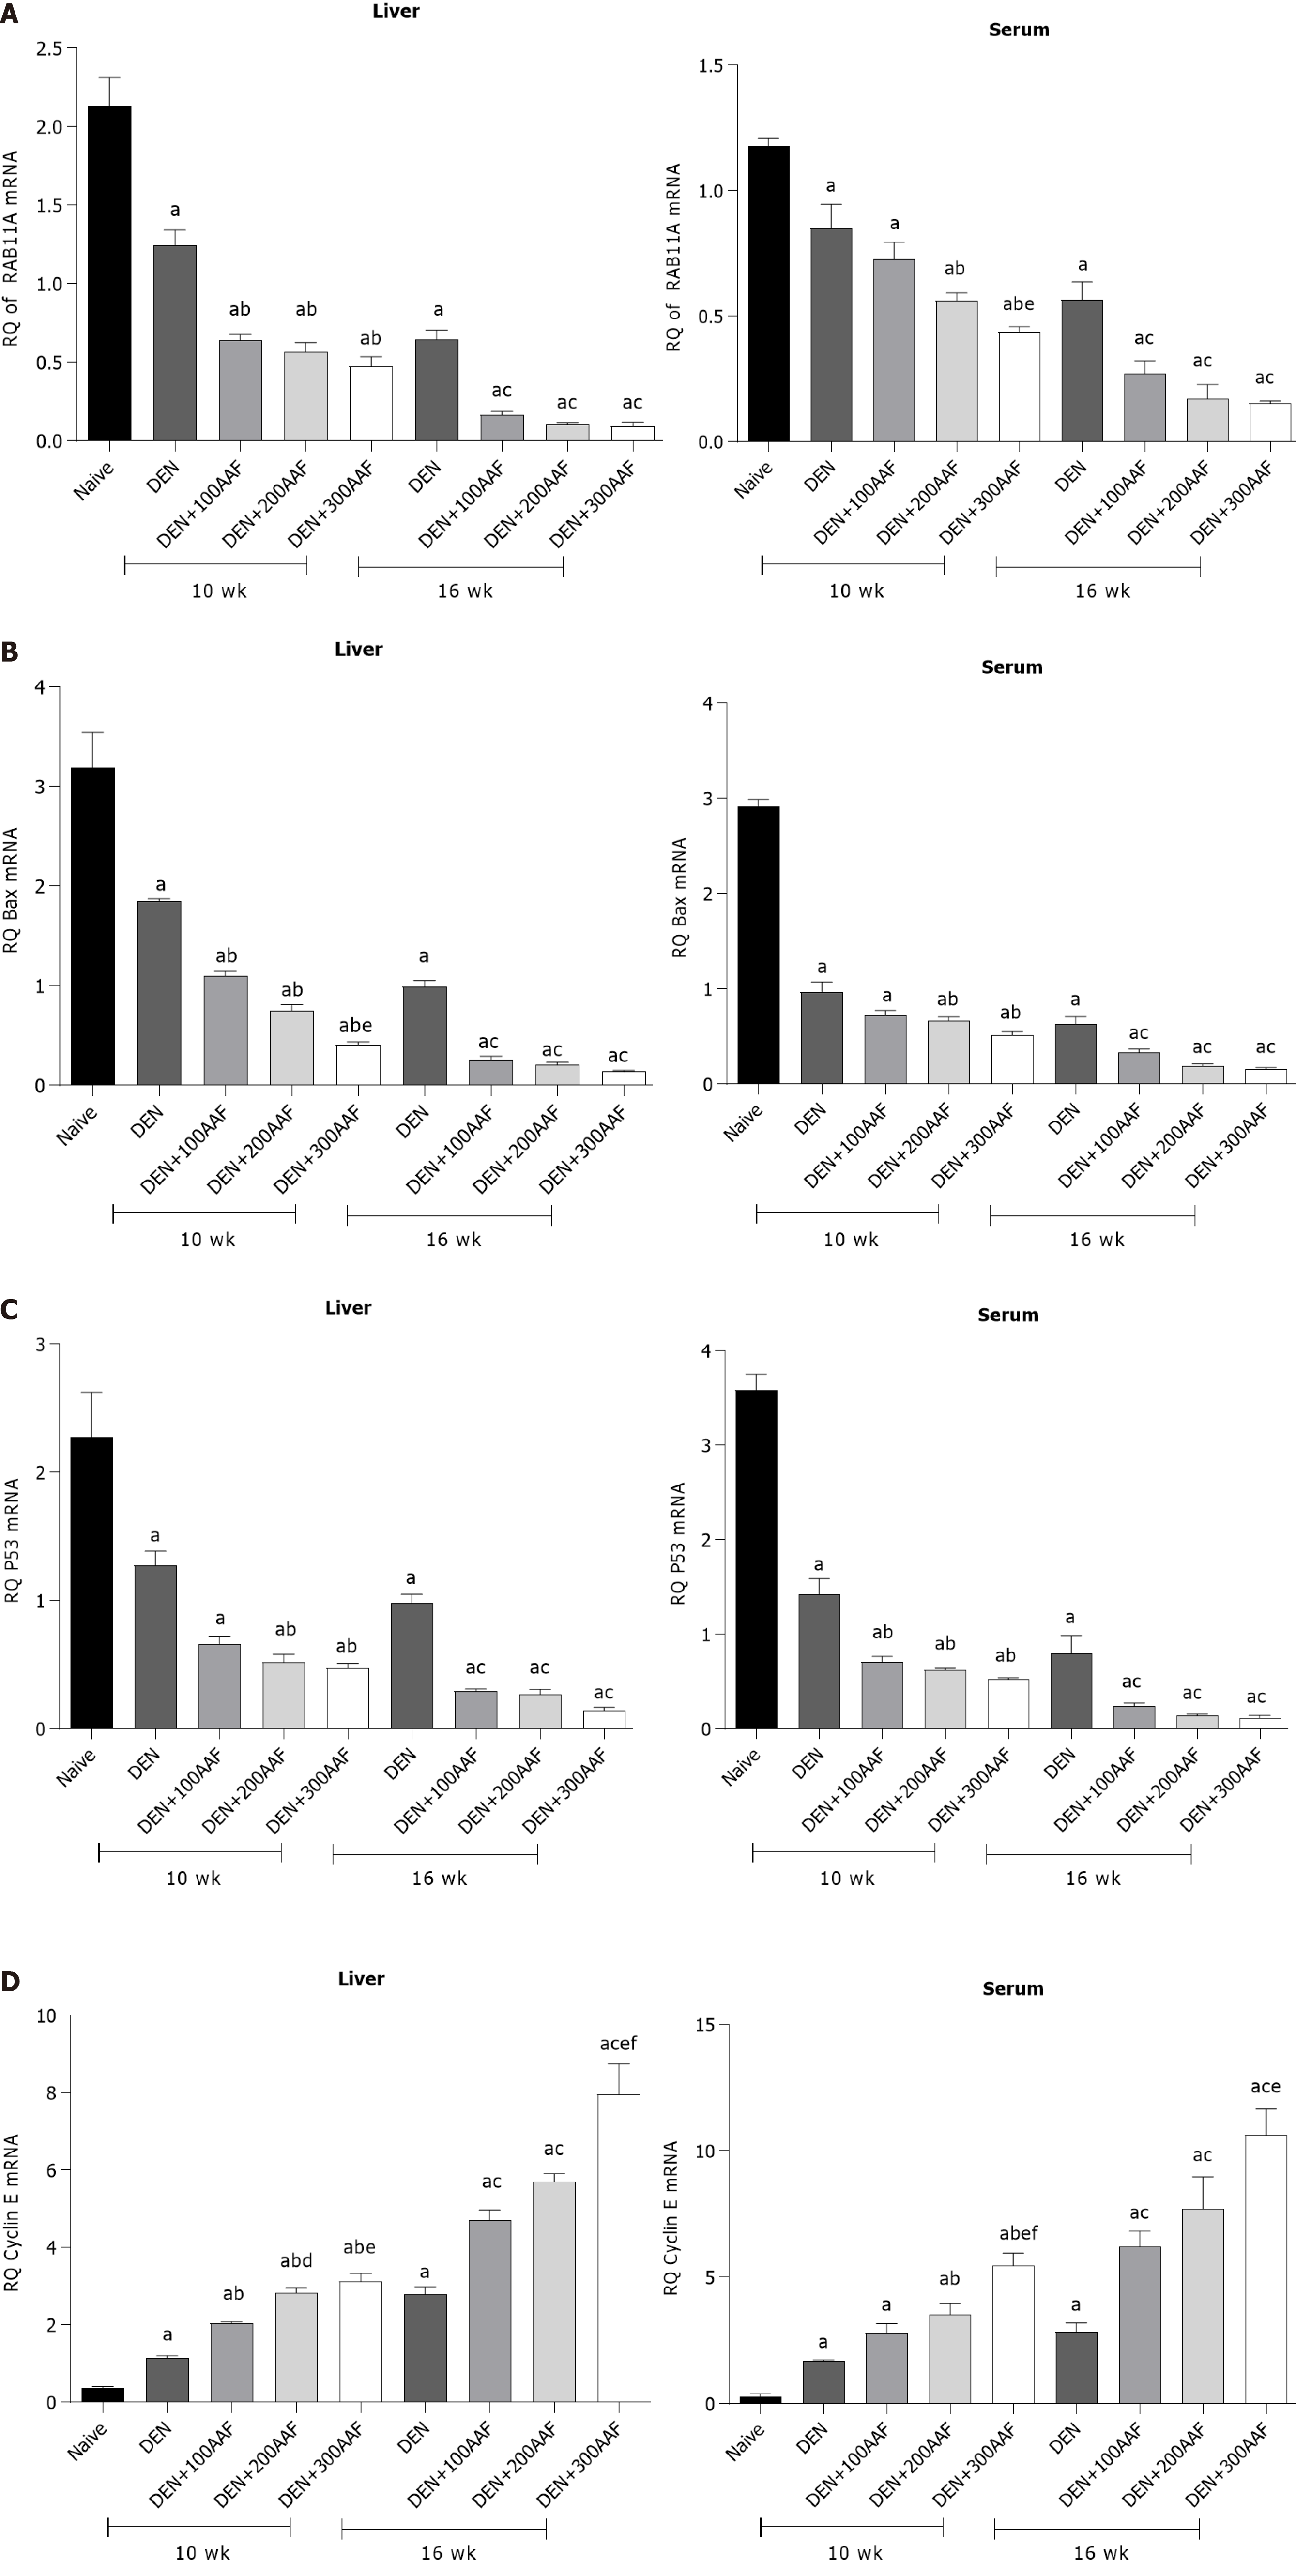
Figure 5 Effect of diethylnitrosamine and 2-acetylaminofluorene at different doses.
A: Relative quantification (RQ) of RAB11A mRNA; B: RQ of BAX mRNA; C: RQ of p53 mRNA; D: RQ of Cyclin E mRNA in the liver and serum in rats. Values are mean ± SE; number of animals = 6 rats/each group. aP < 0.05 compared to the naïve group; bP < 0.05 compared to the diethylnitrosamine (DEN) group at week 10 group; cP < 0.05 compared to the DEN at week 16 group; dP < 0.05 when DEN 200 + acetylaminofluorene (AAF) is compared to the DEN 100 + AAF; eP < 0.05 when DEN 300 + AAF is compared to the DEN 100 + AAF; fP < 0.05 when DEN 300 + AAF is compared to the DEN 200 + AAF. One-way ANOVA followed by Tukey's multiple comparison test. DEN: Diethylnitrosamine; 2-AAF: 2-Acetylaminofluorene.
- Citation: Hasanin AH, Habib EK, El Gayar N, Matboli M. Promotive action of 2-acetylaminofluorene on hepatic precancerous lesions initiated by diethylnitrosamine in rats: Molecular study. World J Hepatol 2021; 13(3): 328-342
- URL: https://www.wjgnet.com/1948-5182/full/v13/i3/328.htm
- DOI: https://dx.doi.org/10.4254/wjh.v13.i3.328


