Copyright
©The Author(s) 2020.
World J Hepatol. Dec 27, 2020; 12(12): 1367-1371
Published online Dec 27, 2020. doi: 10.4254/wjh.v12.i12.1367
Published online Dec 27, 2020. doi: 10.4254/wjh.v12.i12.1367
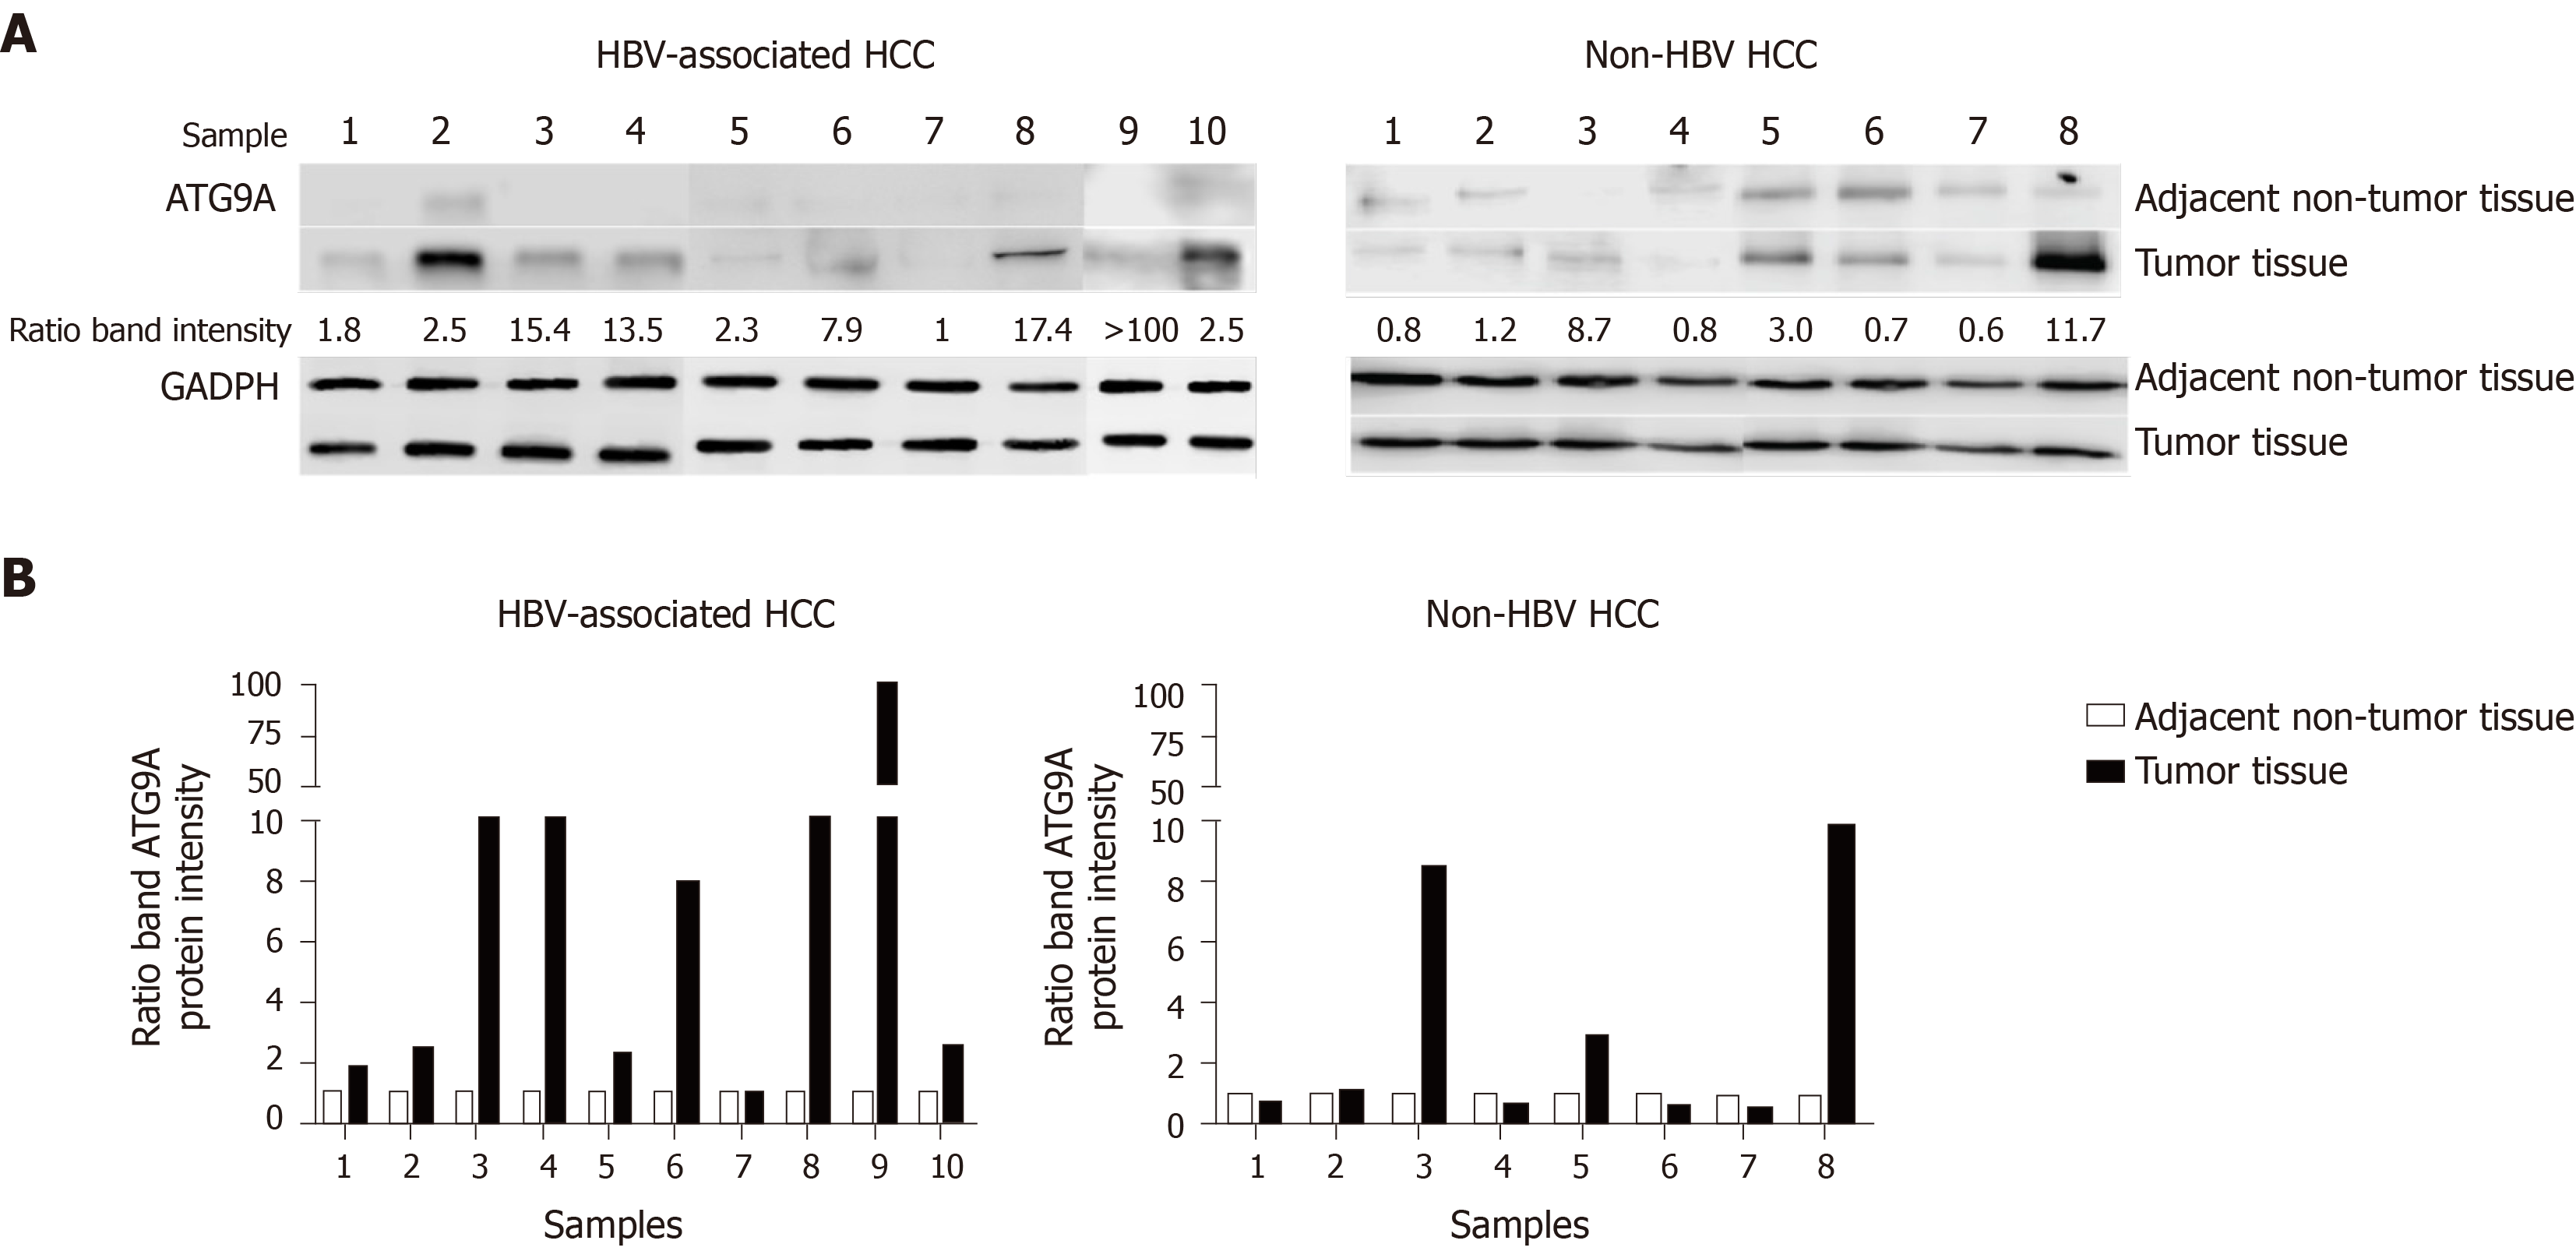
Figure 1 Quantification of autophagy related protein 9A protein levels from hepatitis B virus-infected hepatocellular carcinoma patients and nonhepatitis B virus hepatocellular carcinoma patients.
A: Western blotting with specific antibodies was used to analyze autophagy related protein 9A (ATG9A) protein expression in hepatitis B virus (HBV)-associated hepatocellular carcinoma (HCC) and nonHBV-HCC. Glyceraldehyde-3-phosphate dehydrogenase (GADPH) was used as a protein loading control; B: Graphs showing the intensity band ratio (tumor tissue/adjacent nontumor tissue) quantified using the LI-COR® image system for western blot analysis.
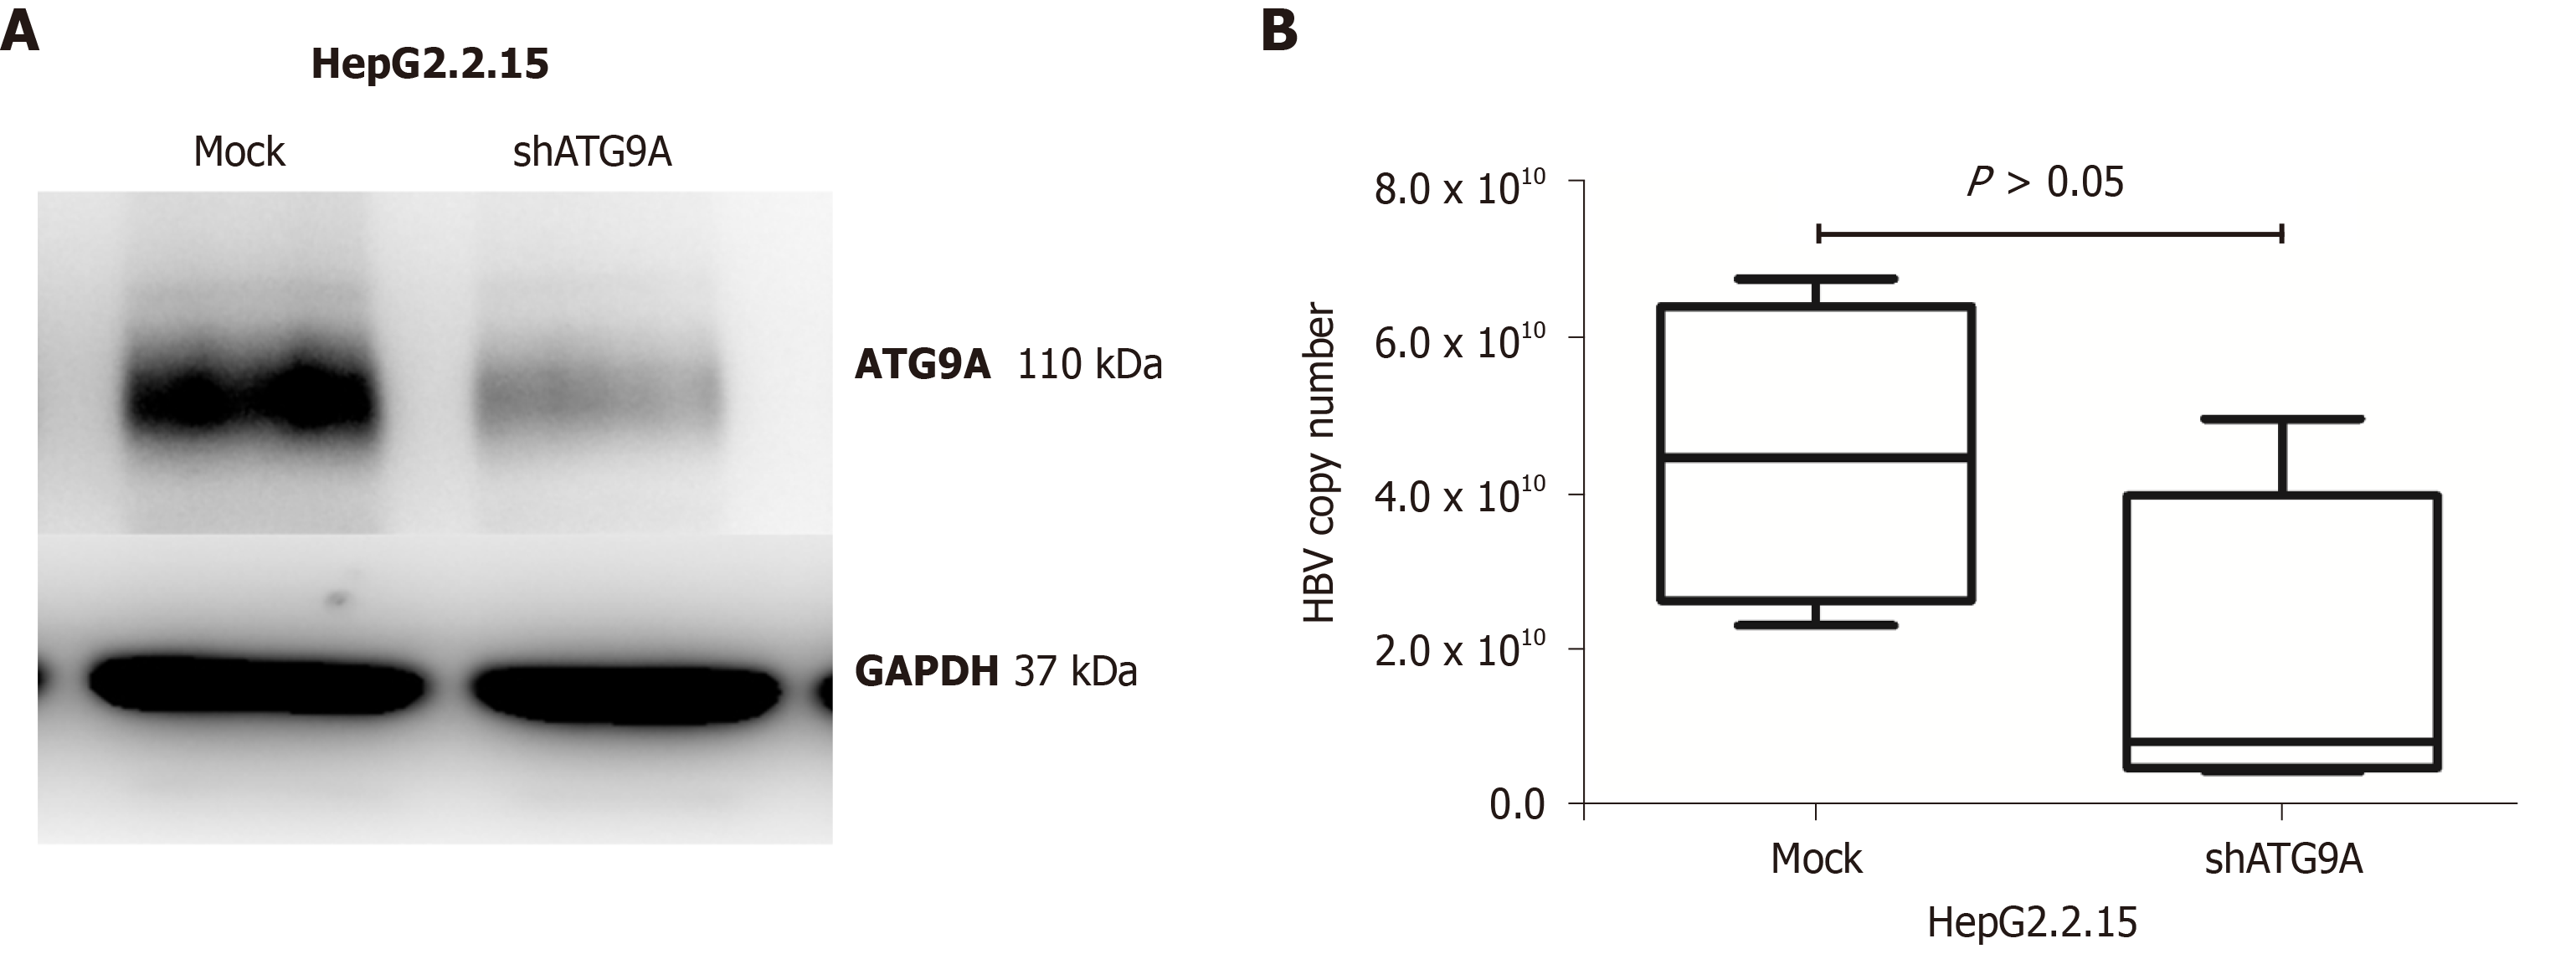
Figure 2 Silencing of autophagy related protein 9A by RNA interference and detection of hepatitis B virus DNA level.
A: The western blot method was applied to analyze autophagy related protein 9 (ATG9A) protein levels against a mock treatment (control) and ATG9A knockdown (shATG9A) HepG2.2.15 cells; B: Quantitation of hepatitis B virus (HBV) DNA by real-time PCR. Total purified DNA from mock treatment (mock) and ATG9A knockdown (shATG9A) in HepG2.2.15 cells was amplified using preS1 specific primers. Hepatitis B virus preS1 plasmid was used as standard copy number. Data is shown as mean ± standard error of the four independent experiments. GAPDH: Glyceraldehyde-3-phosphate dehydrogenase.
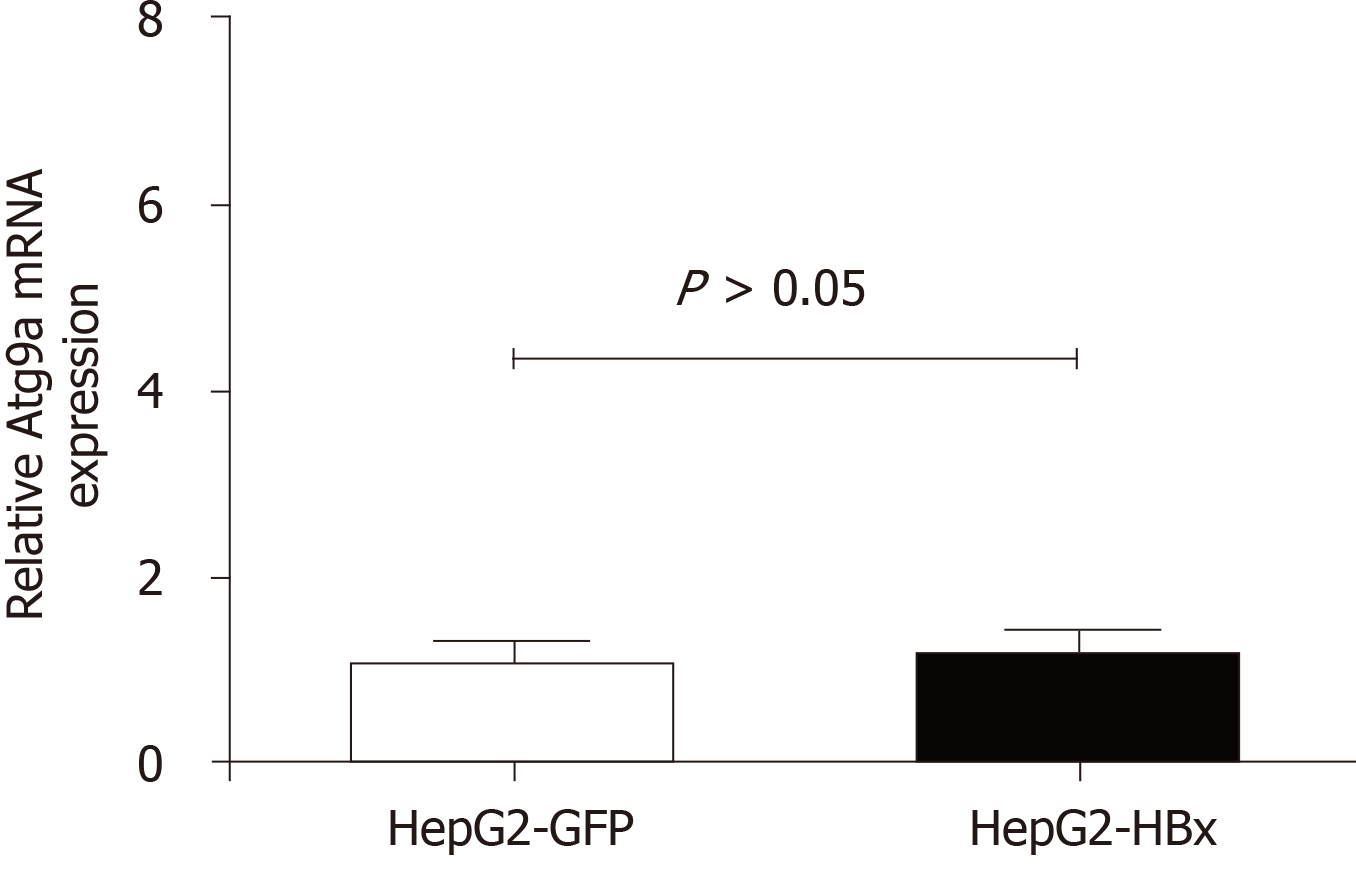
Figure 3 Quantitative real-time reverse transcriptase-PCR analysis of autophagy related protein 9A mRNA expression in HepG2-GFP and HepG2-HBx transfected cell lines.
β-actin was used as an internal control. Data represent the mean ± standard error in the three independent experiments. ATG9A: Autophagy related protein 9A.
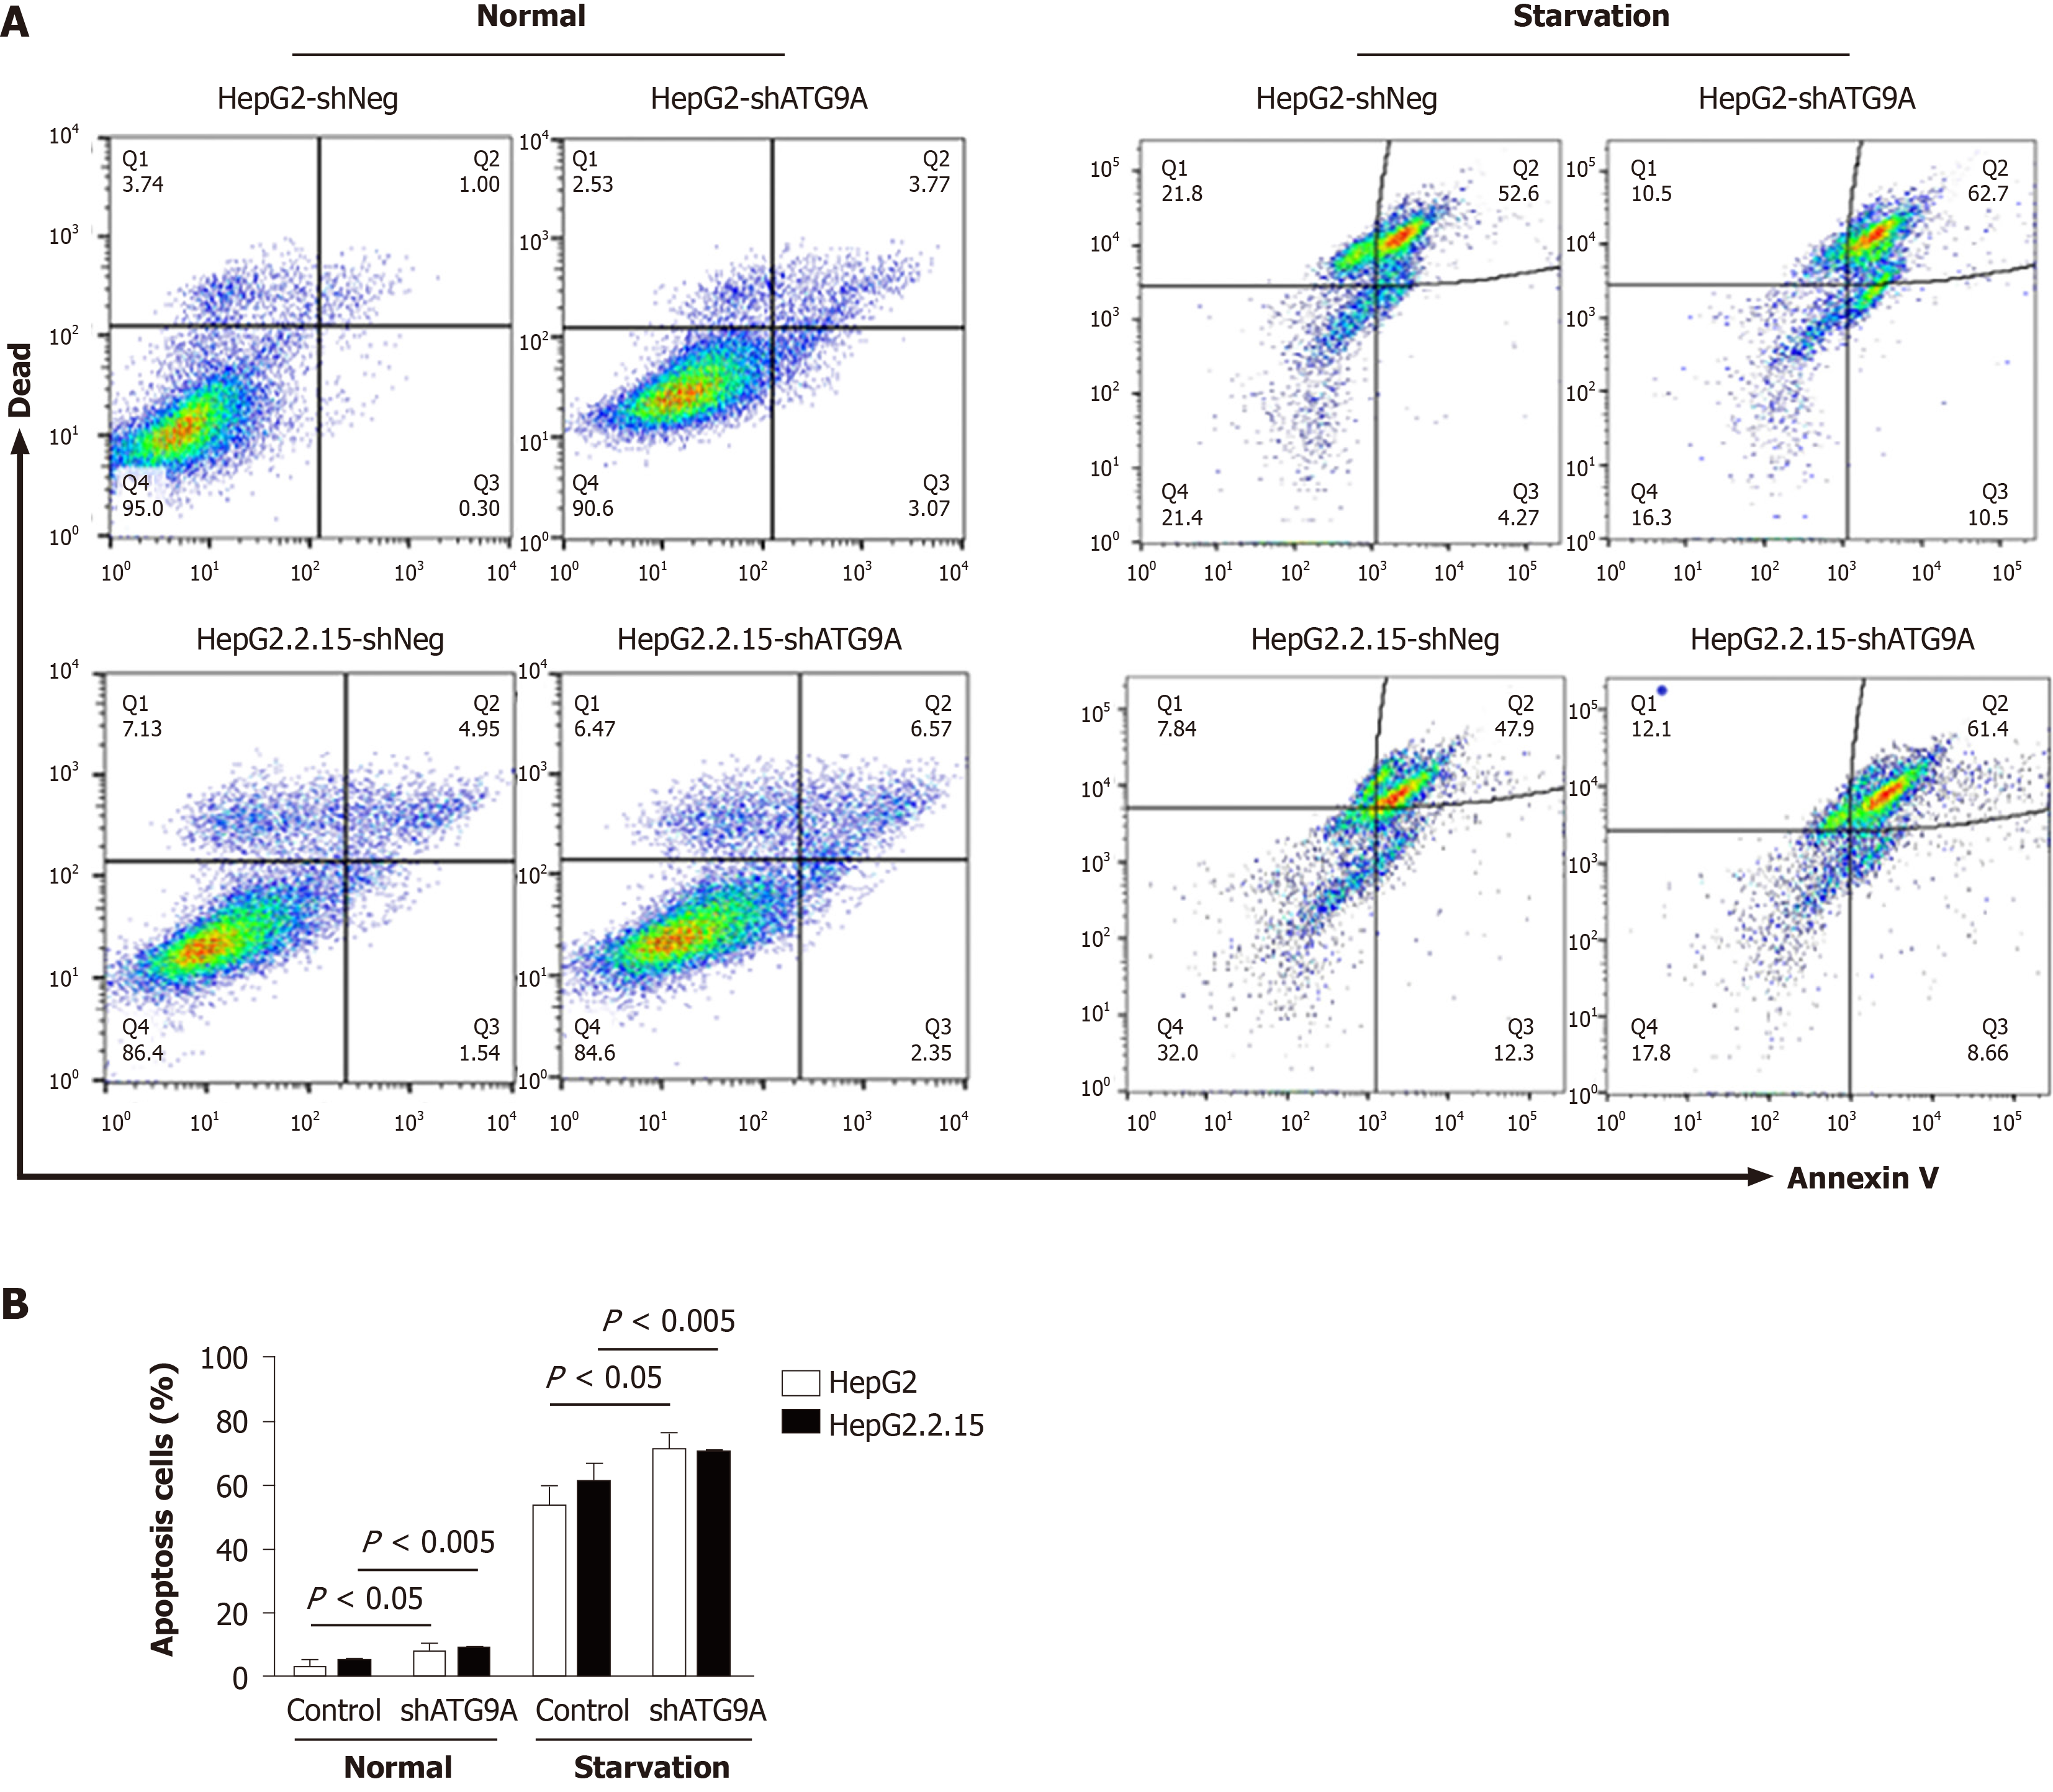
Figure 4 Apoptosis assays of HepG2 and HepG2.
2.15 transfected with sh-autophagy related protein 9A or shNeg (control). A: Cells were transiently transfected with shRNA plasmids for 72 h and then cultured in starvation medium for 4 h; B: Bar graphs showing the percentage of total apoptotic cells detected by Annexin V binding. Data represent the mean ± standard error from the three independent experiments. ATG9A: Autophagy related protein 9A.
- Citation: Kimkong I, Kunanopparat A. Autophagy related protein 9A increase in hepatitis B virus-associated hepatocellular carcinoma and the role in apoptosis. World J Hepatol 2020; 12(12): 1367-1371
- URL: https://www.wjgnet.com/1948-5182/full/v12/i12/1367.htm
- DOI: https://dx.doi.org/10.4254/wjh.v12.i12.1367


