Copyright
©The Author(s) 2020.
World J Hepatol. Oct 27, 2020; 12(10): 816-828
Published online Oct 27, 2020. doi: 10.4254/wjh.v12.i10.816
Published online Oct 27, 2020. doi: 10.4254/wjh.v12.i10.816
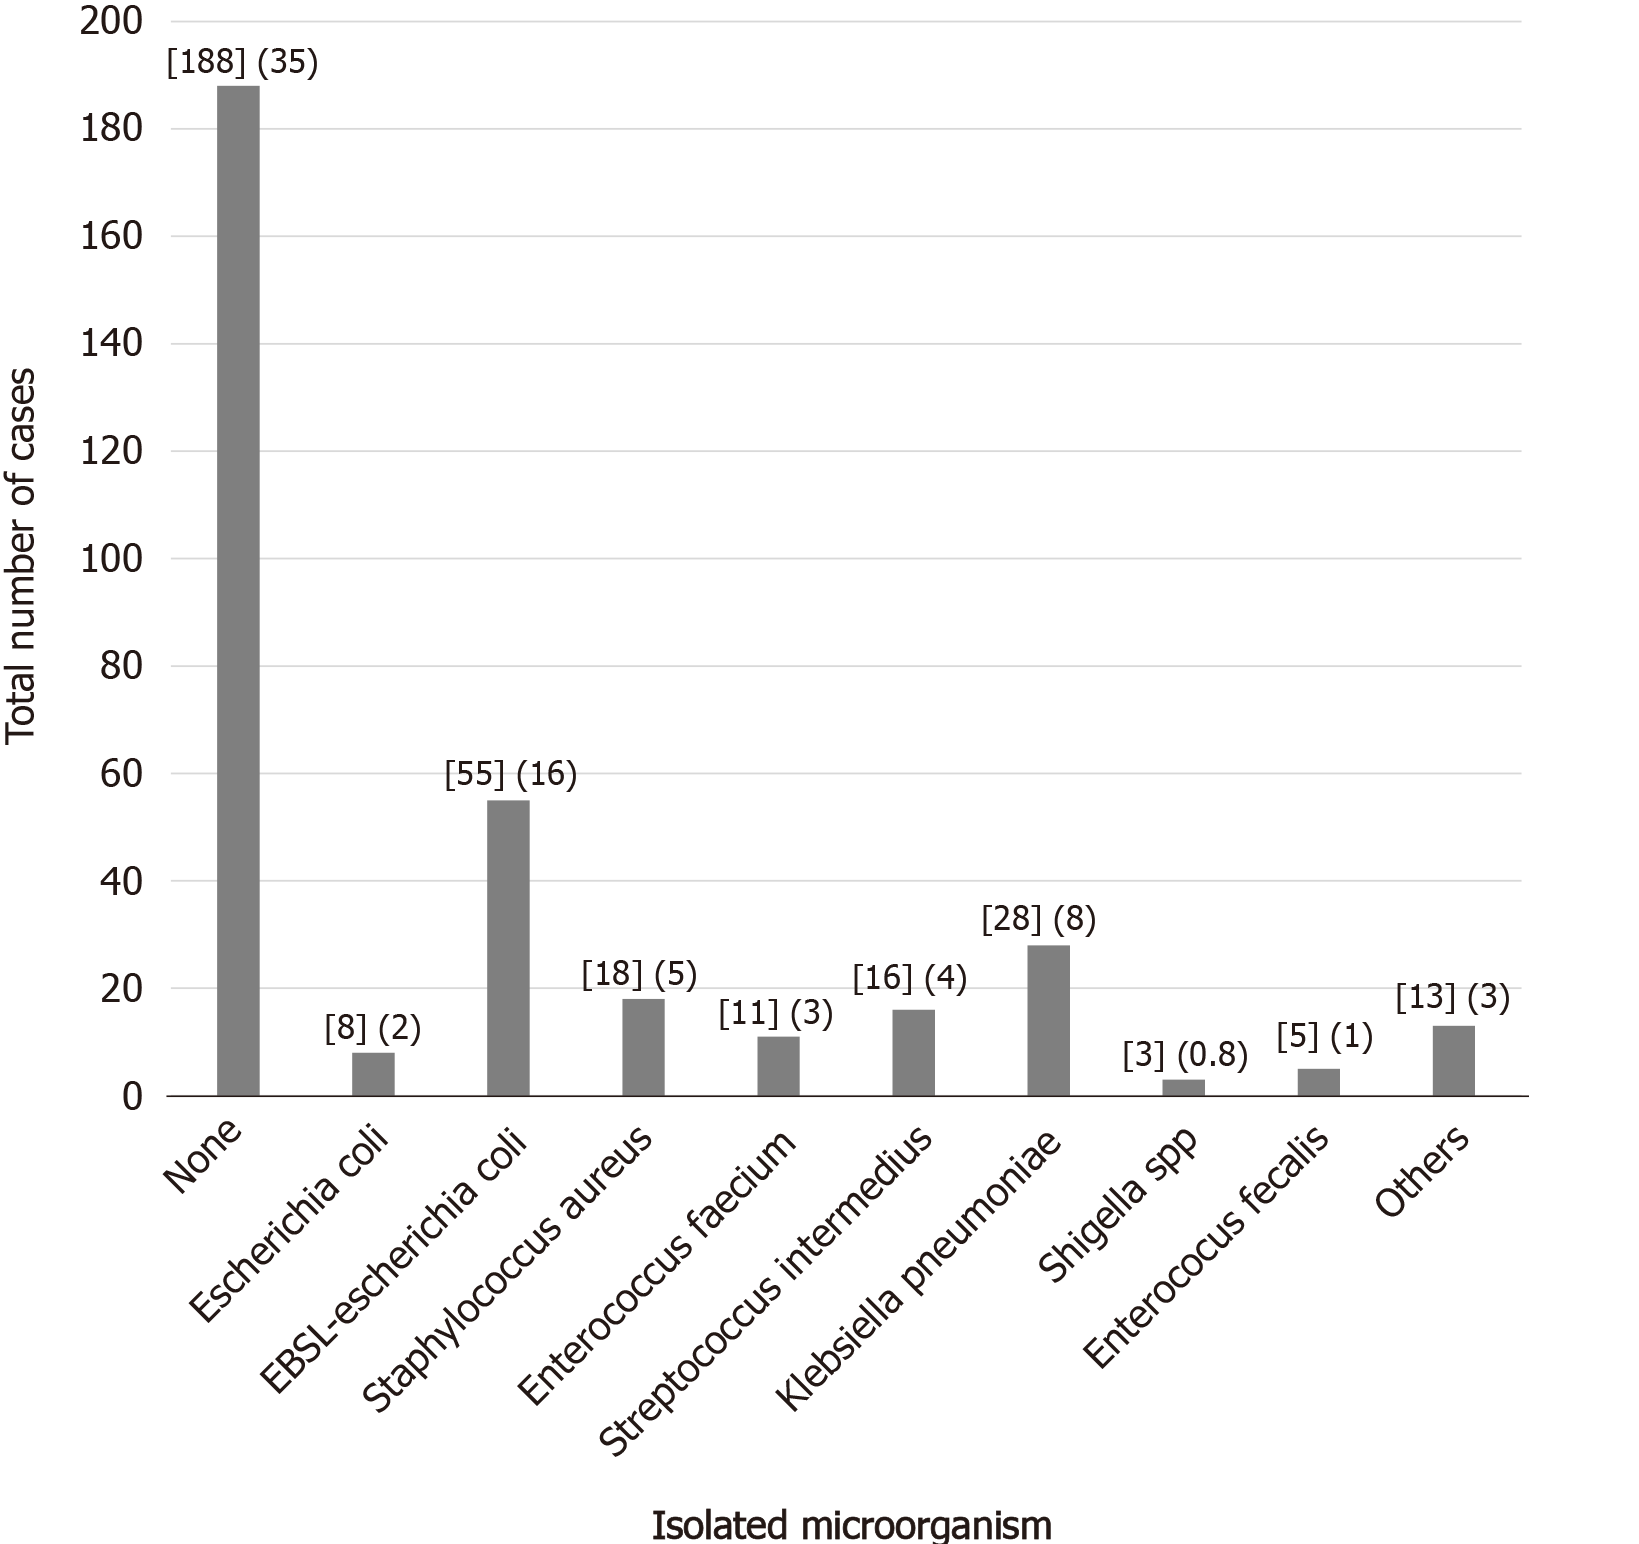
Figure 1 Distribution of isolated microorganisms in patients with pyogenic liver abscess n (%).
The figure shows the frequency of the different bacteria cultured. The majority of cases did not have microorganism isolation in the cultures.
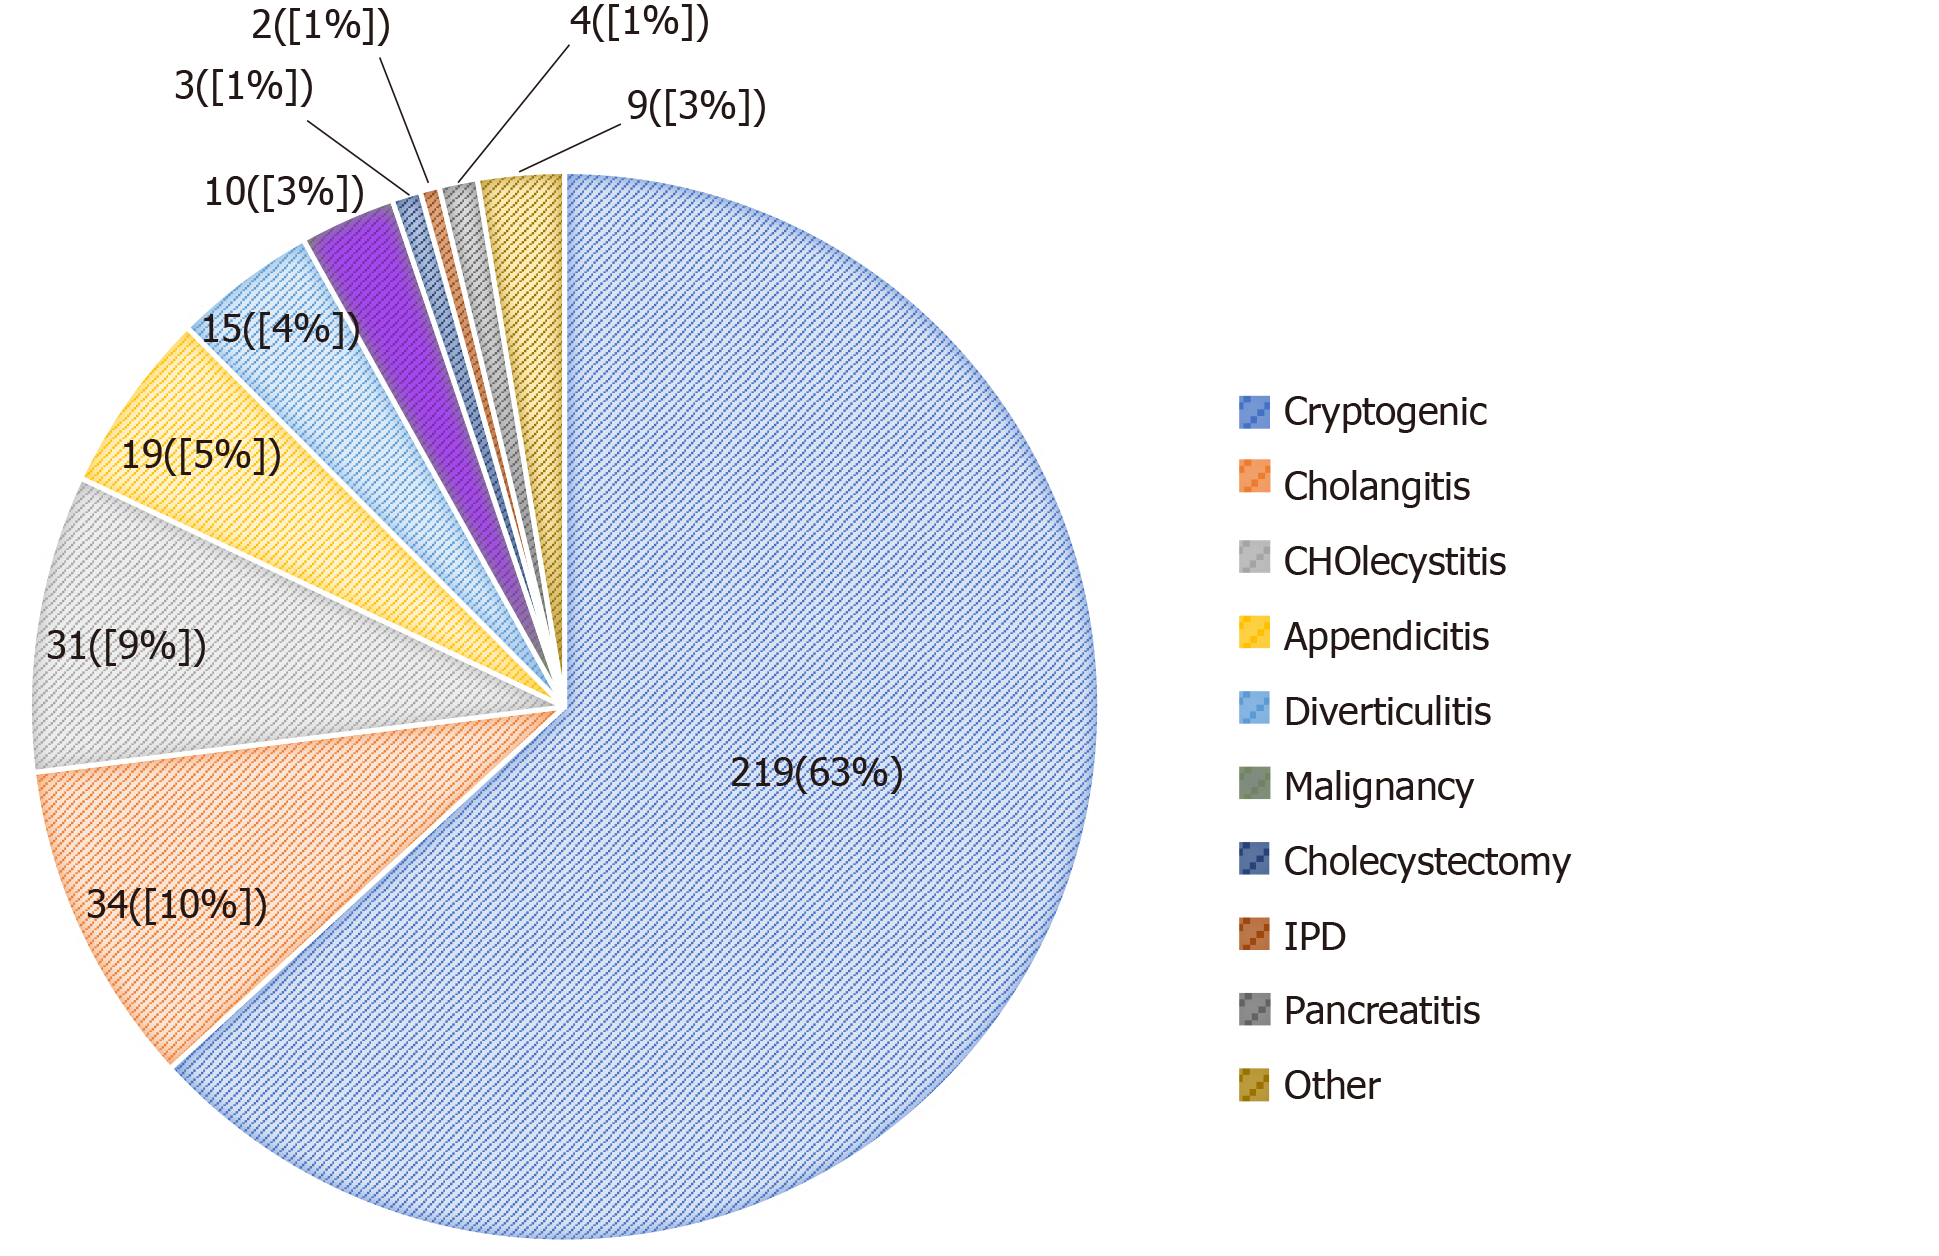
Figure 2 Source of infection in patients with pyogenic liver abscess.
The figure shows the distribution of the different sources of infection, with ascending cholangitis and cholecystitis both being the most common precipitating events.
- Citation: Pérez-Escobar J, Ramirez-Quesada W, Calle-Rodas DA, Chi-Cervera LA, Navarro-Alvarez N, Aquino-Matus J, Ramírez-Hinojosa JP, Moctezuma-Velázquez C, Torre A. Increased incidence of and microbiologic changes in pyogenic liver abscesses in the Mexican population. World J Hepatol 2020; 12(10): 816-828
- URL: https://www.wjgnet.com/1948-5182/full/v12/i10/816.htm
- DOI: https://dx.doi.org/10.4254/wjh.v12.i10.816


