Copyright
©The Author(s) 2019.
World J Hepatol. Aug 27, 2019; 11(8): 656-662
Published online Aug 27, 2019. doi: 10.4254/wjh.v11.i8.656
Published online Aug 27, 2019. doi: 10.4254/wjh.v11.i8.656
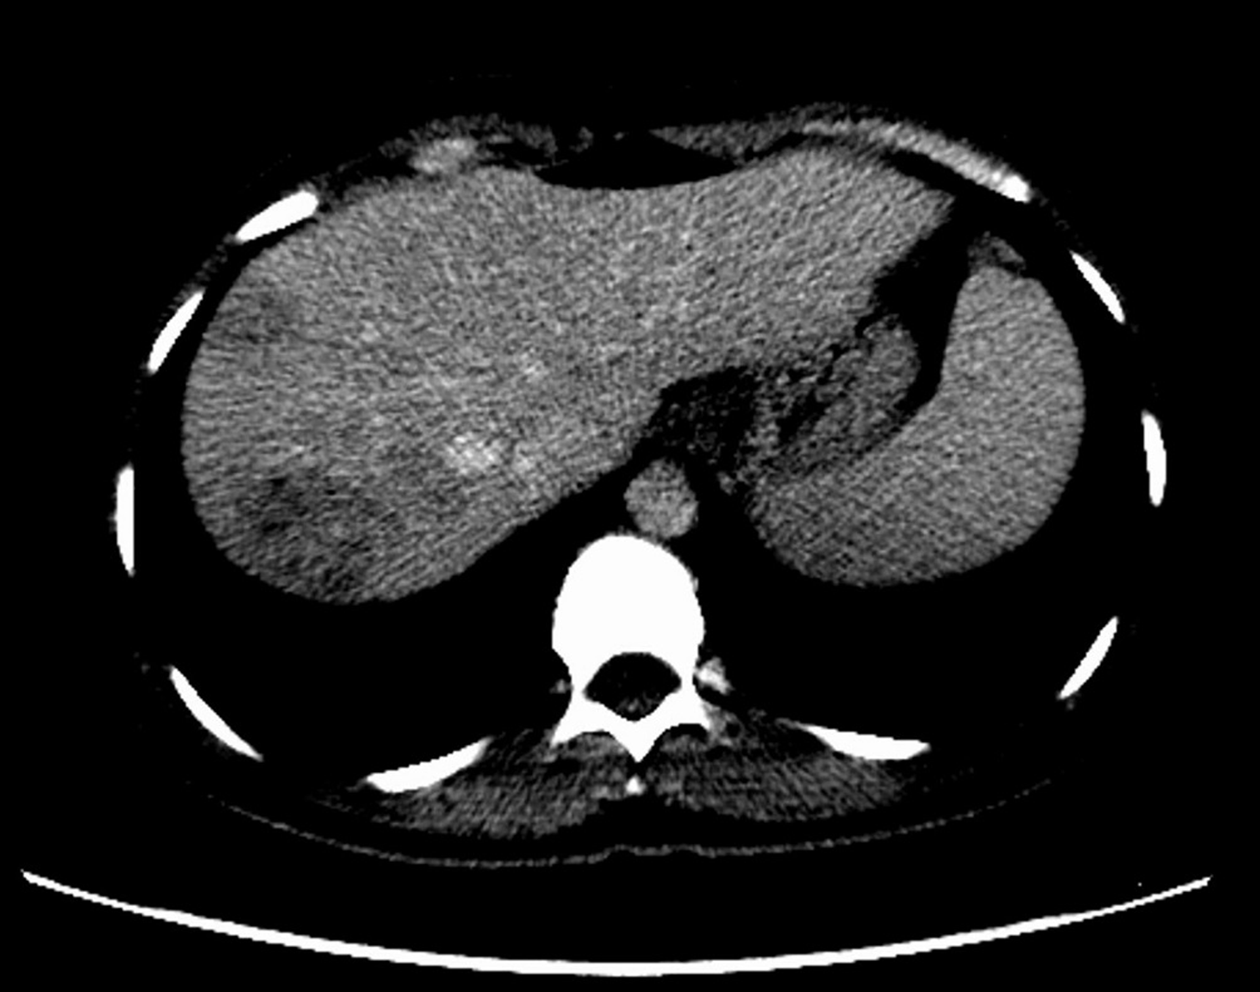
Figure 1 Computed tomography image after contrast medium injection.
Axial computed tomography image revealed that hypodense and heterogenous lesions with soft tissue density of maximally 40 mm × 33 mm in diameter in the right lobe of the liver.
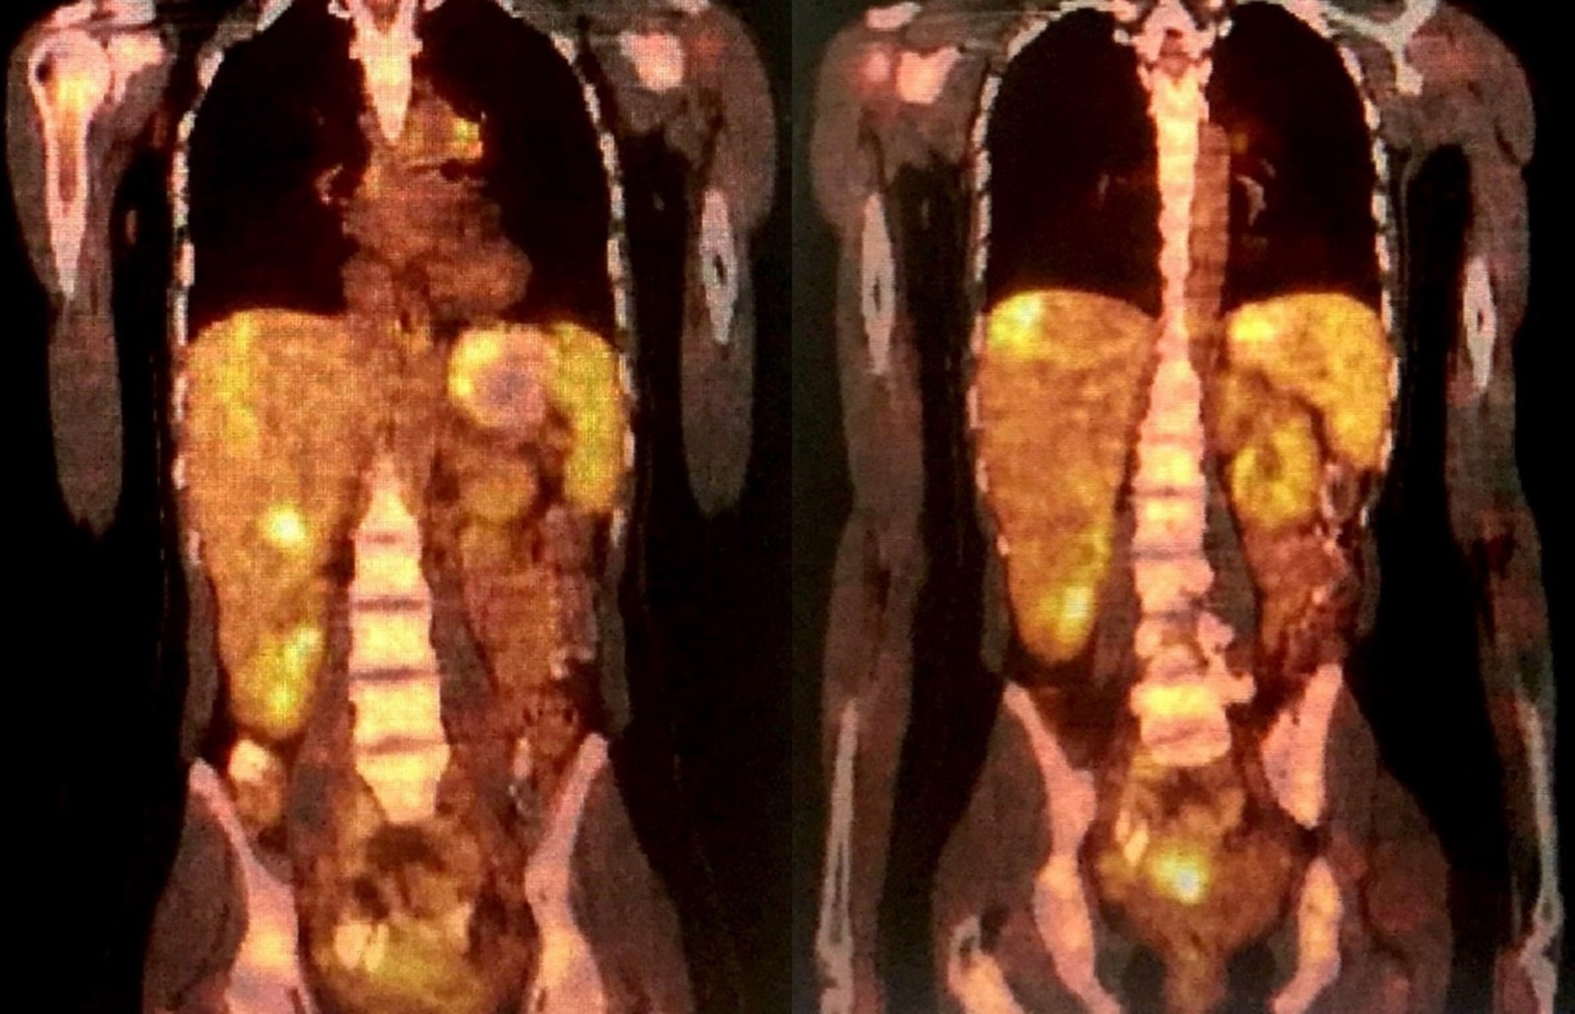
Figure 2 18F-fluorodeoxyglucose positron emission tomography/Computed tomography was performed using 5.
5 mCi of 18F-fluorodeoxyglucose injection. Maximum intensity projection of images shows that high fluorodeoxyglucose uptakes in different segments of the liver.
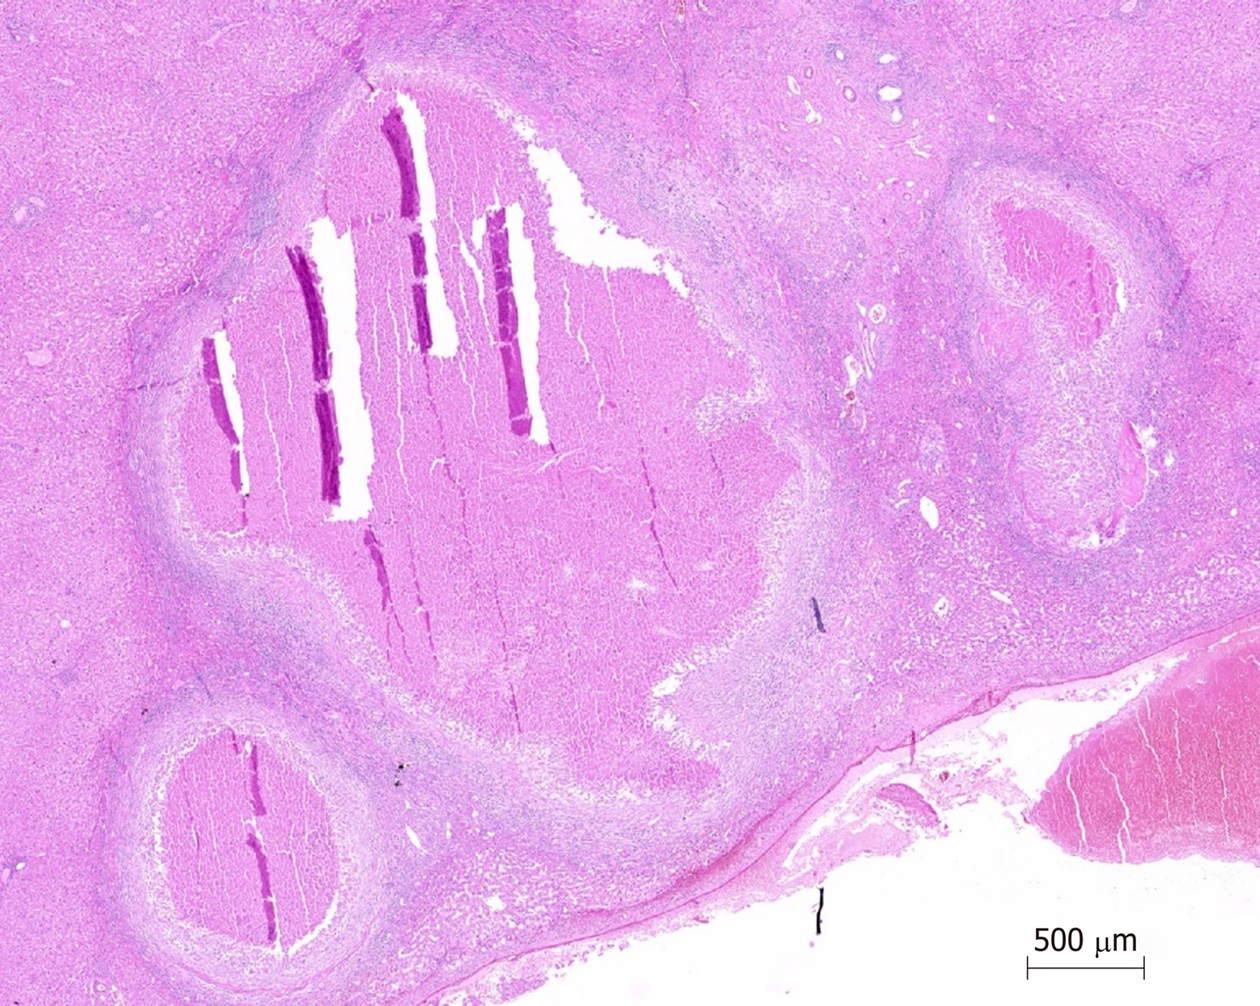
Figure 3 Granuloma with central necrosis (HE ×100).
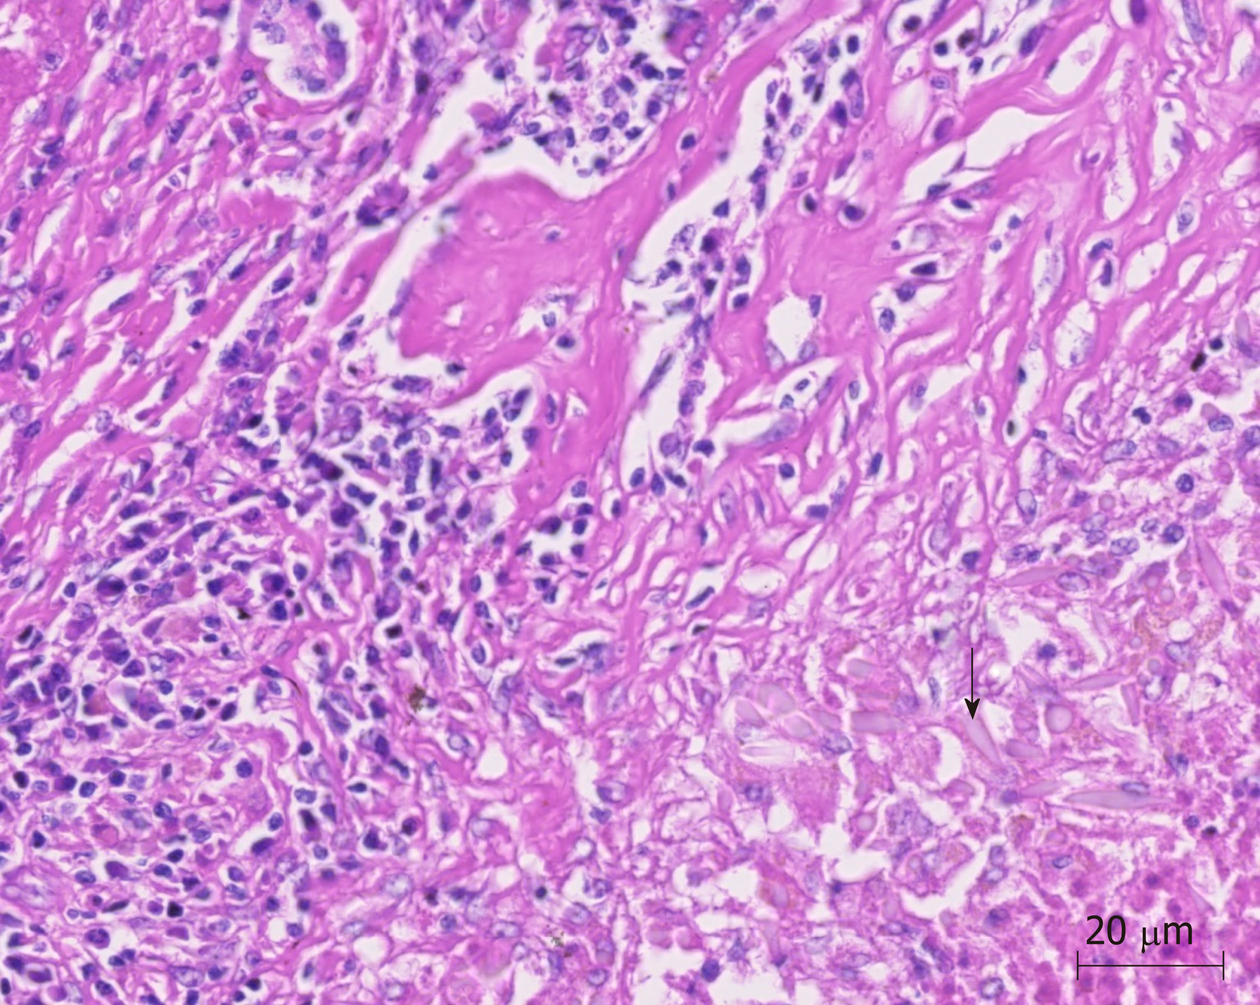
Figure 4 Charcot–Leyden crystals near granuloma (arrows) (HE ×100).
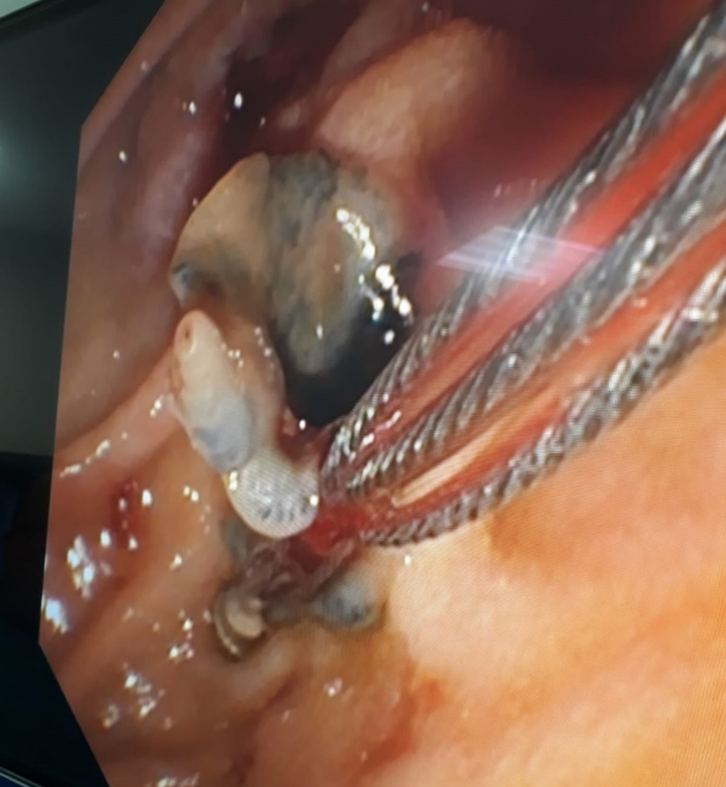
Figure 5 Endoscopic view of endoscopic retrograde cholangiopancreatography procedure.
Extraction of Fasciola hepatica in the common bile duct using a basket catheter.
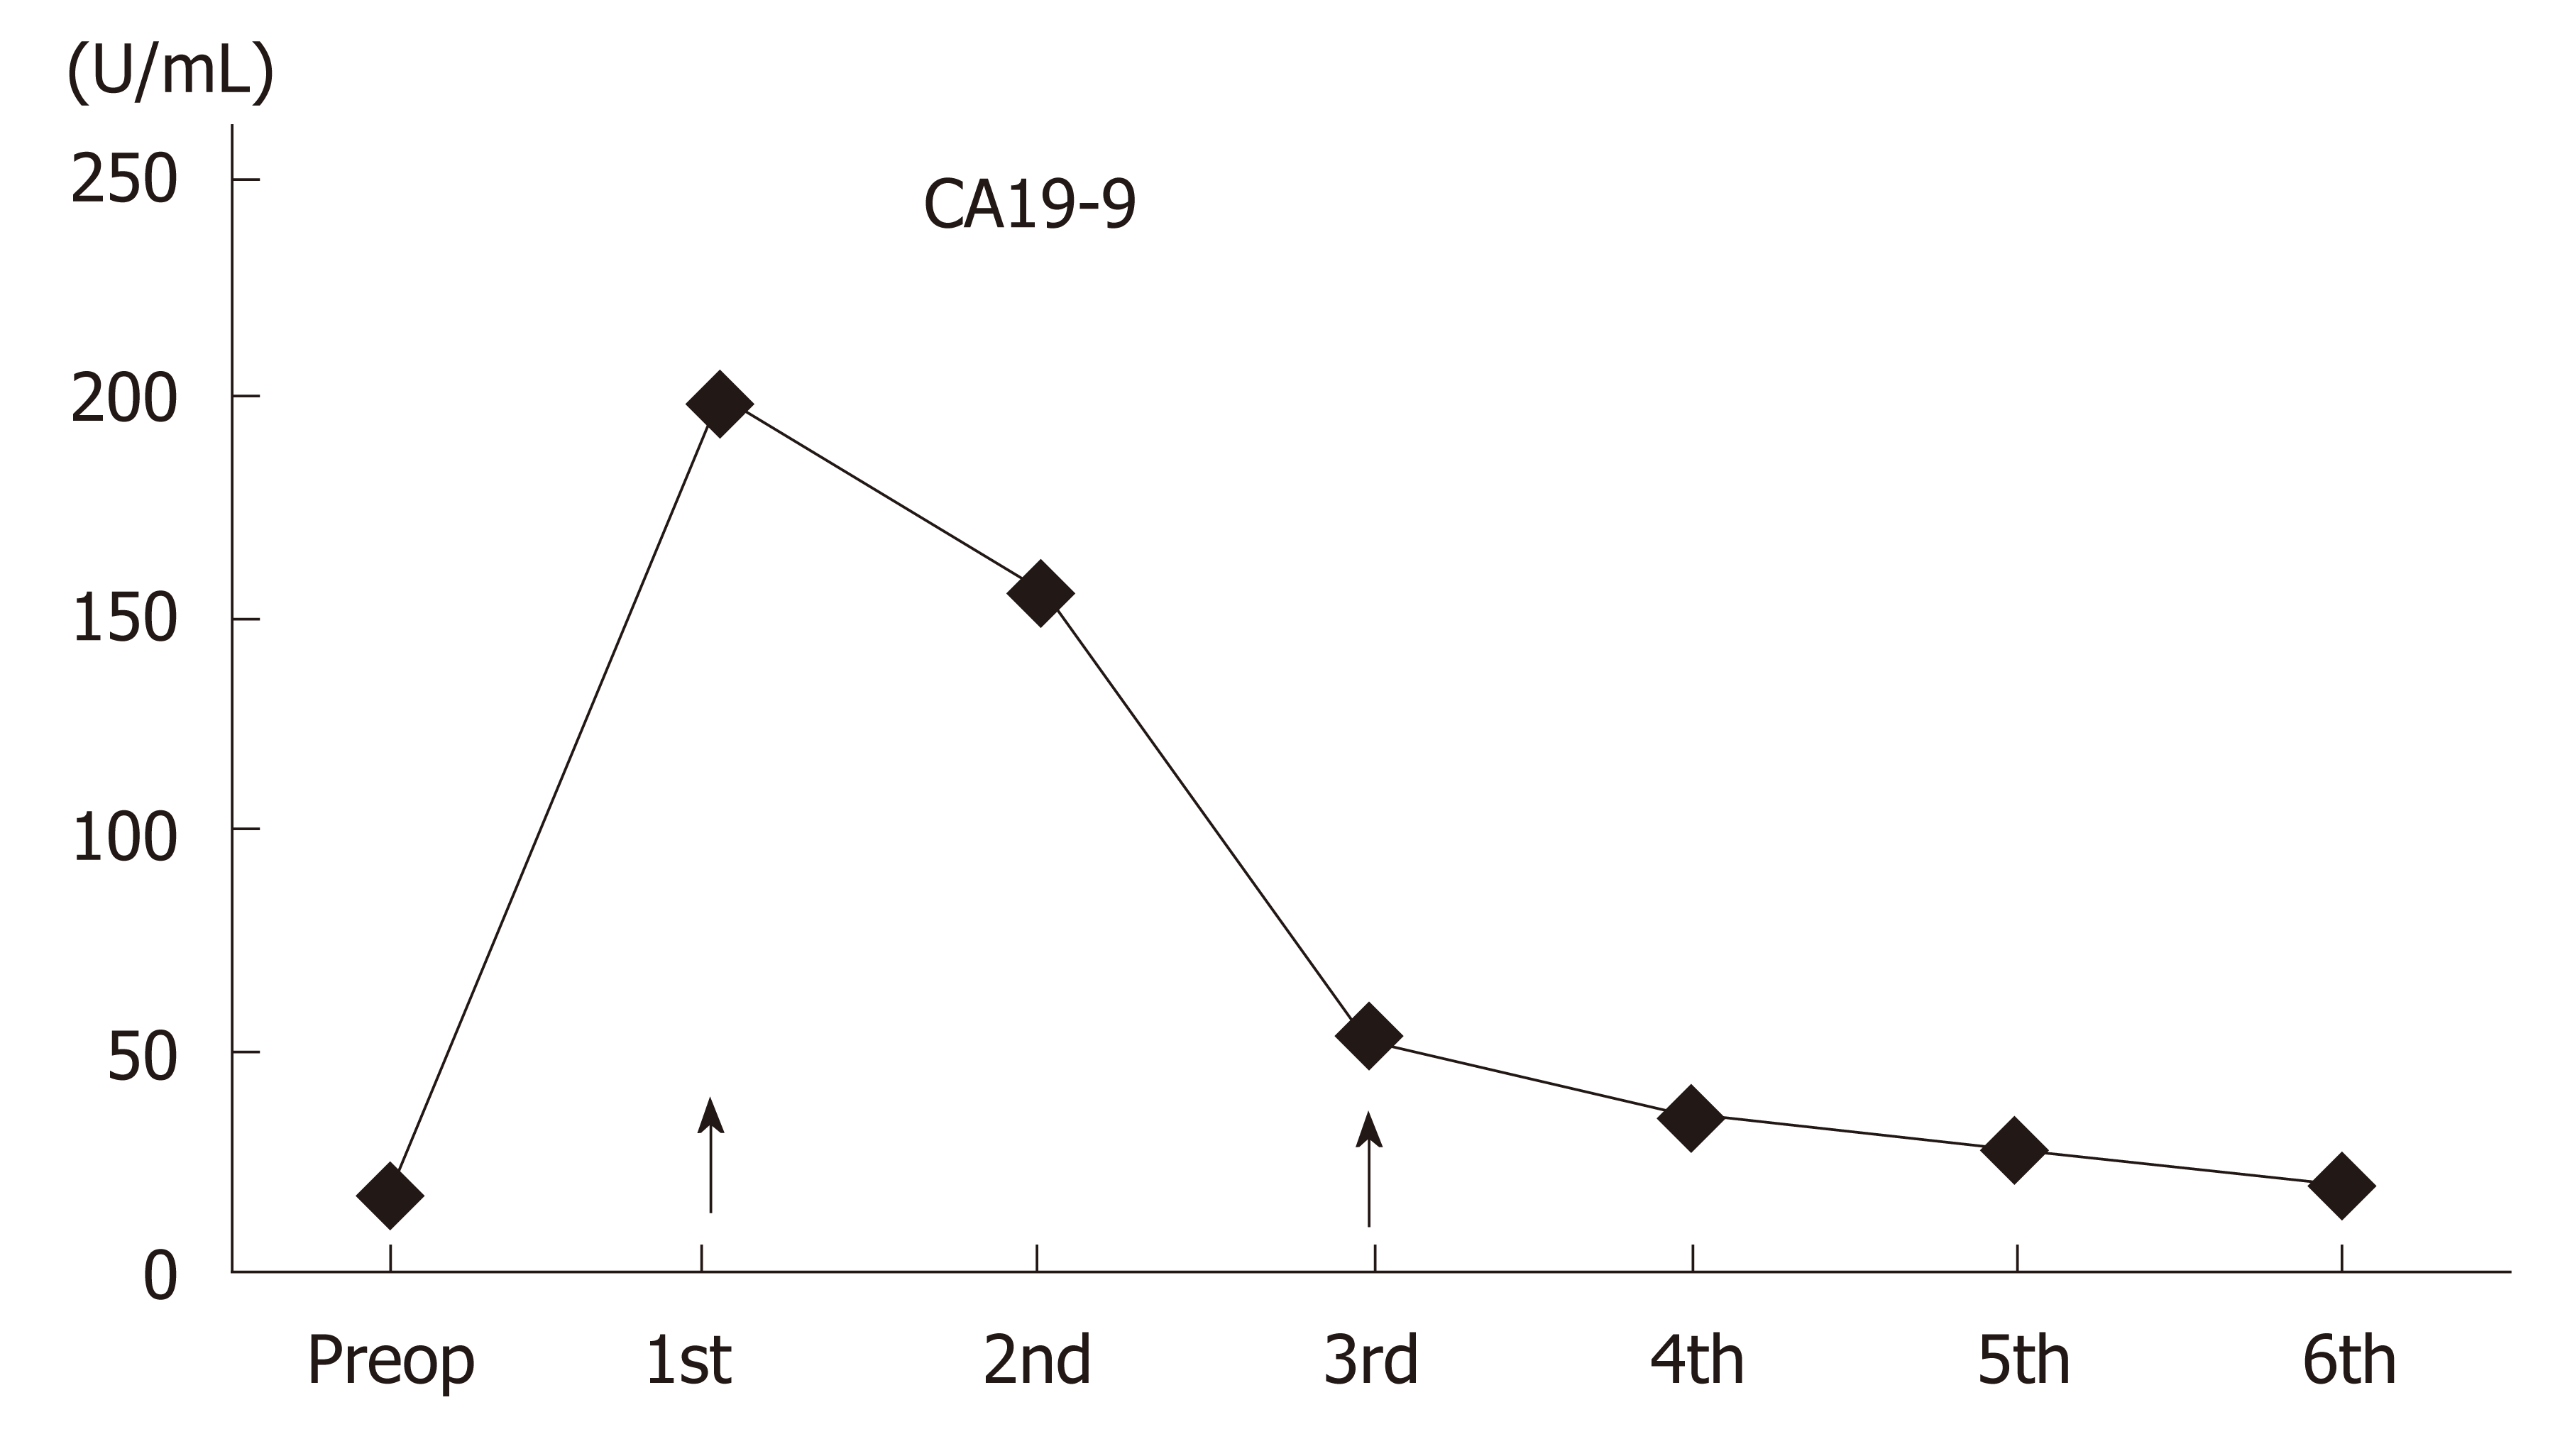
Figure 6 Course of blood CA19-9 levels.
Black arrows indicate the days of endoscopic retrograde cholangiopancreatography.
- Citation: Akbulut S, Ozdemir E, Samdanci E, Unsal S, Harputluoglu M, Yilmaz S. Fascioliasis presenting as colon cancer liver metastasis on 18F-fluorodeoxyglucose positron emission tomography/computed tomography: A case report. World J Hepatol 2019; 11(8): 656-662
- URL: https://www.wjgnet.com/1948-5182/full/v11/i8/656.htm
- DOI: https://dx.doi.org/10.4254/wjh.v11.i8.656


