Copyright
©The Author(s) 2019.
World J Hepatol. Feb 27, 2019; 11(2): 234-241
Published online Feb 27, 2019. doi: 10.4254/wjh.v11.i2.234
Published online Feb 27, 2019. doi: 10.4254/wjh.v11.i2.234
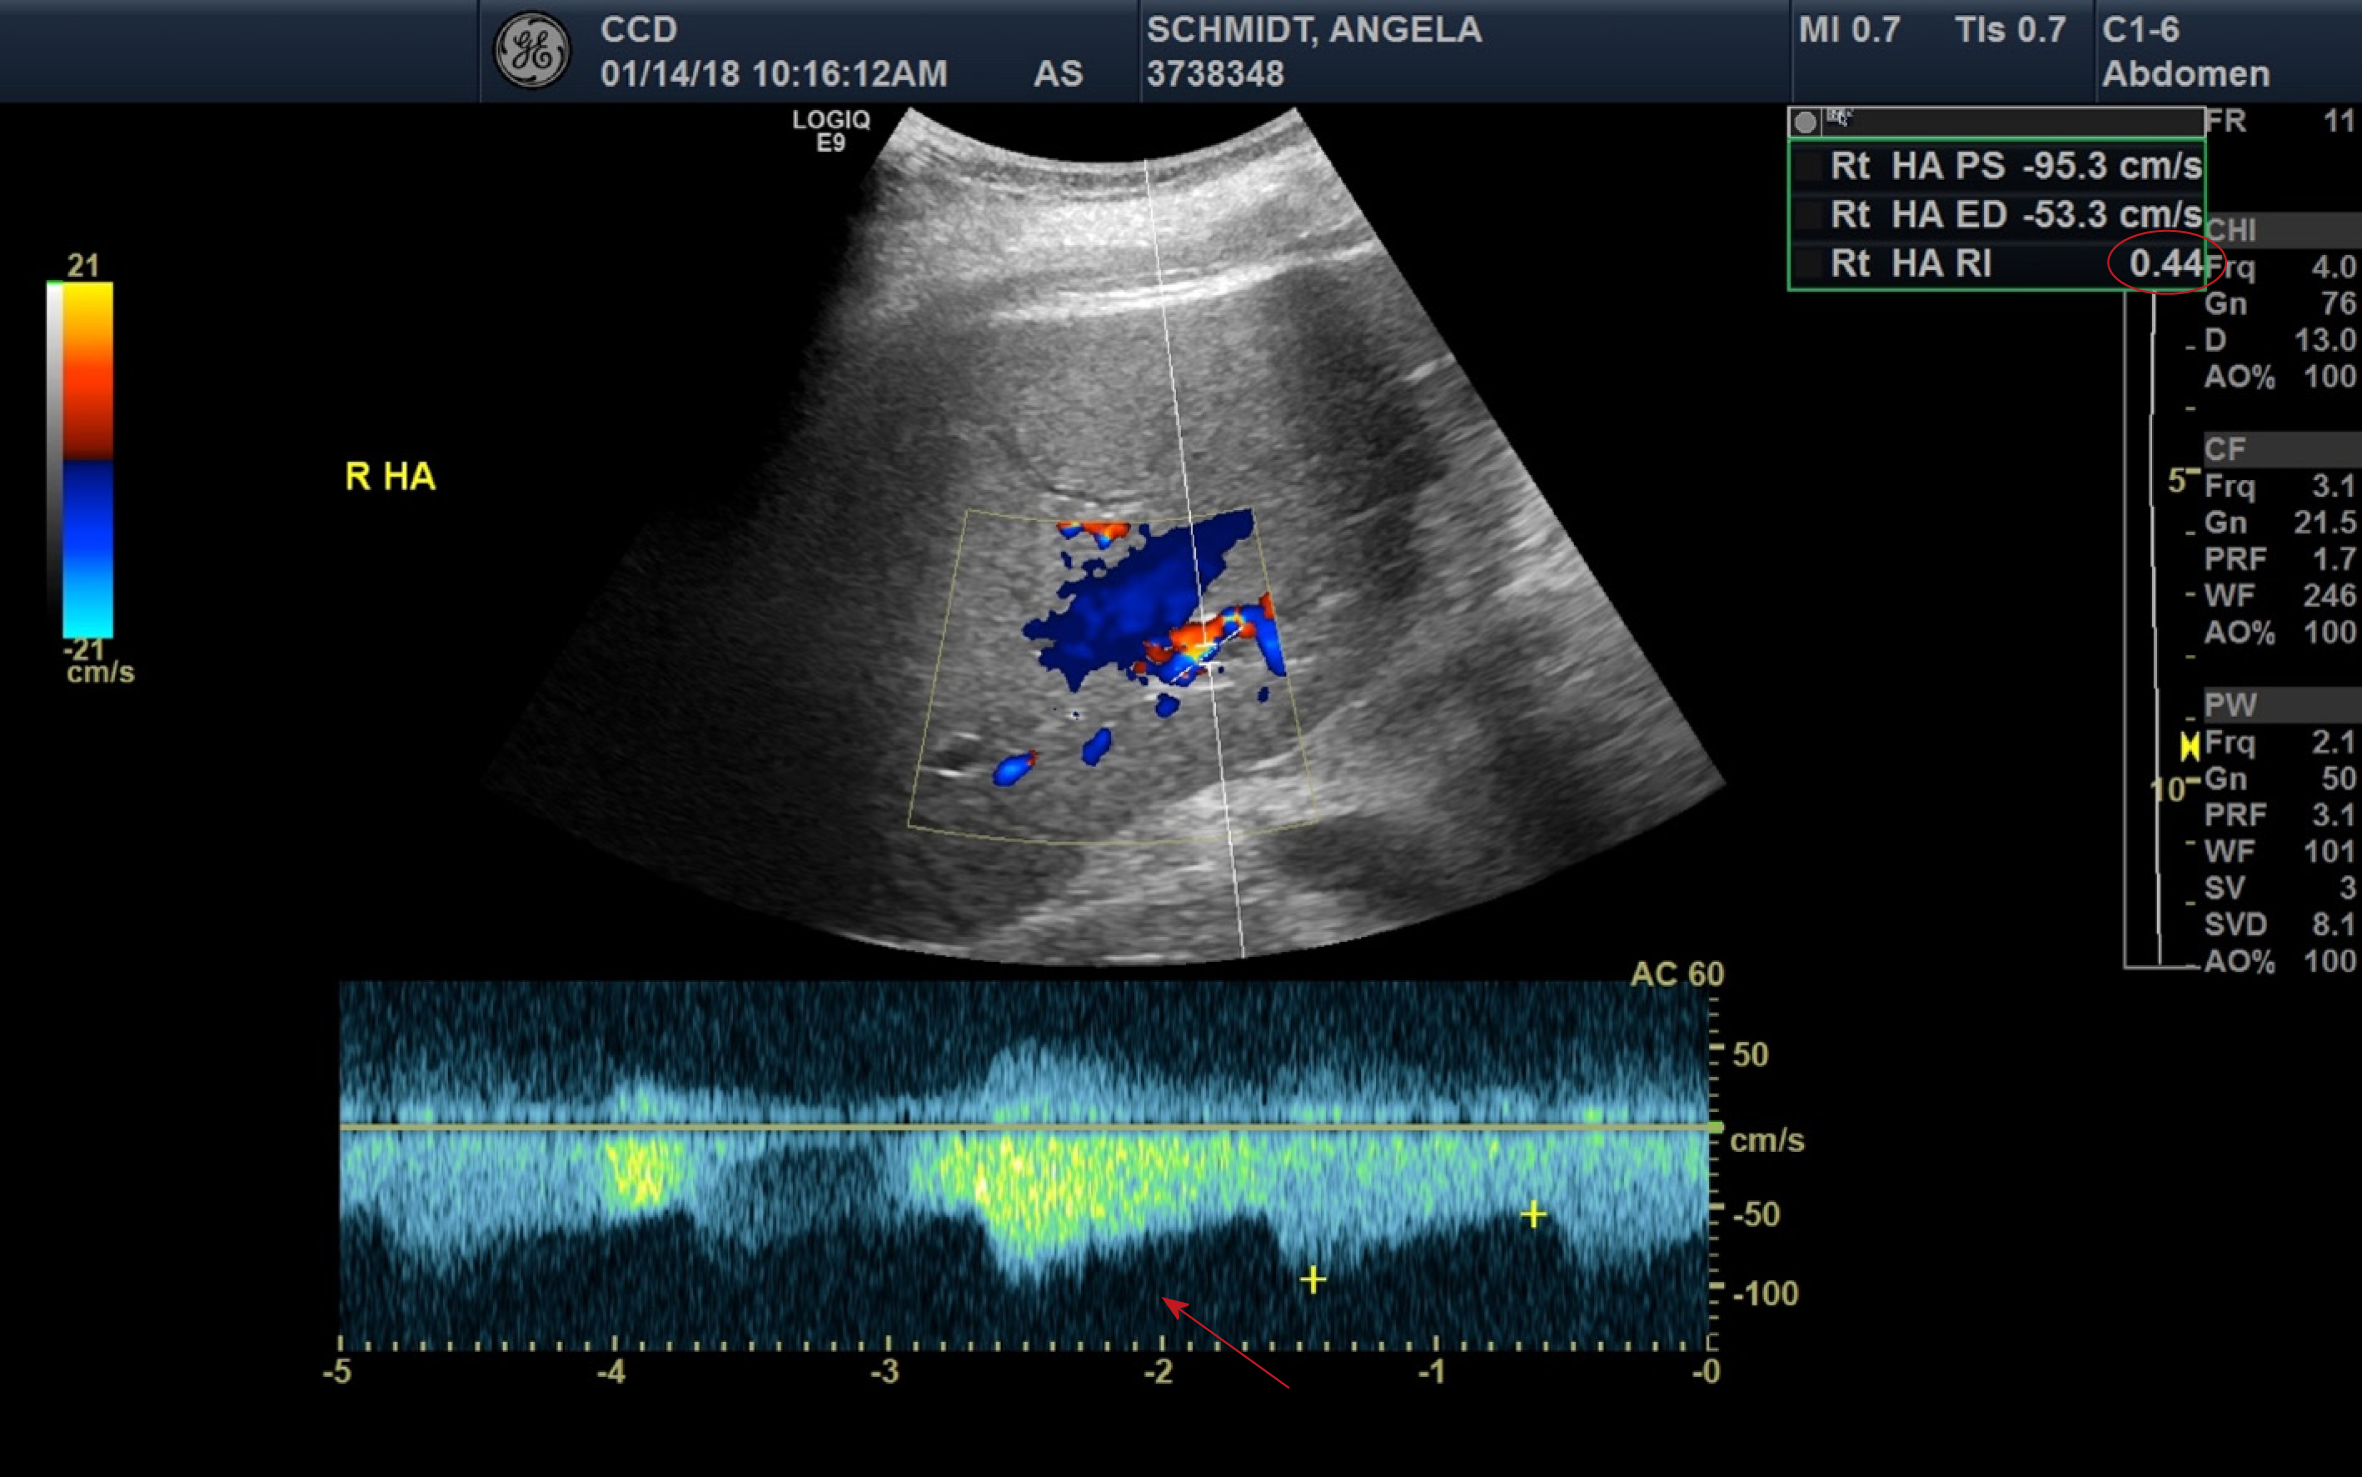
Figure 1 Liver ultrasound with doppler demonstrating increased diastolic flows (red arrow) and reduced resistive indices (noted to be 0.
44 in the upper right corner, red oval) of the right posterior hepatic artery.
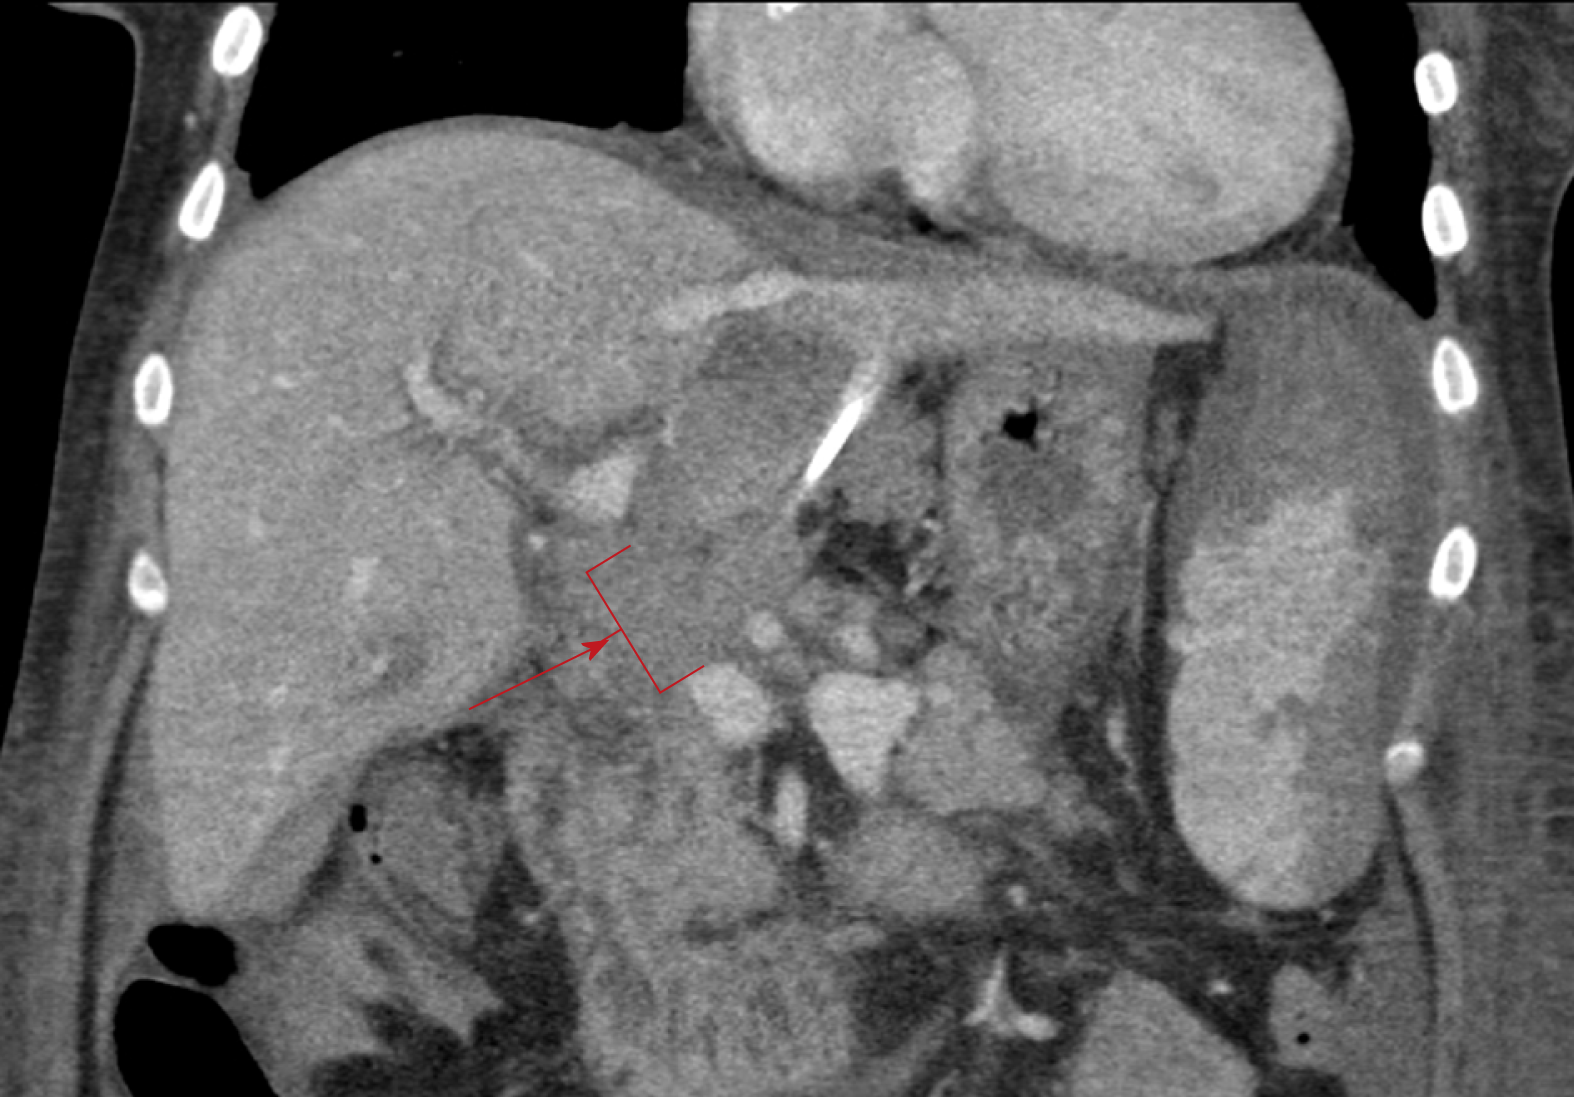
Figure 2 Contrast enhanced venous phase computed tomography abdomen coronal image with red arrow and bracket showing non-opacification of the portal vein, indicating thrombosis.
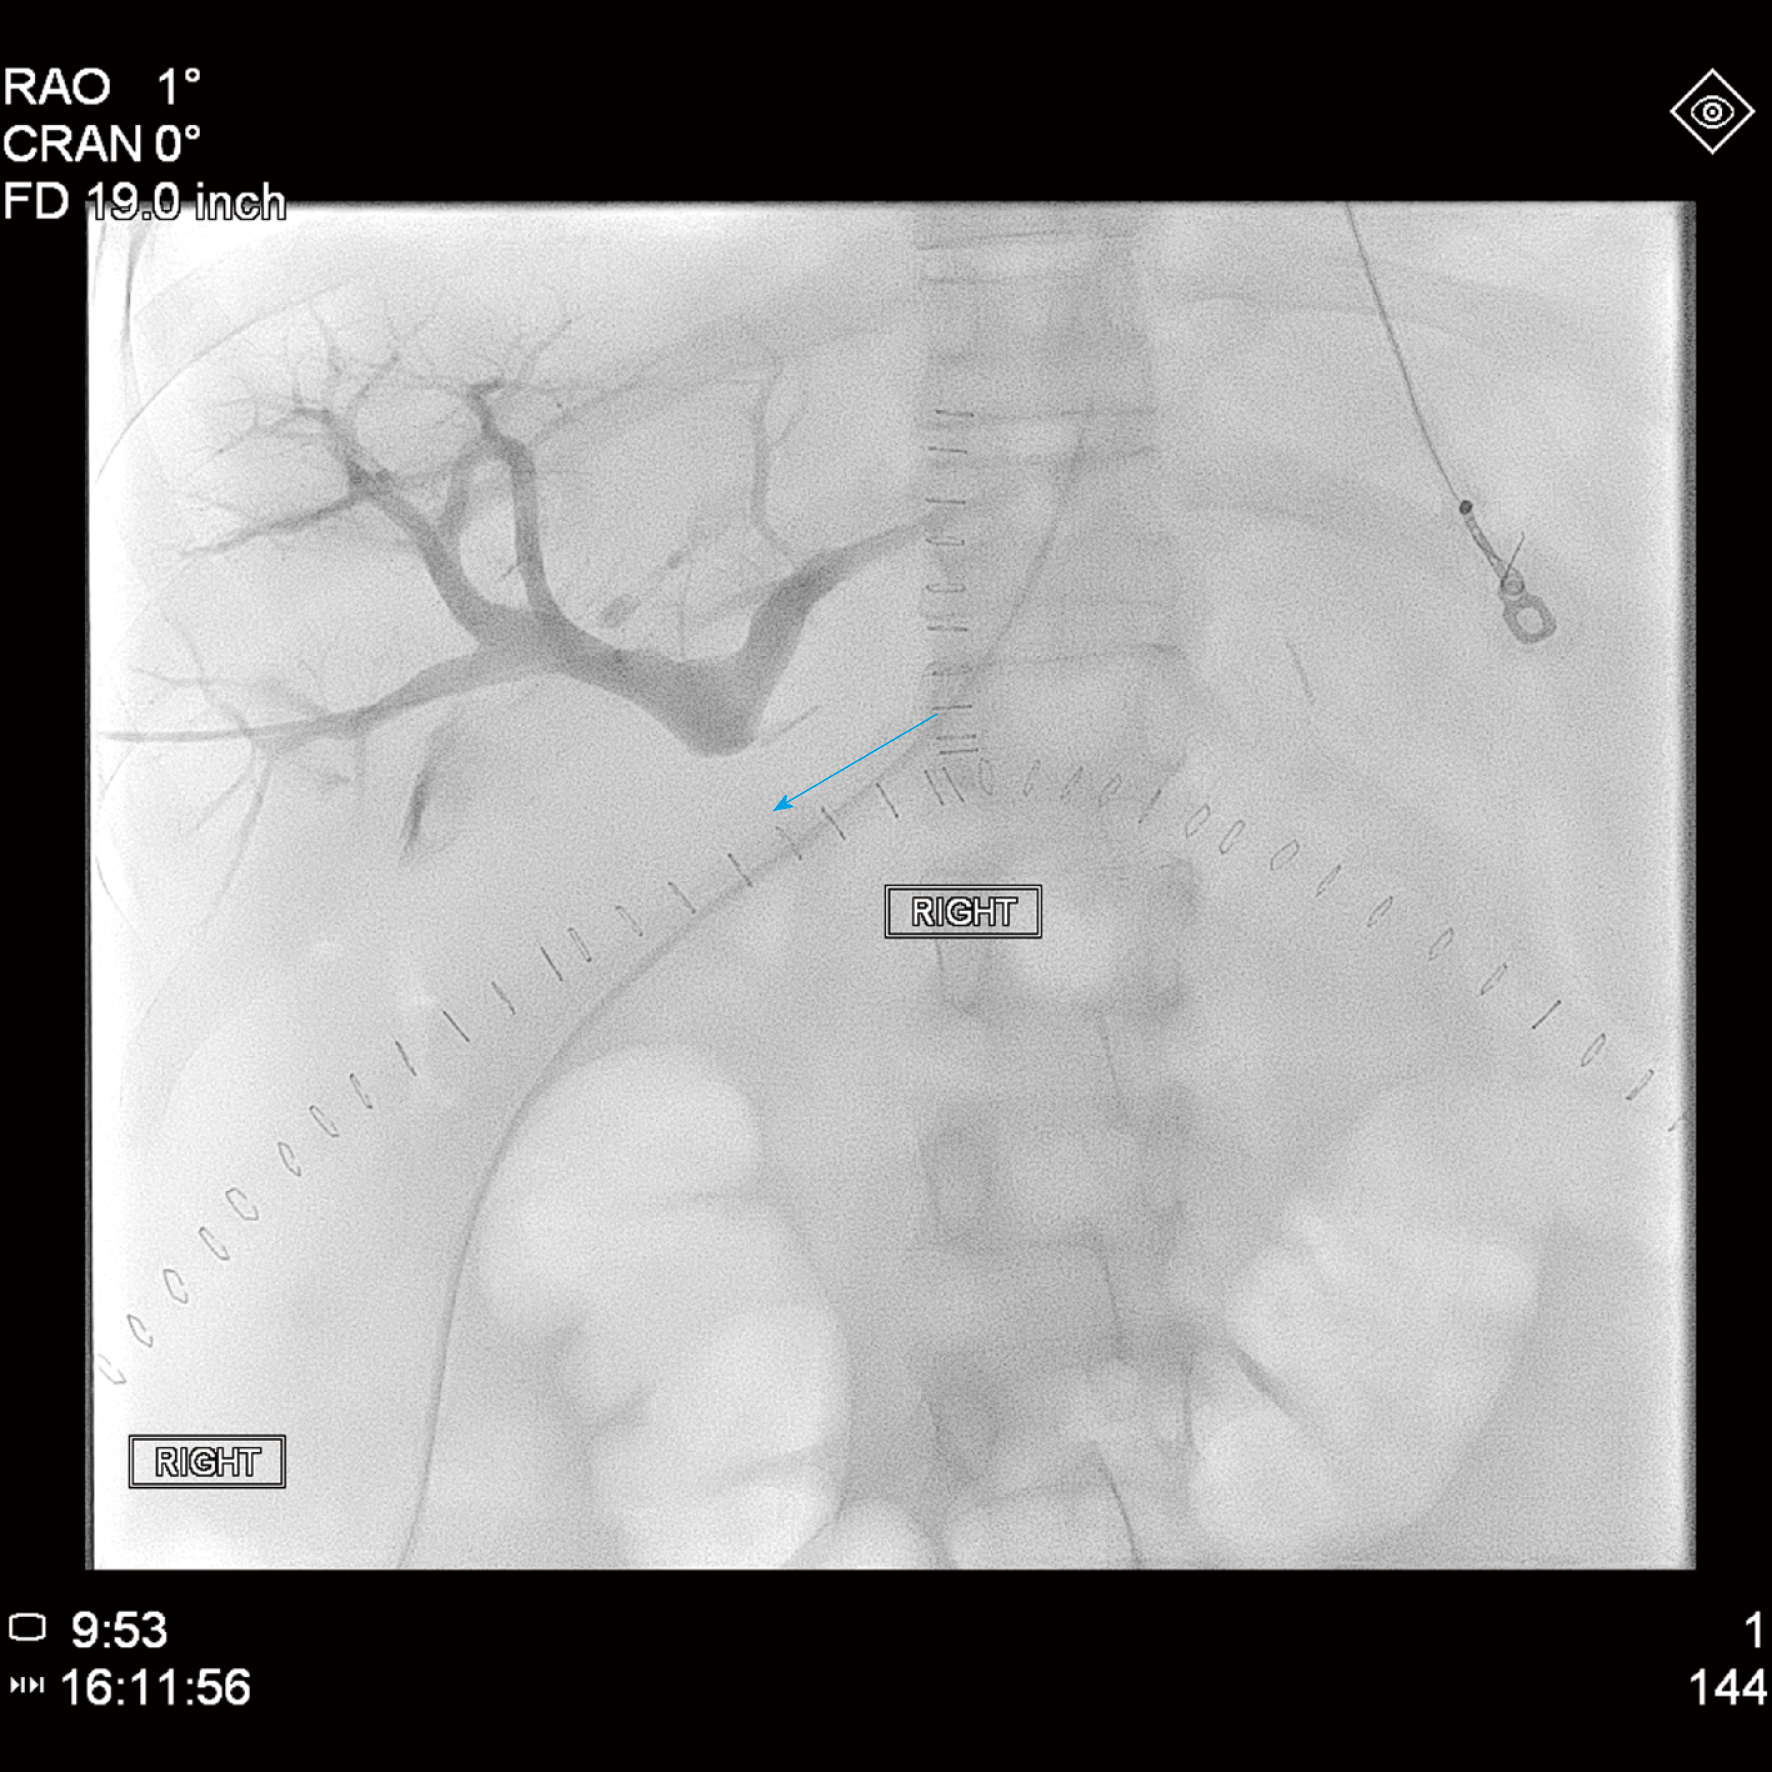
Figure 3 Pre-intervention venography, with the blue arrow denoting the beginning of the patient’s portal vein thrombosis.
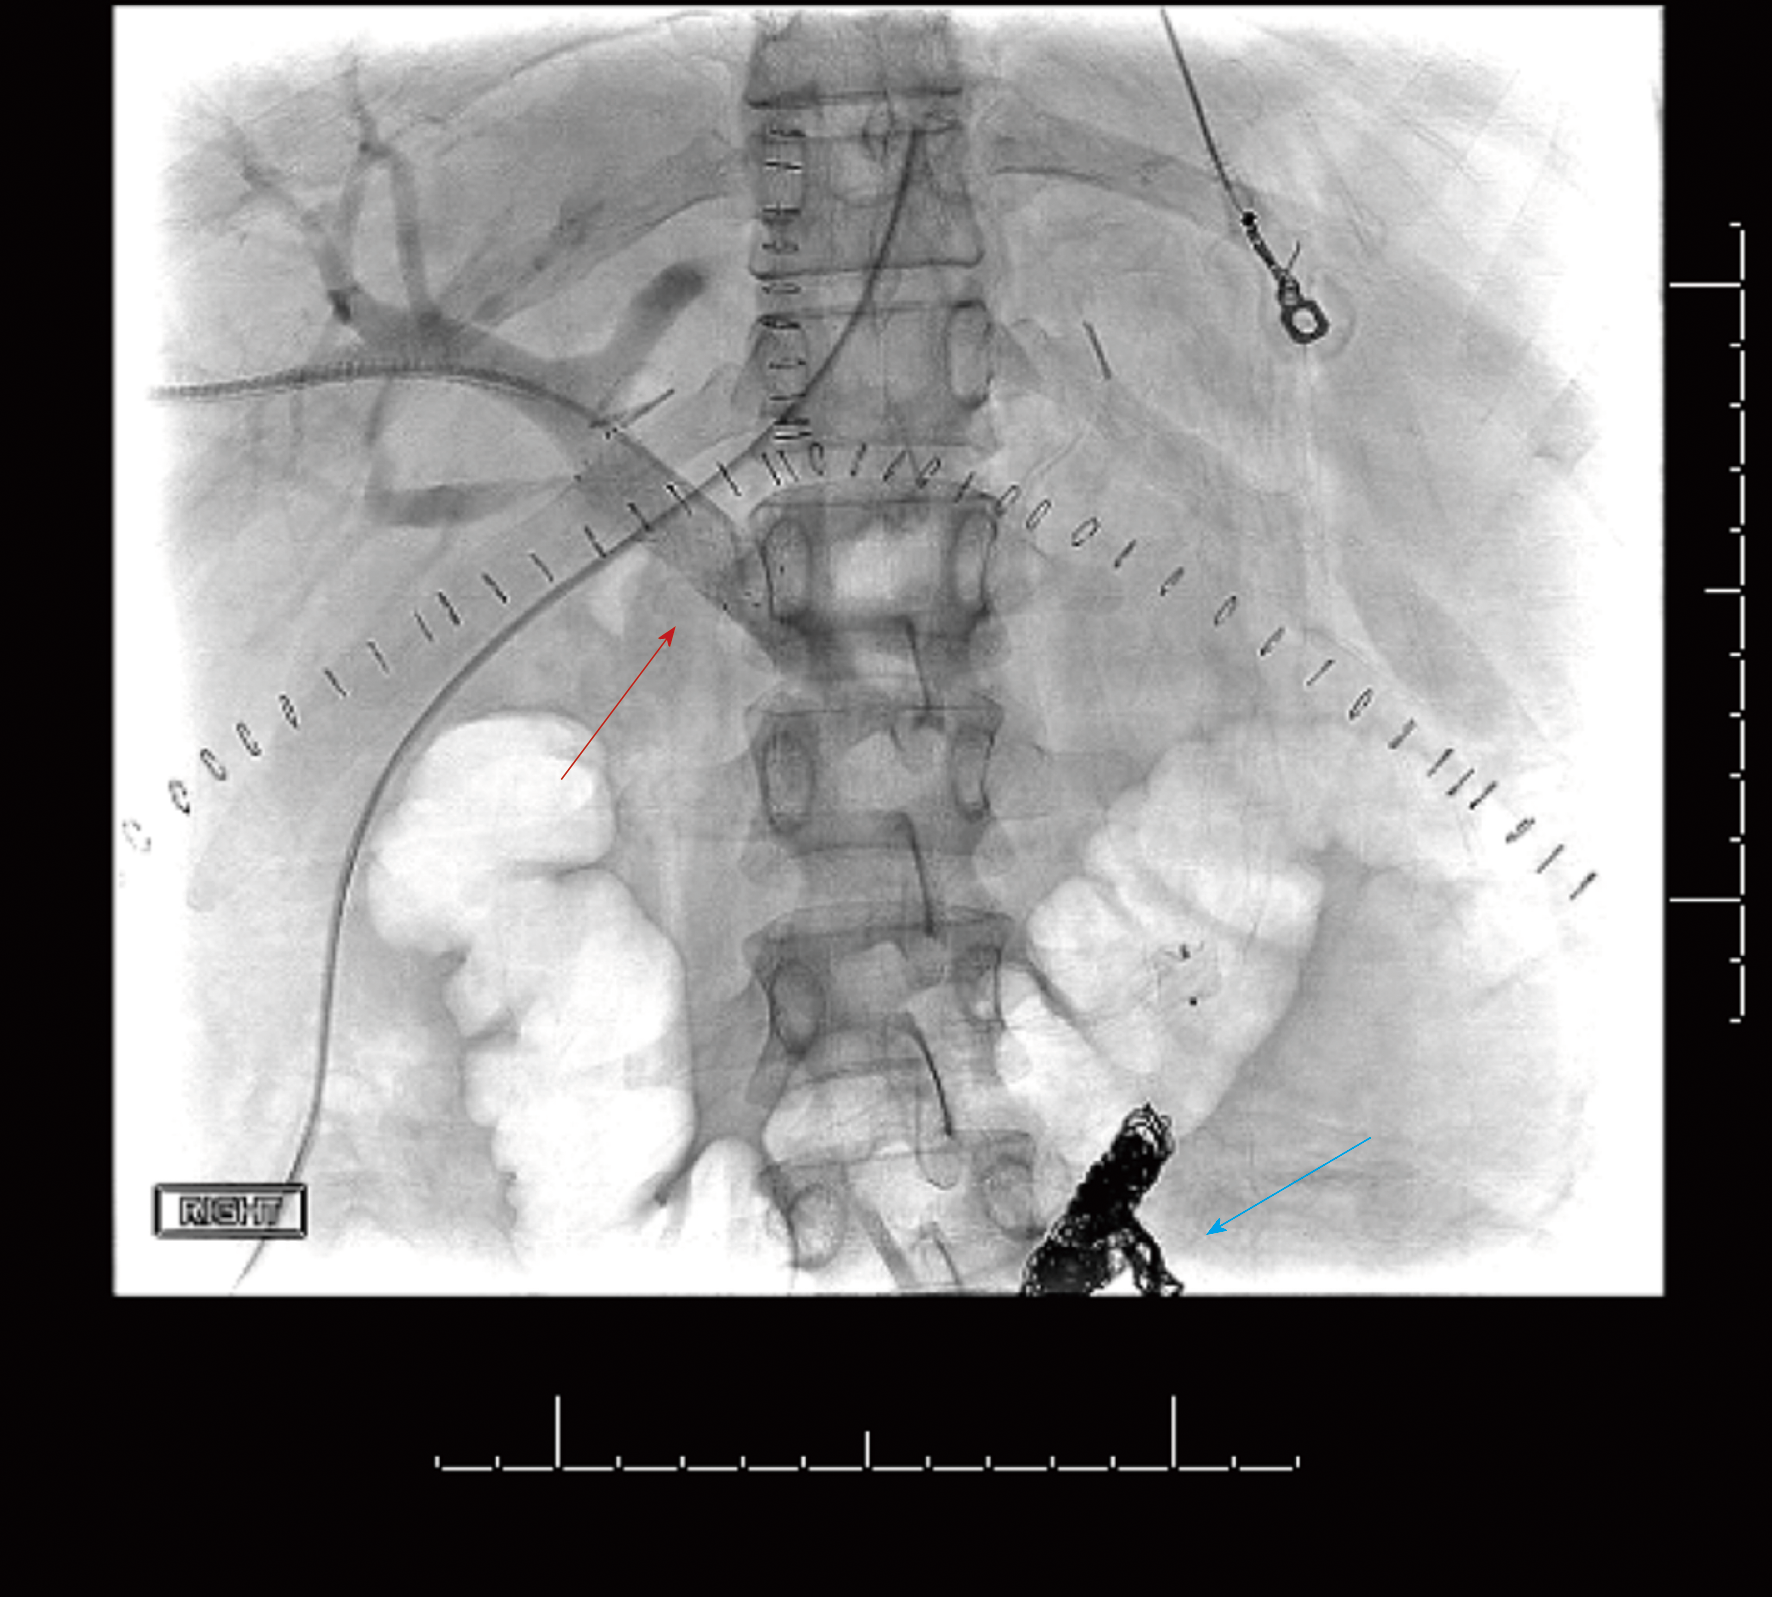
Figure 4 Post-intervention venography, with the red arrow showing recanalization of the portal vein and the uncovered stent, and the blue arrow indicating the coils placed in the inferior mesenteric vein.
- Citation: Couri T, Harmath C, Baker T, Pillai A. Acute portal vein thrombosis after liver transplant presenting with subtle ultrasound abnormalities: A case report and literature review. World J Hepatol 2019; 11(2): 234-241
- URL: https://www.wjgnet.com/1948-5182/full/v11/i2/234.htm
- DOI: https://dx.doi.org/10.4254/wjh.v11.i2.234


