Copyright
©The Author(s) 2018.
World J Hepatol. Oct 27, 2018; 10(10): 772-779
Published online Oct 27, 2018. doi: 10.4254/wjh.v10.i10.772
Published online Oct 27, 2018. doi: 10.4254/wjh.v10.i10.772
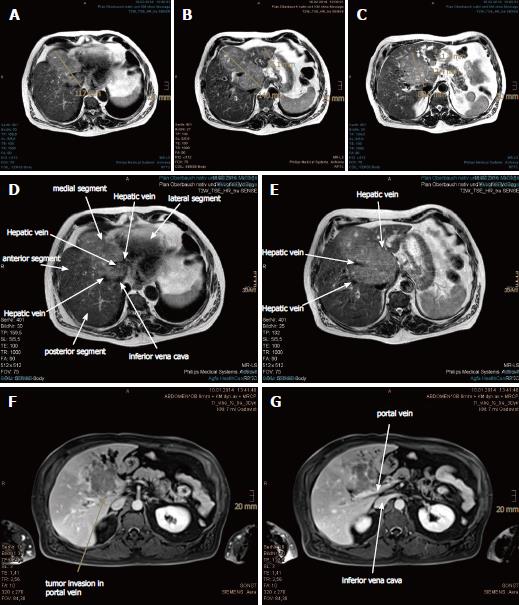
Figure 1 Large hepatocellular carcinoma with vascular invasion and satellite metastases in the magnetic resonance imaging scan prior to proton beam therapy.
A: The upper portion of the main tumor abutting the heart in axial plane is shown; B: Extended hepatocellular carcinoma (HCC) with invasion of portal and hepatic veins in the axial plane is shown; C: The lower portion of the main tumor abutting the inferior vena cava is shown, with dilated segmental bile ducts and 2 liver metastases in the left hepatic lobe; D-G: The HCC involved all three hepatic veins as well as the portal vein. The inferior vena cava was also compressed.
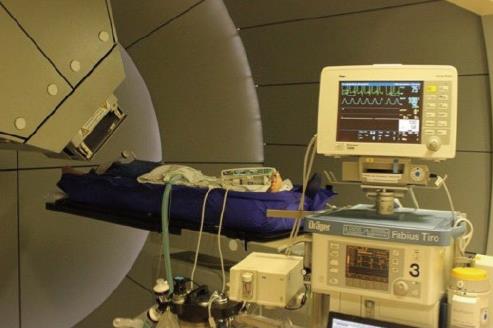
Figure 2 Proton beam therapy in use with apenic oxygenation under general anesthesia.
Figure 3 Tumor regression evidenced in the first follow-up magnetic resonance imaging scan at 3 mo after proton beam therapy.
A-C: Size reductions of the main tumor and the liver metastases are shown, measured in three levels of axial plane.
Figure 4 Continuous tumor shrinkage evidenced in the magnetic resonance imaging scan at 9 mo after proton beam therapy.
A-C: The hepatocellular carcinoma and liver metastases presented as residual nodules without contrast enhancement.
Figure 5 Continuous tumor shrinkage evidenced in the magnetic resonance imaging scan at 21 mo after proton beam therapy.
A-C: Further size reductions of the residual tumor nodules in the axial plane are shown.
Figure 6 Residual nodules in the hepatic hilum without enhancement evidenced in the latest magnetic resonance imaging scan, at 40 mo after proton beam therapy.
A: Complete regression of the upper portion of the hepatocellular carcinoma is shown; B: Pronounced indentation of the right-sided liver contour is shown, as if the patient had undergone a liver resection; C: The portal vein was able to be delimited again.
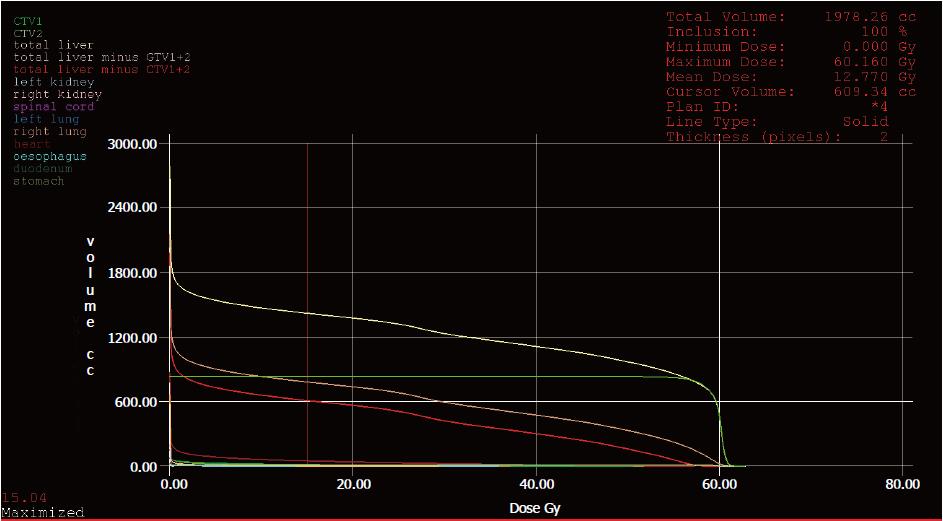
Figure 7 Dose-volume histogram of the clinical target volume and organs at risk.
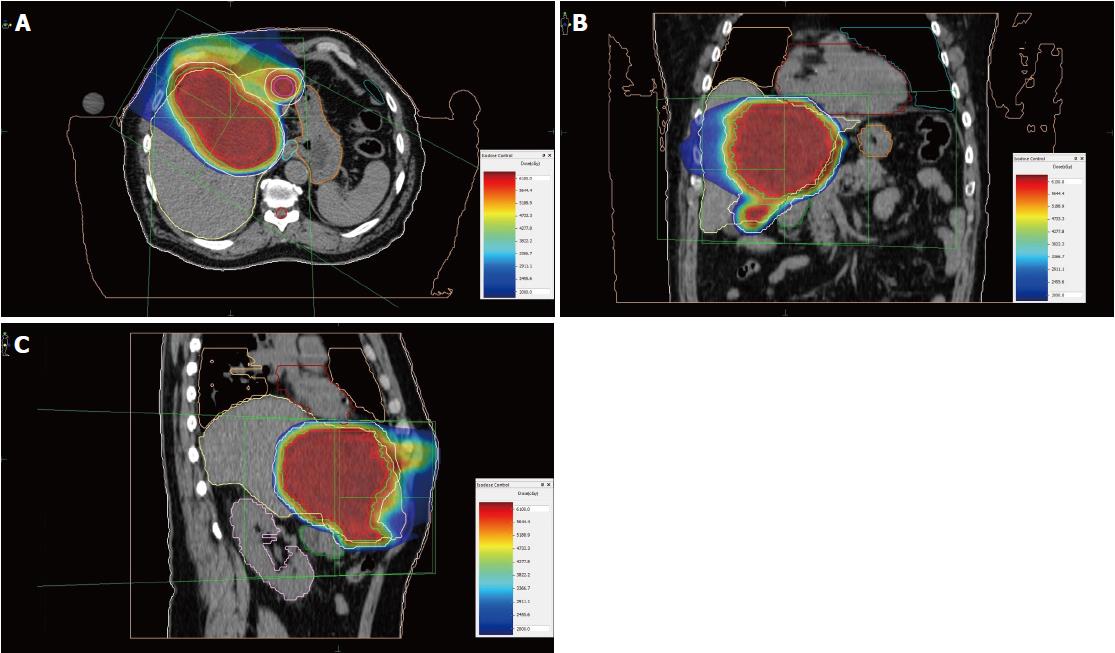
Figure 8 Treatment plan of proton beam therapy with isodose distributions.
A: Axial plane; B: Coronal plane; C: Sagittal plane. Red line: Gross tumor volume; Green line: Clinical target volume.
- Citation: Lin YL. Proton beam therapy in apneic oxygenation treatment of an unresectable hepatocellular carcinoma: A case report and review of literature. World J Hepatol 2018; 10(10): 772-779
- URL: https://www.wjgnet.com/1948-5182/full/v10/i10/772.htm
- DOI: https://dx.doi.org/10.4254/wjh.v10.i10.772


