Copyright
©The Author(s) 2018.
World J Hepatol. Jan 27, 2018; 10(1): 95-104
Published online Jan 27, 2018. doi: 10.4254/wjh.v10.i1.95
Published online Jan 27, 2018. doi: 10.4254/wjh.v10.i1.95
Figure 1 Patient flow diagram.
In this diagram, treatment response evaluated by contrast-enhanced ultrasonography (CEUS) and/or dynamic computed tomography (CT) immediately, one month and six months after DEB-TACE for hepatocellular carcinoma (HCC) using mRECIST. Findings on CEUS or dynamic CT were evaluated using mRECIST criteria. 1Complete treatment: Disappearance of the tumor enhancement after DEB-TACE by IAUS findings; 2Incomplete treatment: Presence of residual tumor enhancement after DEB-TACE by IAUS findings. CR: Complete response; PR: Partial response; SD: Stable disease; PD: Progressive disease.
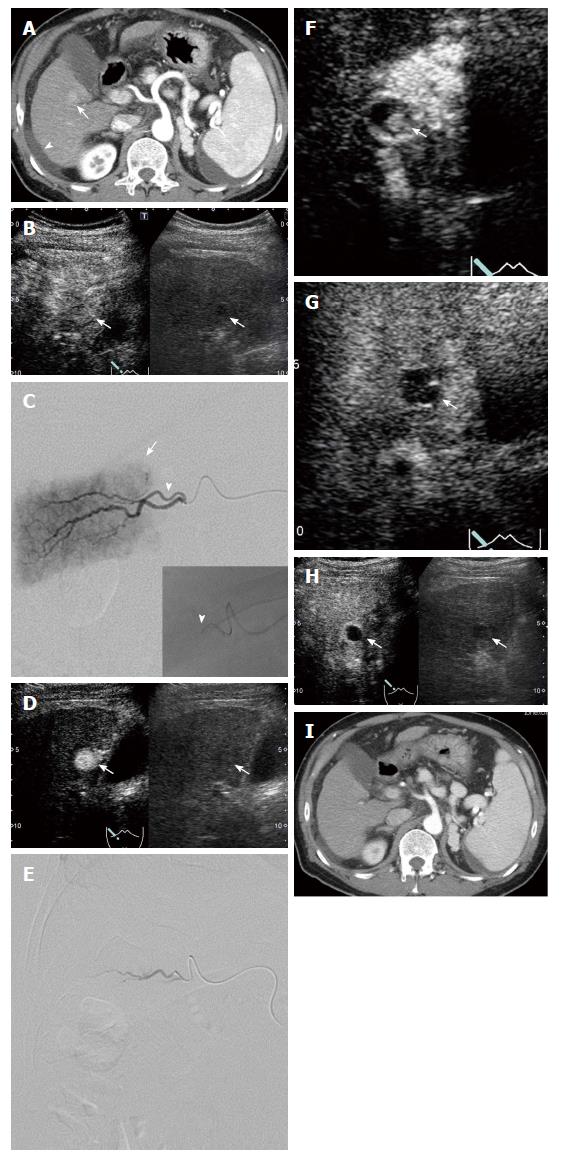
Figure 2 The patient was a 59-year-old male with alcoholic liver cirrhosis.
DEB-TACE and transcatheter CEUS (IAUS) using Sonazoid for HCC in S5 with a diameter of 15 mm were performed. A: Dynamic CT in the arterial phase before DEB-TACE showed a hypervascular lesion in S5 (arrow) and ascites (arrow head); B: CEUS in the arterial phase (40 s) before DEB-TACE showed a hyperenhanced lesion in S5 (arrow) (Right image: Monitor mode); C: Digital subtraction angiography (DSA) from a branch of A6 (arrow head) before DEB-TACE showed tumor enhancement (arrow). Insert image: A coaxial microcatheter was advanced in the feeding artery (arrow head); D: IAUS from the branch of A6 before DEB-TACE showed a hyperenhanced lesion (arrow). (Right image: monitor mode); E: DSA from A6 after DEB-TACE (when contrast medium disappeared from the blood vessel within 5-6 heart beats) eliminated the tumor enhancement; F: IAUS from A6 after DEB-TACE showed a residual hyperenhanced area in the tumor (arrow) in spite of elimination of tumor enhancement by DSA. Therefore, DEB-TACE for this lesion was performed repeatedly until the hyperenhanced area disappeared; G: IAUS from the right hepatic artery eliminated the residual area in the tumor (arrow); H: CEUS in the arterial phase (40 s) showed unenhancement lesion in S5 three days after DEB-TACE (arrow) (Right image: monitor mode); I: Dynamic CT in the arterial phase did not show the hypervascular lesion six months after DEB-TACE.
Figure 3 The patient was a 76-year-old female with hepatitis C virus cirrhosis.
DEB-TACE and IAUS for HCC in S3 with a diameter of 17 mm were performed. A: Dynamic CT in the arterial phase before DEB-TACE showed a hypervascular lesion in S3 (arrow); B: CEUS in the arterial phase before DEB-TACE showed a hyperenhanced lesion in S3 (arrow) and S2 (arrow head). Radiofrequency ablation was performed for the lesion in S3 after DEB-TACE (Right image: monitor mode); C: DSA from A3 before DEB-TACE showed tumor enhancement (arrow); D: IAUS from A3 before DEB-TACE showed a hyperenhanced lesion (arrow) with a small hypoenhanced area (arrow head), which was not recognized during the procedure. This small hypoenhanced area was recognized with stored video images after DEB-TACE procedure; E: DSA from A3 after DEB-TACE (when contrast medium disappeared from the blood vessel within 5-6 heart beats) eliminated the tumor enhancement; F: The enhanced lesion was disappeared by IAUS from A3 after DEB-TACE (arrow); G: CEUS showed enhancement area in the tumor (arrow head) and extrahepatic feeding artery (arrow) three days after DEB-TACE. It was thought this artery fed the small hypoenhanced area.
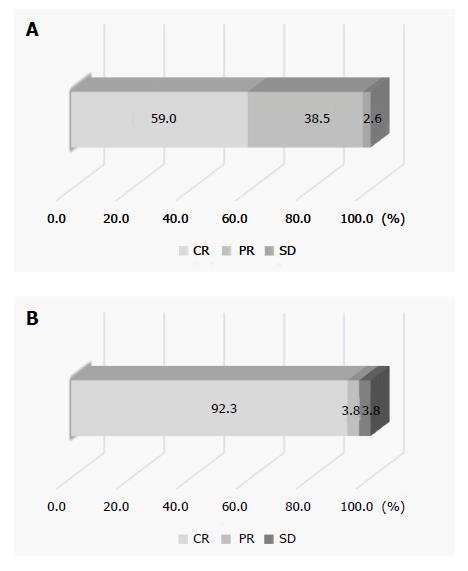
Figure 4 Treatment response.
A: The overall complete response (CR) rate of all thirty-nine lesions at one month after treatment; B: The overall CR rate of twenty-six lesions treated completely at six months after treatment. PR: Partial response; SD: Stable disease; PD: Progressive disease.
- Citation: Shiozawa K, Watanabe M, Ikehara T, Yamamoto S, Matsui T, Saigusa Y, Igarashi Y, Maetani I. Efficacy of intra-arterial contrast-enhanced ultrasonography during transarterial chemoembolization with drug-eluting beads for hepatocellular carcinoma. World J Hepatol 2018; 10(1): 95-104
- URL: https://www.wjgnet.com/1948-5182/full/v10/i1/95.htm
- DOI: https://dx.doi.org/10.4254/wjh.v10.i1.95


