Copyright
©The Author(s) 2018.
World J Hepatol. Jan 27, 2018; 10(1): 95-104
Published online Jan 27, 2018. doi: 10.4254/wjh.v10.i1.95
Published online Jan 27, 2018. doi: 10.4254/wjh.v10.i1.95
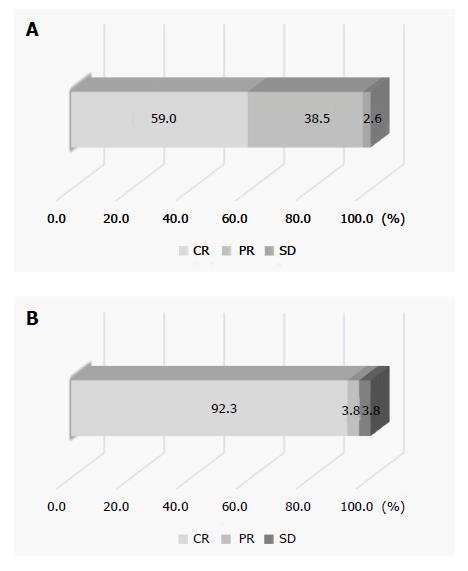
Figure 4 Treatment response.
A: The overall complete response (CR) rate of all thirty-nine lesions at one month after treatment; B: The overall CR rate of twenty-six lesions treated completely at six months after treatment. PR: Partial response; SD: Stable disease; PD: Progressive disease.
- Citation: Shiozawa K, Watanabe M, Ikehara T, Yamamoto S, Matsui T, Saigusa Y, Igarashi Y, Maetani I. Efficacy of intra-arterial contrast-enhanced ultrasonography during transarterial chemoembolization with drug-eluting beads for hepatocellular carcinoma. World J Hepatol 2018; 10(1): 95-104
- URL: https://www.wjgnet.com/1948-5182/full/v10/i1/95.htm
- DOI: https://dx.doi.org/10.4254/wjh.v10.i1.95


