Copyright
©The Author(s) 2018.
World J Hepatol. Jan 27, 2018; 10(1): 73-81
Published online Jan 27, 2018. doi: 10.4254/wjh.v10.i1.73
Published online Jan 27, 2018. doi: 10.4254/wjh.v10.i1.73
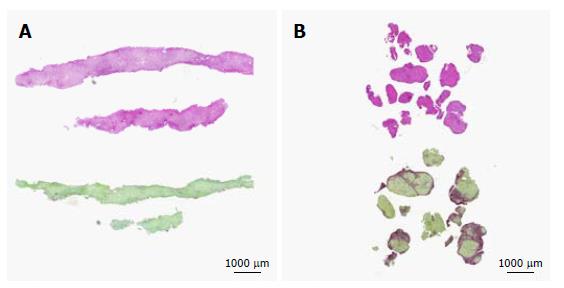
Figure 1 Variability of histological specimens in HE (top) and PicroSirius red (bottom) stained transjugular biopsy specimens.
A: Non-cirrhotic sample with 0.01% fibrosis proportion; B: Cirrhotic sample with 21% of fibrosis proportion.
Figure 2 Correlation between hepatic venous pressure gradient and fibrosis density measured by collagen proportionate area.
A: Correlation between HVPG and fibrosis density measured by CPA in the whole group of patients; B: Subgroup analysis showing a positive correlation between CPA and HVPG restricted to active alcohol drinkers. HVPG: Hepatic venous pressure gradient; CPA: Collagen proportionate area.
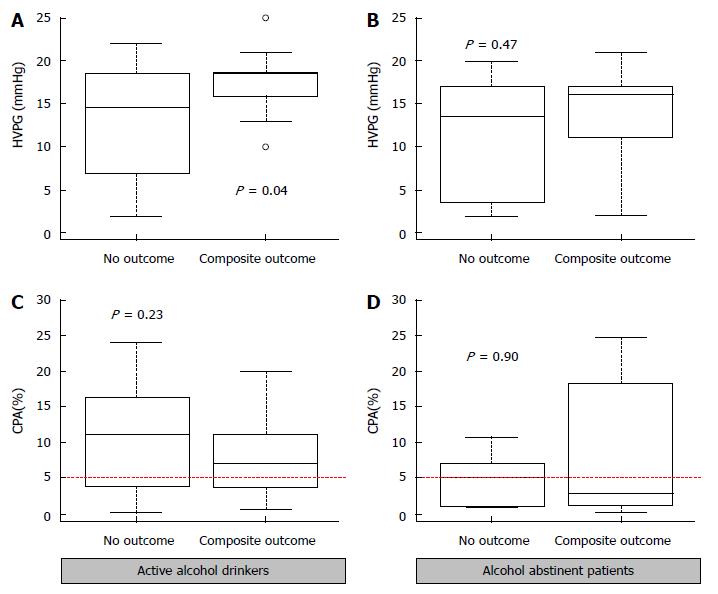
Figure 3 Relationship between hepatic venous pressure gradient (A), collagen proportionate area (B) and development of clinical complications related to portal hypertension during follow-up both in active alcohol drinkers (C) and abstinent patients (D).
- Citation: Restellini S, Goossens N, Clément S, Lanthier N, Negro F, Rubbia-Brandt L, Spahr L. Collagen proportionate area correlates to hepatic venous pressure gradient in non-abstinent cirrhotic patients with alcoholic liver disease. World J Hepatol 2018; 10(1): 73-81
- URL: https://www.wjgnet.com/1948-5182/full/v10/i1/73.htm
- DOI: https://dx.doi.org/10.4254/wjh.v10.i1.73


