Copyright
©The Author(s) 2017.
World J Stem Cells. Sep 26, 2017; 9(9): 159-168
Published online Sep 26, 2017. doi: 10.4252/wjsc.v9.i9.159
Published online Sep 26, 2017. doi: 10.4252/wjsc.v9.i9.159
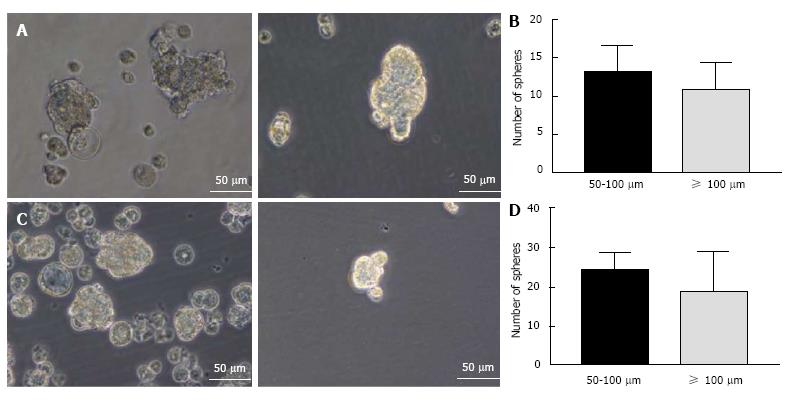
Figure 1 Enrichment of cancer stem cells using the sphere culture method.
A: Photomicrographs of Hepa 1-6 3-dimensional spheres on day 5 cultured in stem cell conditioned serum-free medium; B: Hepa 1-6 sphere sizes and numbers were enumerated; C: Photomicrographs of AML12 3-dimensional spheres on day 5; D: AML12 spheres sizes and numbers were enumerated.
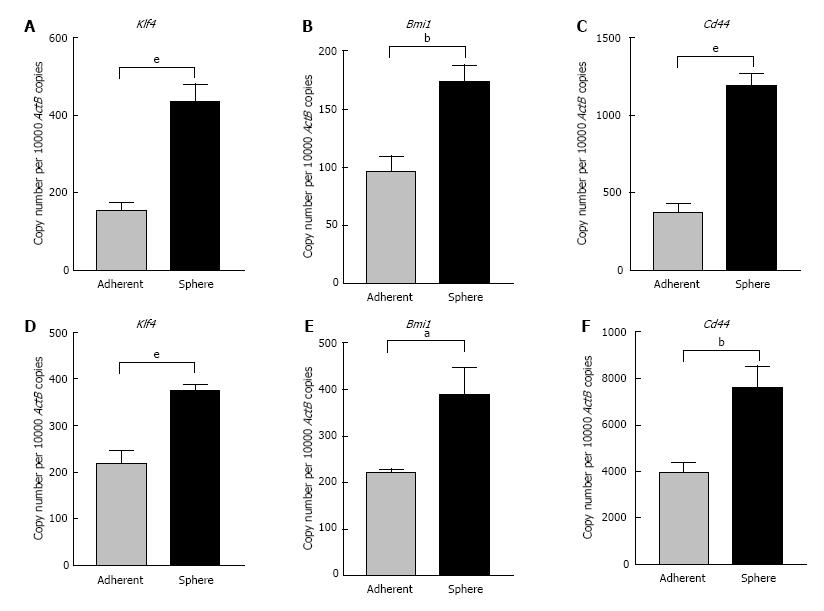
Figure 2 Three-dimensional spheres expressed high stemness and cell surface cancer stem cell markers.
qRT-PCR analysis revealed higher expression of A: Klf4, B: Bmi1 and C: Cd44 in Hepa 1-6 3-dimensional spheres compared with Hepa 1-6 grown as adherent cells. qRT-PCR analysis revealed higher expression of D: Klf4, E: Bmi1 and F: Cd44 in AML12 3-dimensional spheres compared with AML12 grown as adherent cells. Values are mean ± SEM of three experiments in triplicate (aP < 0.05, bP < 0.01, eP < 0.001). qRT-PCR: Quantitative reverse transcriptase-PCR; ActB: Beta-Actin.
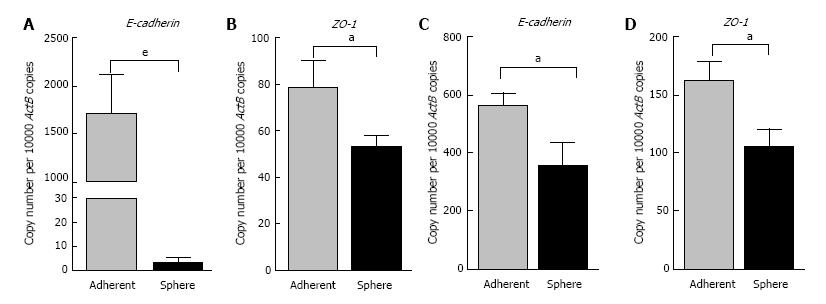
Figure 3 3-dimensional spheres decreased expression of epithelial markers.
qRT-PCR analysis revealed downregulation of A: E-cadherin and B: ZO-1 in Hepa 1-6 CSCs compared with Hepa 1-6 grown as adherent cells. qRT-PCR analysis revealed lower expression of C: E-cadherin and D: ZO-1 in AML12 CSCs compared with AML12 grown as adherent cells. Values are mean ± SEM of three experiments in triplicate (aP < 0.05). qRT-PCR: Quantitative reverse transcriptase-PCR; ActB: Beta-Actin.
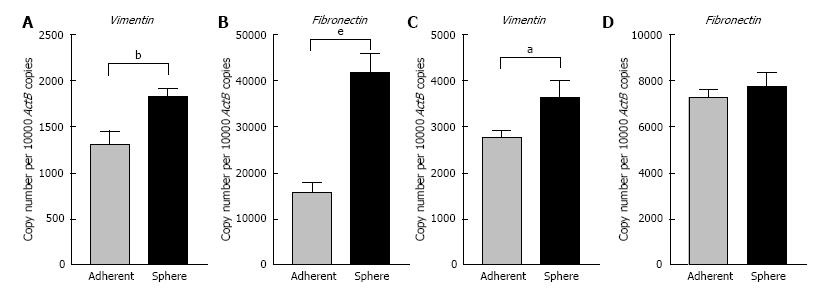
Figure 4 Three-dimensional spheres have higher expression of mesenchymal markers.
qRT-PCR analysis revealed upregulation of A: Vimentin and B: Fibronectin in Hepa 1-6 3-dimensional spheres compared with Hepa 1-6 grown as adherent cells. qRT-PCR analysis revealed higher expression of C: Vimentin and D: Fibronectin in AML12 3-dimensional spheres compared with AML12 grown as adherent cells. Values are mean ± SEM of three experiments in triplicate (aP < 0.05, bP < 0.01, eP < 0.001). qRT-PCR: Quantitative reverse transcriptase-PCR; ActB: Beta-Actin.
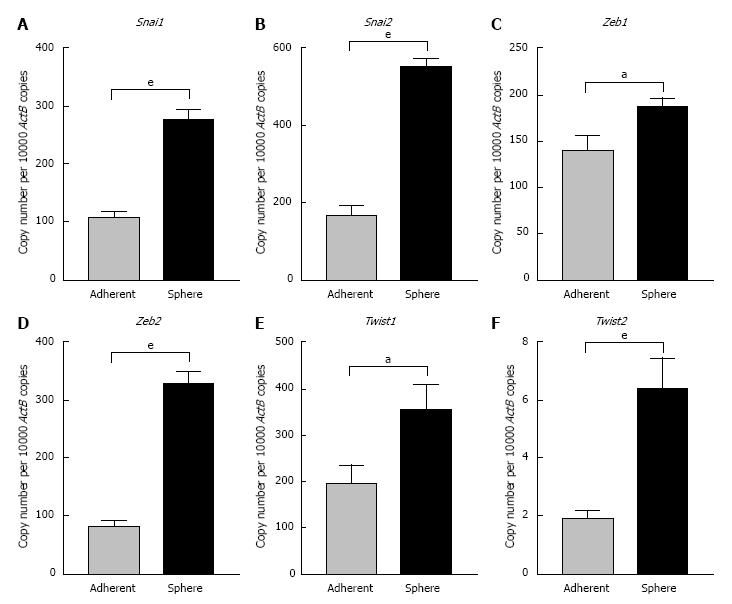
Figure 5 Expression of putative epithelial-to-mesenchymal transition transcription factors in Hepa 1-6 3-dimensional spheres.
qRT-PCR analysis revealed upregulation of A: Snai1, B: Snai2, C: Zeb1, D: Zeb2, E: Twist1, and F: Twist2 in Hepa 1-6 3-dimensional spheres compared with Hepa 1-6 grown as adherent cells. Values are mean ± SEM of three experiments in triplicate (aP < 0.05, eP < 0.001). qRT-PCR: Quantitative reverse transcriptase-PCR; ActB: Beta-Actin.
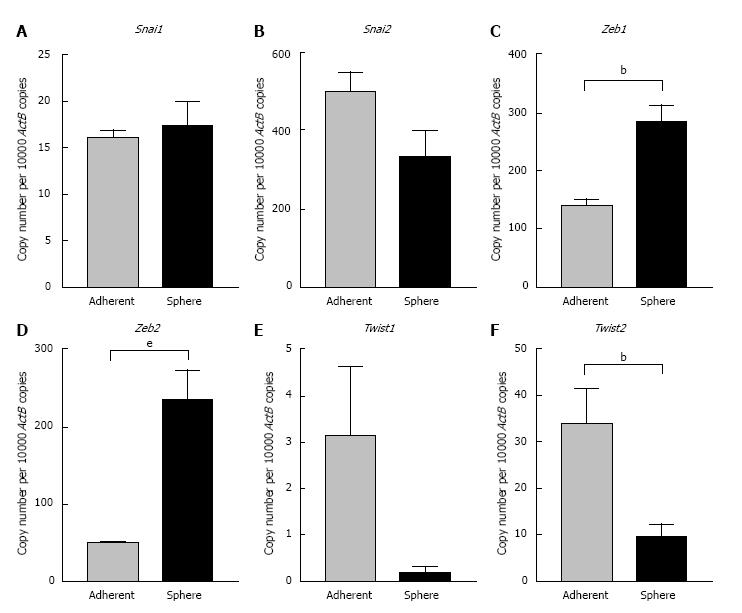
Figure 6 Expression of putative epithelial-to-mesenchymal transition transcription factors in AML12 3-dimensional spheres.
qRT-PCR analysis revealed upregulation of A: Snai1, C: Zeb1, D: Zeb2 and downregulation of B: Snai2, E: Twist1, and F: Twist2 in AML12 3-dimensional spheres compared with AML12 grown as adherent cells. Values are mean ± SEM of three experiments in triplicate (bP < 0.01). qRT-PCR: Quantitative reverse transcriptase-PCR; ActB: Beta-Actin.
- Citation: Jayachandran A, Shrestha R, Dhungel B, Huang IT, Vasconcelos MYK, Morrison BJ, Ramlogan-Steel CA, Steel JC. Murine hepatocellular carcinoma derived stem cells reveal epithelial-to-mesenchymal plasticity. World J Stem Cells 2017; 9(9): 159-168
- URL: https://www.wjgnet.com/1948-0210/full/v9/i9/159.htm
- DOI: https://dx.doi.org/10.4252/wjsc.v9.i9.159


