Copyright
©The Author(s) 2017.
World J Stem Cells. Dec 26, 2017; 9(12): 235-240
Published online Dec 26, 2017. doi: 10.4252/wjsc.v9.i12.235
Published online Dec 26, 2017. doi: 10.4252/wjsc.v9.i12.235
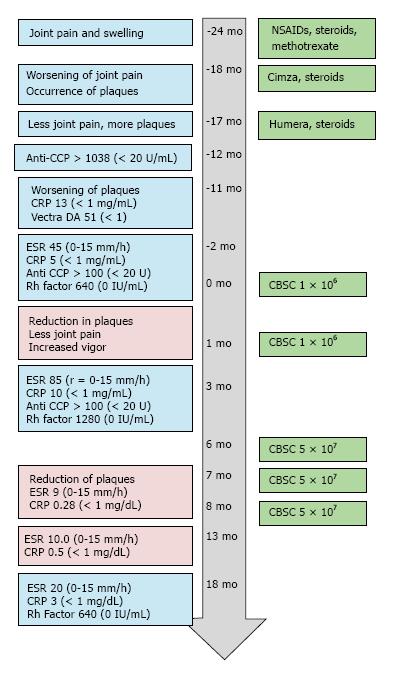
Figure 1 Time course and patient treatments.
Time course as grey arrow [in months, first cord blood stem cells (CBSC) treatment starts month 0]. Green panels on right describe drug and CBSC treatments. Panels on left describe patient symptoms and lab results. Normal adult reference values for lab results are in parenthesis. Atypical results with blue background, normal results with beige background. NSAID: Nonsteroidal anti-inflammatory drugs; CBSC: Cord blood stem cells; ESR: Erythroid sedimentation rate; CRP: C-reactive protein.
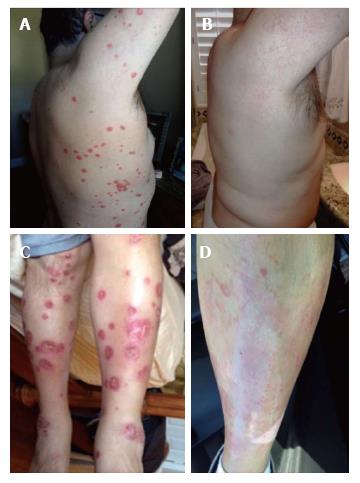
Figure 2 Images of patient trunk and legs, 11 mo prior to the first stem cell injection (A, C); Images of trunk and legs, 7 mo after the first cord blood stem cells infusion (B, D).
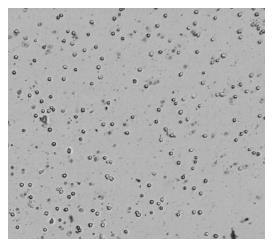
Figure 3 Umbilical cord blood stem cells, magnification approximately 150 x.
Sample image by automated cell counter, BioRad TC20.
- Citation: Coutts M, Soriano R, Naidoo R, Torfi H. Umbilical cord blood stem cell treatment for a patient with psoriatic arthritis. World J Stem Cells 2017; 9(12): 235-240
- URL: https://www.wjgnet.com/1948-0210/full/v9/i12/235.htm
- DOI: https://dx.doi.org/10.4252/wjsc.v9.i12.235


