Copyright
©The Author(s) 2017.
World J Stem Cells. Oct 26, 2017; 9(10): 179-186
Published online Oct 26, 2017. doi: 10.4252/wjsc.v9.i10.179
Published online Oct 26, 2017. doi: 10.4252/wjsc.v9.i10.179
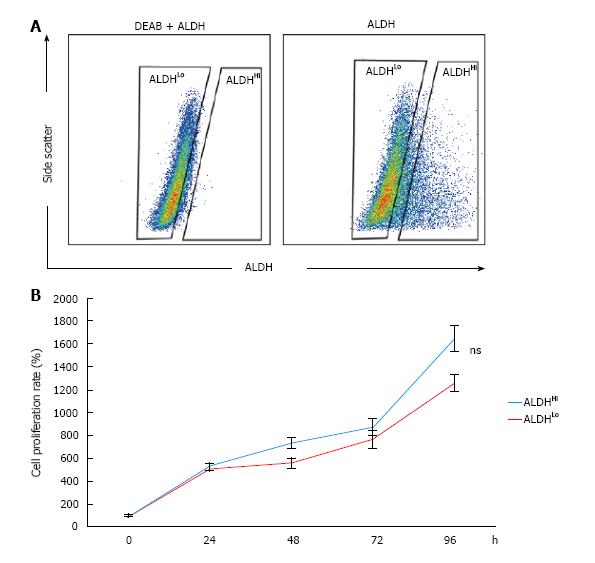
Figure 1 Detection of aldehyde dehydrogenase-positive subpopulations of murine adipose-derived stem cells and evaluation of proliferation rates.
A: Flow cytometric analysis of murine ADSCs. Baseline fluorescence was established by adding the ALDH inhibitor diethylaminobenzaldehyde; B: Cell proliferation rates were not significantly different between the ALDHHi and ALDHLo subpopulations. Values have been expressed in terms of mean ± SE (n = 5). ns: Not significant; ALDH: Aldehyde dehydrogenase; ADSCs: Adipose-derived stem cells; DEAB: Diethylaminobenzaldehyde.
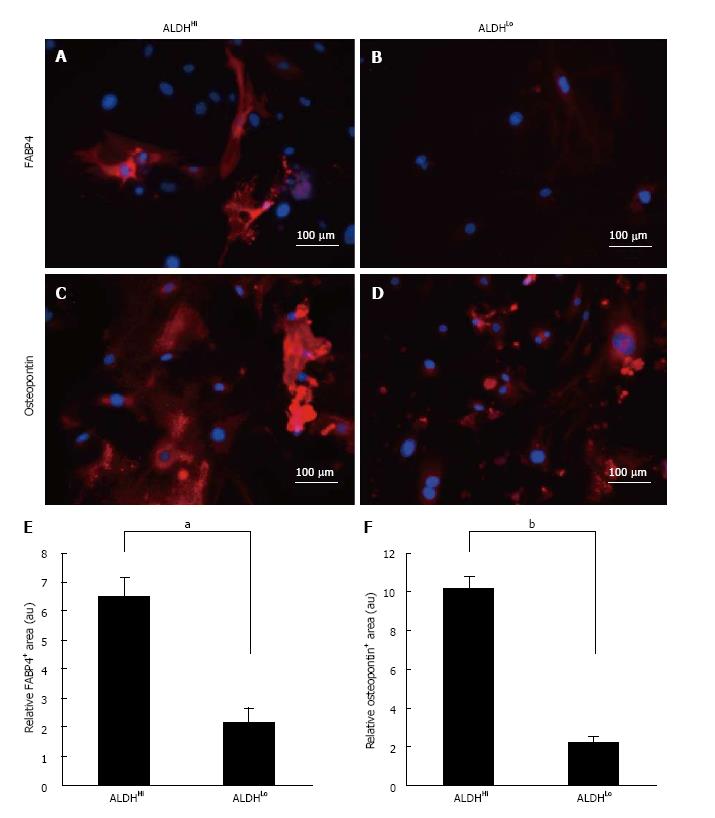
Figure 2 Marker analysis of differentiation potentials.
Differentiation potential of ALDHHi (A, C) and ALDHLo (B, D) subpopulations of ADSCs. FABP4 (A, B) and osteopontin (C, D) expression in ADSCs (red) following adipogenic (A, B) and osteogenic (C, D) differentiation of ALDHHi and ALDHLo subpopulations, as determined by immunocytochemistry. The nuclei were stained with Hoechst 33342 (blue). Quantitative analysis of differentiation-marker-positive areas in differentiated ADSCs. FABP4-positive (E) and osteopontin-positive (F) area ratios relative to respective areas of nuclear staining for ALDHHi and ALDHLo subpopulations of ADSCs after adipogenic (E) and osteogenic (F) induction. Values have been expressed in terms of mean ± SE (n = 5). aP < 0.05, bP < 0.0001, au: Arbitrary unit. ALDH: Aldehyde dehydrogenase; ADSCs: Adipose-derived stem cells; FABP: Fatty acid binding protein.
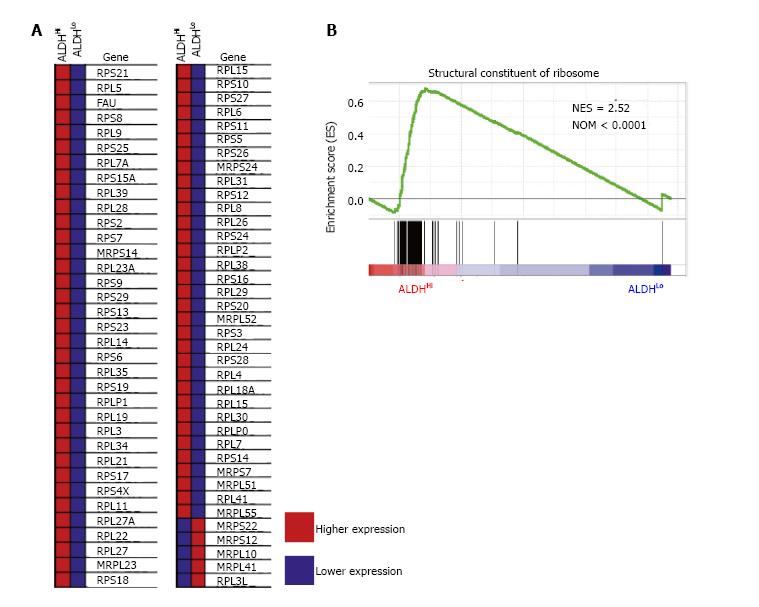
Figure 3 Gene set enrichment analysis of each ALDHHi and ALDHLo subpopulation.
A: Heat map of enrichment profile of ribosomal protein mRNAs for ALDHHi and ALDHLo subpopulations; B: Gene set enrichment analysis of transcription data related to structural constituents of ribosomes for the ALDHHi and ALDHLo subpopulations. Normalized enrichment score and nominal P values are shown. ALDH: Aldehyde dehydrogenase.
- Citation: Itoh H, Nishikawa S, Haraguchi T, Arikawa Y, Eto S, Hiyama M, Iseri T, Itoh Y, Nakaichi M, Sakai Y, Tani K, Taura Y, Itamoto K. Aldehyde dehydrogenase activity helps identify a subpopulation of murine adipose-derived stem cells with enhanced adipogenic and osteogenic differentiation potential. World J Stem Cells 2017; 9(10): 179-186
- URL: https://www.wjgnet.com/1948-0210/full/v9/i10/179.htm
- DOI: https://dx.doi.org/10.4252/wjsc.v9.i10.179


