Copyright
©The Author(s) 2015.
World J Stem Cells. Jan 26, 2015; 7(1): 223-234
Published online Jan 26, 2015. doi: 10.4252/wjsc.v7.i1.223
Published online Jan 26, 2015. doi: 10.4252/wjsc.v7.i1.223
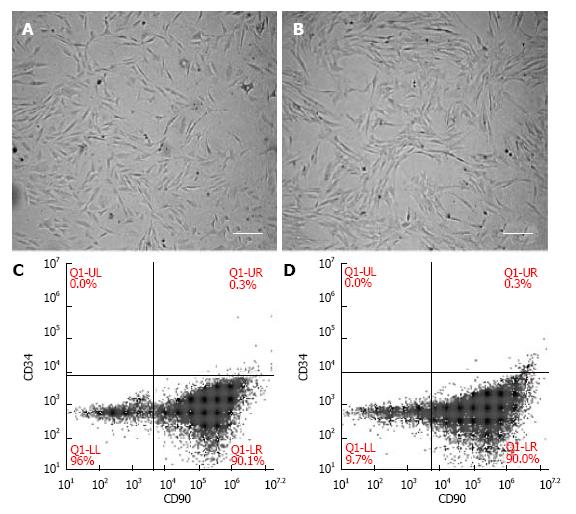
Figure 1 Morphology and immunophenotyping of fetal mesenchymal stem cells and adult mesenchymal stem cells.
(A) fMSCs and (B) aMSCs were evaluated by microscopy for homogenous elongated spindle-shaped morphology. Scale bar = 100 μm; C and D: Corresponding positive expression of CD90 and absent CD34 as measured by flow cytometry. fMSCs: Fetal mesenchymal stem cells; aMSCs: Adult mesenchymal stem cells.
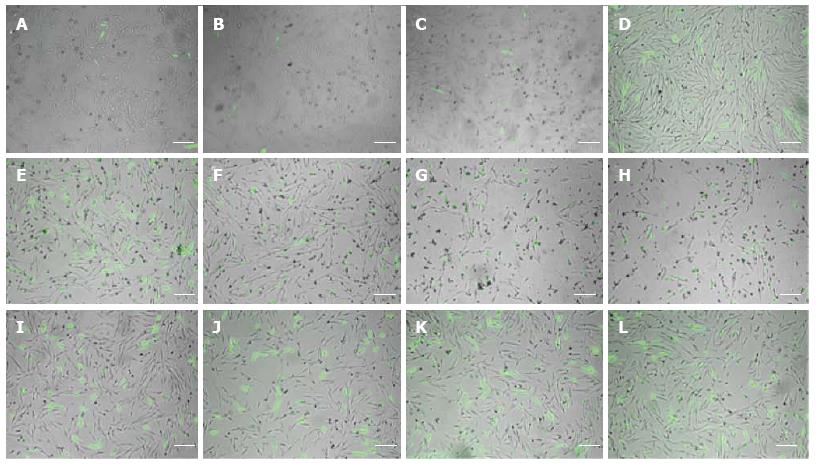
Figure 2 Chemical transfection of fetal mesenchymal stem cells.
Representative merged photomicrographs for (A-D) FuGENE 6, (E-H) Lipofectamine and (I-J) PEI mediated transfection of pcDNA3-eGFP into fMSCs at 3:1, 3:2, 6:1, and 5:2 reagent (μL): DNA (μg) ratio, respectively. In combination, qualitative transfection efficiency and viability reveal that PEI was superior at all the tested conditions. fMSCs: Fetal mesenchymal stem cells; PEI: Polyethylenimine.
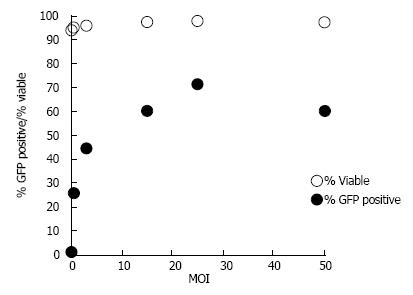
Figure 3 Optimization of E1-A-deleted-green fluorescent protein transduction and viability of fetal mesenchymal stem cells post-transduction.
Transduction efficiency and viability as a function of MOI at 48 h post-transduction with Ad-GFP. Ad-GFP: E1-A-deleted-green fluorescent protein.
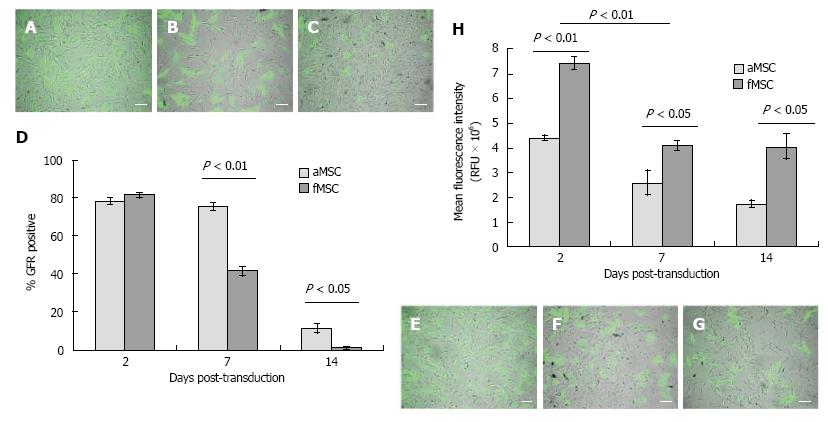
Figure 4 Percent green fluorescent protein positive MSCs and mean fluorescence intensity following E1-A-deleted-green fluorescent protein transduction.
Representative merged photomicrographs for (A-C) fMSCs and (E-G) aMSCs following Ad-GFP transduction at 2, 4, and 10 d post-transduction, respectively. Scale bar = 100 μm; (D) GFP positive cells over the period of 2 wk post-transduction and (H) mean ± SD fluorescence intensity. Ad-GFP: E1-A-deleted-green fluorescent protein; fMSCs: Fetal mesenchymal stem cells; aMSCs: Adult mesenchymal stem cells.
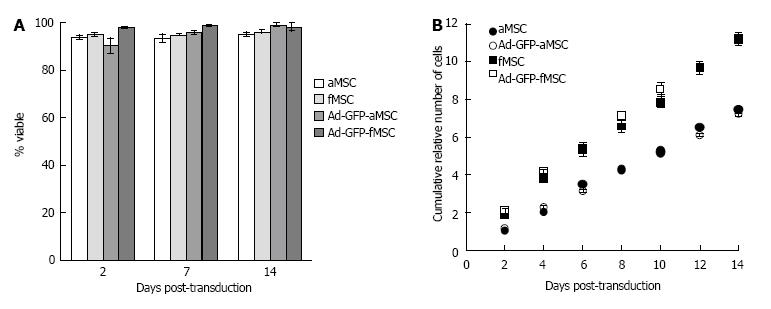
Figure 5 Mesenchymal stem cells viability and proliferation post-transduction.
A: Mean ± SD percent of viable cells as determined by 7-AAD positivity in flow cytometry at the indicated days post-transduction with Ad-GFP; B: Cumulative relative number of cells of Ad-GFP-MSCs and control MSCs. An estimated cell proliferation rate of 45 h and 29 h for aMSC or fMSCs, respectively, was determined from the slope of the curves; not significantly different between treated and control cells. Ad-GFP: E1-A-deleted-green fluorescent protein; fMSCs: Fetal mesenchymal stem cells; aMSCs: Adult mesenchymal stem cells.
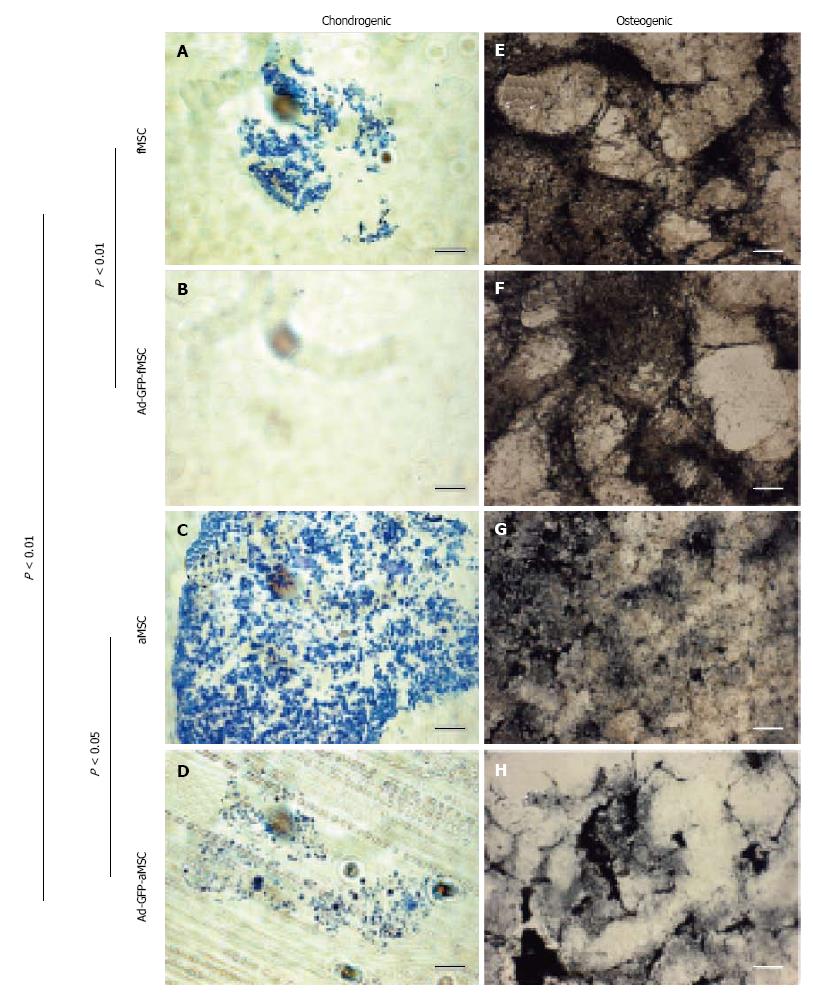
Figure 6 Chondrogenic and osteogenic differentiation of control mesenchymal stem cells and E1-A-deleted-green fluorescent protein-mesenchymal stem cells.
A-D: Chondrogenic cell pellets, differentiation induced with chondrogenic medium and TGFβ3, scale bar = 250 μm; E-H: Osteogenica differentiation induced in monolayer culture of MSCs, scale bar = 100 μm. Ad-GFP: E1-A-deleted-green fluorescent protein; fMSCs: Fetal mesenchymal stem cells; aMSCs: Adult mesenchymal stem cells.
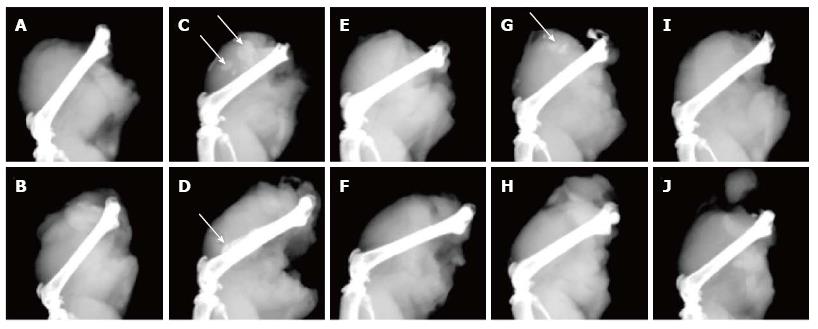
Figure 7 Osteoinduction in vivo by mesenchymal stem cell-mediated bone morphogenic protein 2 delivery.
Twelve 6-wk-old SCID mice received a 100 μL injection of 2 × 10⁶ MSCs or saline into the quadriceps muscles. Muscle samples harvested from the mice were examined by microradiography, 21 d after treatment. Treatment groups consisted of (A-B) saline control; C-D: Ad-BMP2-aMSC injection; E-F: plain aMSCs; G-H: Ad-BMP2-fMSCs; I-J: injected with plain fMSCs. The white arrows point at ossicles. The green arrow points at cortical thickening and new periosteal bone. BMP2: Bone morphogenic protein 2; Ad-GFP: E1-A-deleted-green fluorescent protein; fMSCs: Fetal mesenchymal stem cells; aMSCs: Adult mesenchymal stem cells.
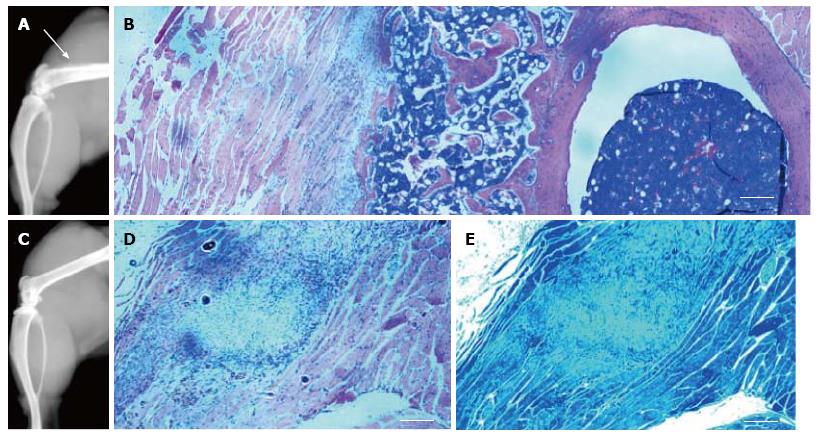
Figure 8 Histological examination of thighs after osteoinduction.
A: Arrow points at new periosteal bone and cortical thickening of Ad-BMP2-aMSC treated mouse; B: Corresponding H and E photomicrograph showing normal bone formation with new bone marrow adjacent to the periosteum; C: Radiograph of control aMSC injected mouse and corresponding; D: H and E slide; E: toluidine blue-stained slide showing a nodule of MSCs and no bone or cartilage formation. Scale bar = 100 μm. BMP2: Bone morphogenic protein 2; aMSCs: Adult mesenchymal stem cells.
-
Citation: Santiago-Torres JE, Lovasz R, Bertone AL. Fetal
vs adult mesenchymal stem cells achieve greater gene expression, but less osteoinduction. World J Stem Cells 2015; 7(1): 223-234 - URL: https://www.wjgnet.com/1948-0210/full/v7/i1/223.htm
- DOI: https://dx.doi.org/10.4252/wjsc.v7.i1.223


