Copyright
©The Author(s) 2015.
World J Stem Cells. Jan 26, 2015; 7(1): 223-234
Published online Jan 26, 2015. doi: 10.4252/wjsc.v7.i1.223
Published online Jan 26, 2015. doi: 10.4252/wjsc.v7.i1.223
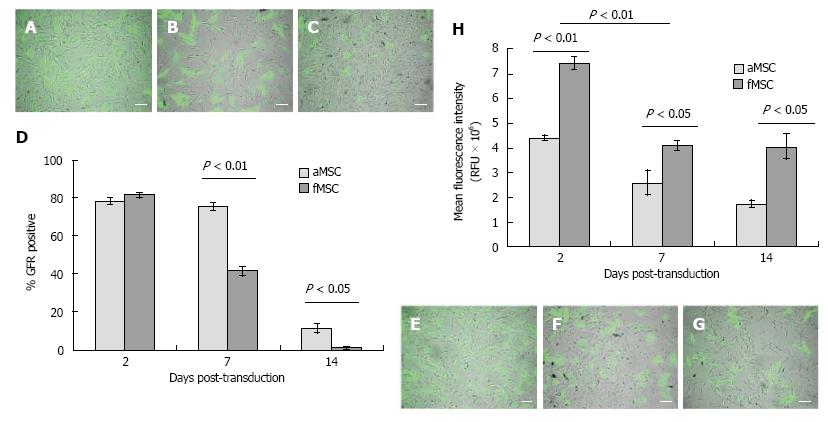
Figure 4 Percent green fluorescent protein positive MSCs and mean fluorescence intensity following E1-A-deleted-green fluorescent protein transduction.
Representative merged photomicrographs for (A-C) fMSCs and (E-G) aMSCs following Ad-GFP transduction at 2, 4, and 10 d post-transduction, respectively. Scale bar = 100 μm; (D) GFP positive cells over the period of 2 wk post-transduction and (H) mean ± SD fluorescence intensity. Ad-GFP: E1-A-deleted-green fluorescent protein; fMSCs: Fetal mesenchymal stem cells; aMSCs: Adult mesenchymal stem cells.
-
Citation: Santiago-Torres JE, Lovasz R, Bertone AL. Fetal
vs adult mesenchymal stem cells achieve greater gene expression, but less osteoinduction. World J Stem Cells 2015; 7(1): 223-234 - URL: https://www.wjgnet.com/1948-0210/full/v7/i1/223.htm
- DOI: https://dx.doi.org/10.4252/wjsc.v7.i1.223


