Copyright
©2014 Baishideng Publishing Group Inc.
World J Stem Cells. Sep 26, 2014; 6(4): 497-504
Published online Sep 26, 2014. doi: 10.4252/wjsc.v6.i4.497
Published online Sep 26, 2014. doi: 10.4252/wjsc.v6.i4.497
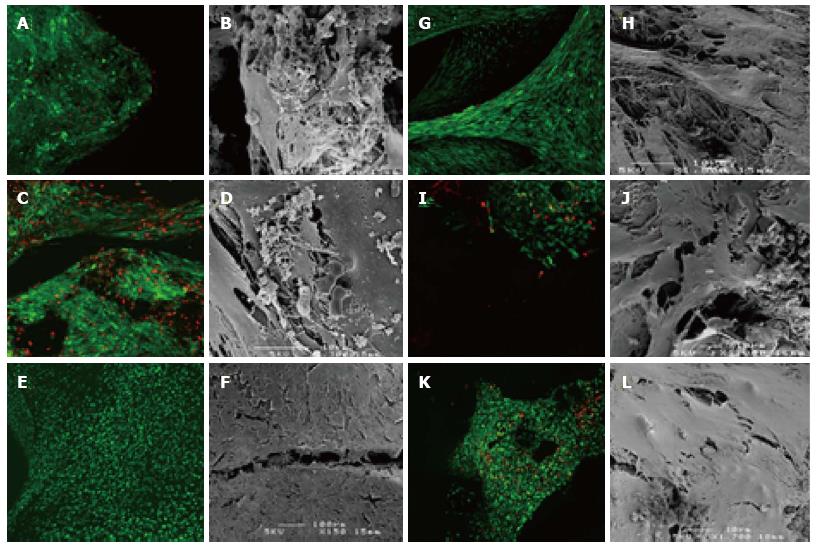
Figure 1 Live (Green)/Dead (Red) staining and scanning electron microscopy images of some bone graft substitutes (magnification is 100 unless otherwise stated).
A: Highly porous β-tricalcium phosphate (β-TCP), (Freshly Isolated group); B: Highly porous β-TCP (Freshly Isolated group); C: Highly porous β-TCP (Culture expanded group); D: Highly porous β-TCP (Culture expanded group); E: β-TCP (Freshly Isolated group); F: β-TCP (Freshly Isolated group); G: β-TCP (Culture expanded group); H: β-TCP (Culture expanded group); I: Hydroxyapatite (Freshly Isolated group) - (Magnification × 200); J: Hydroxyapatite (Freshly Isolated group); K: Hydroxyapatite (Culture expanded group); L: Hydroxyapatite (Culture expanded group).
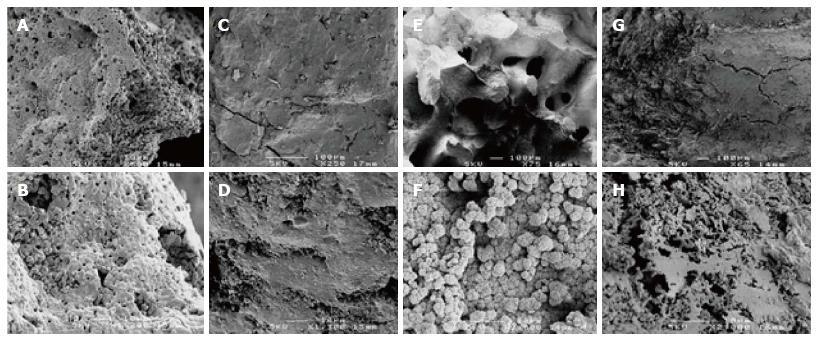
Figure 2 Scanning electron microscopy images of some bone graft substitutes in the negative control group.
A, B: Highly porous β-tricalcium phosphate (β-TCP) - (Negative control group); C, D: β-TCP (Negative control group); E, F: Hydroxyapatite (Negative control group); G, H: Calcium sulphate (Negative control group).
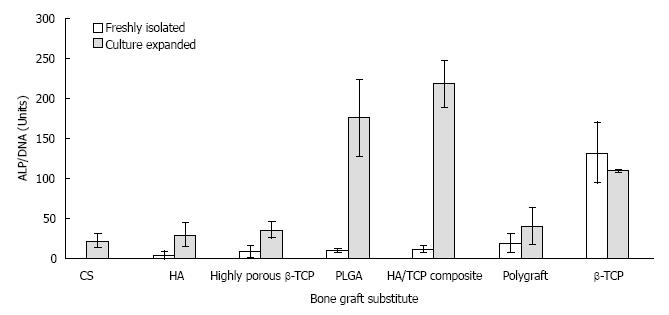
Figure 3 Normalisation of alkaline phosphatase activity to DNA content (mean ± SD).
In descending order from right to left for the freshly isolated group. β-TCP: β-tricalcium phosphate; CS: Calcium sulphate; HA: Hydroxyapatite; PLGA: Poly (Lactide-co-Glycolide); PG: Polygraft.
-
Citation: Dahabreh Z, Panteli M, Pountos I, Howard M, Campbell P, Giannoudis PV. Ability of bone graft substitutes to support the osteoprogenitor cells: An
in-vitro study. World J Stem Cells 2014; 6(4): 497-504 - URL: https://www.wjgnet.com/1948-0210/full/v6/i4/497.htm
- DOI: https://dx.doi.org/10.4252/wjsc.v6.i4.497


