Copyright
©2013 Baishideng Publishing Group Co.
World J Stem Cells. Jan 26, 2013; 5(1): 34-42
Published online Jan 26, 2013. doi: 10.4252/wjsc.v5.i1.34
Published online Jan 26, 2013. doi: 10.4252/wjsc.v5.i1.34
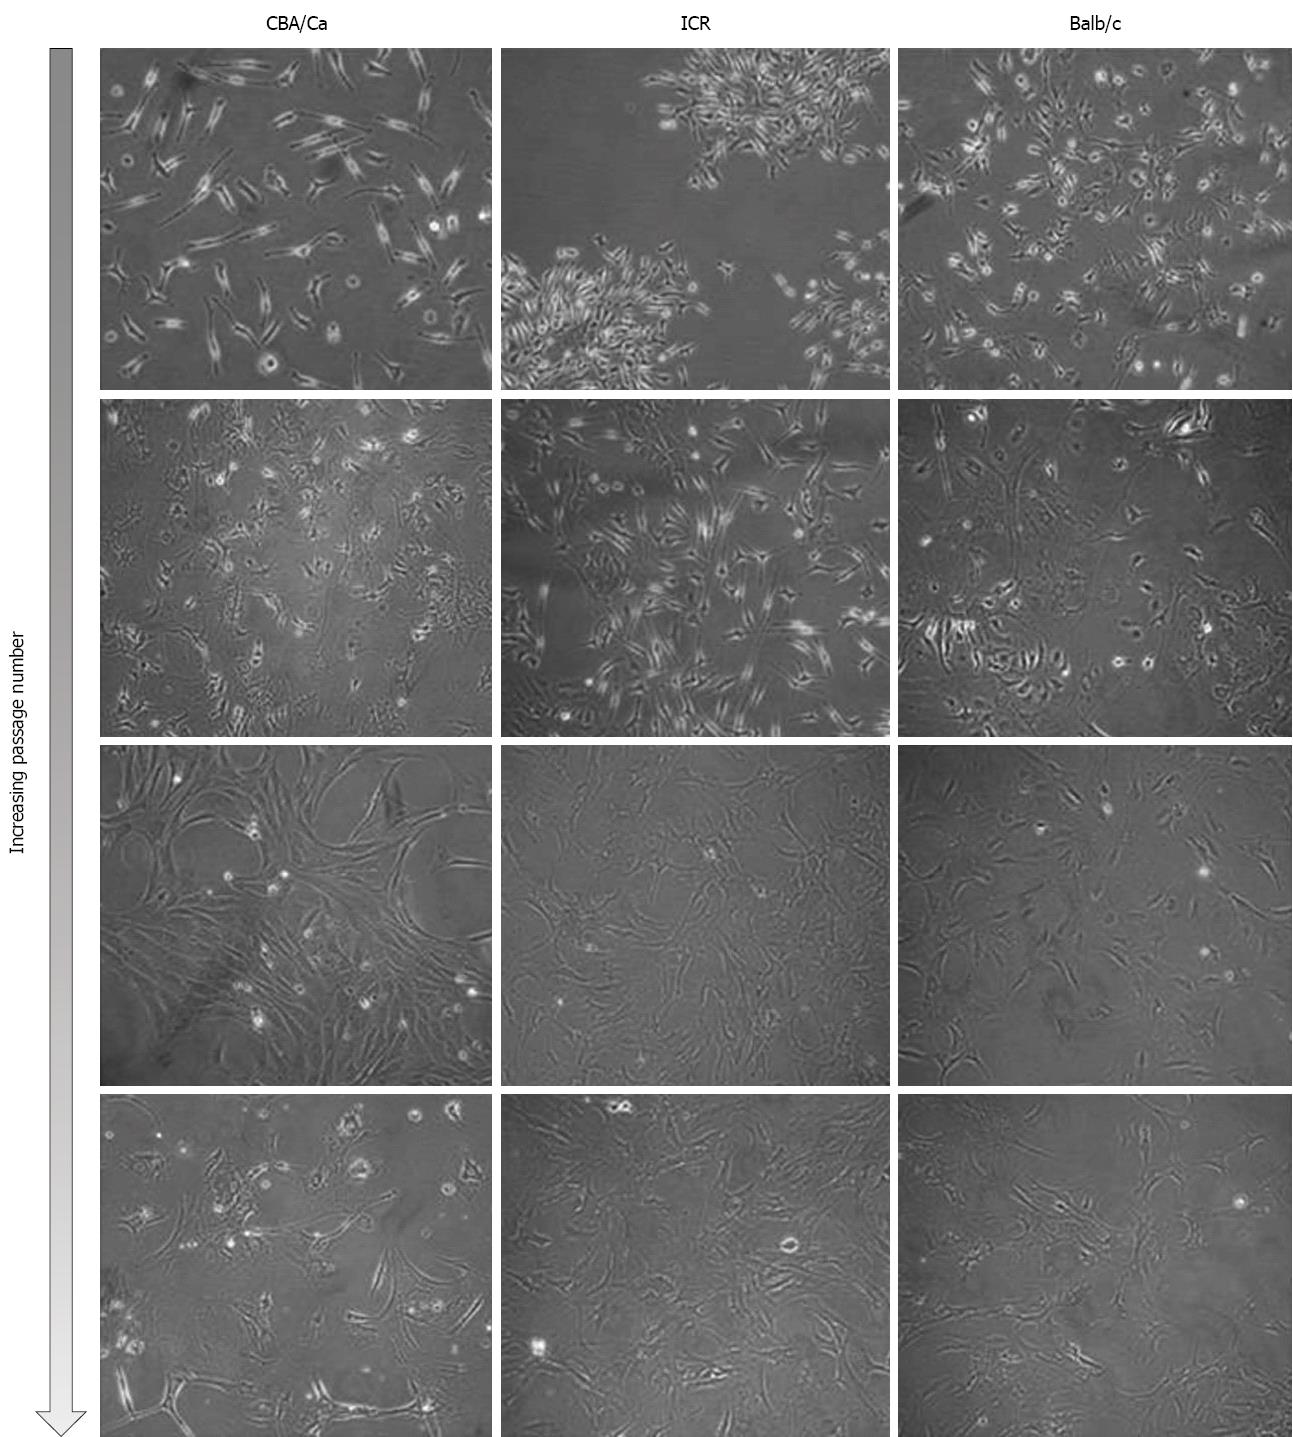
Figure 1 Morphology of mouse bone marrow cultures.
Cells shown here represent passages 0-19 of bone marrow cells from CBA/Ca, ICR and Balb/c mice. Original magnification: × 200.
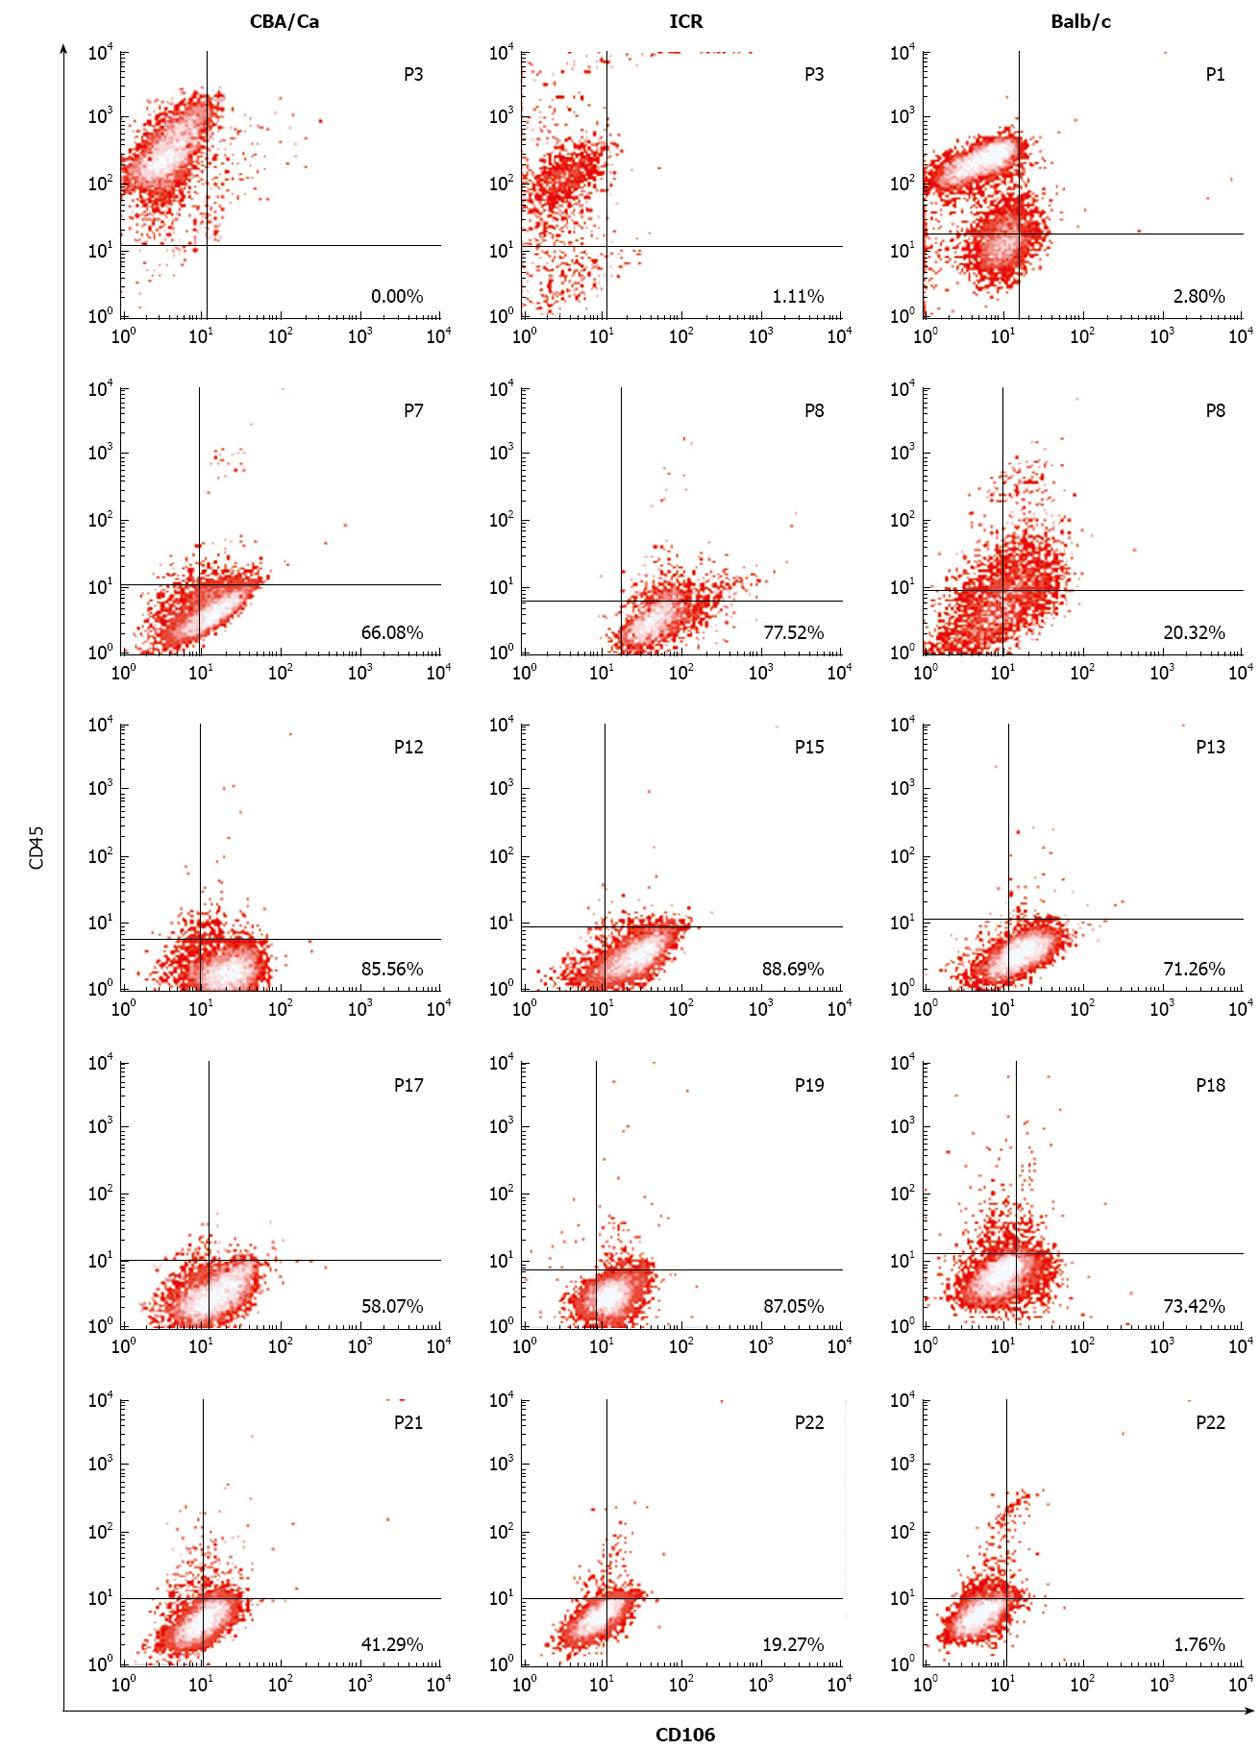
Figure 2 Bone marrow cultures acquire CD106+CD45- immunophenotype at later passages.
Bottom right quadrants show percentage of CD106+CD45- cells for mesenchymal stem cells of CBA/Ca, ICR and Balb/c mice. Numbers in the upper right region indicate passage number.
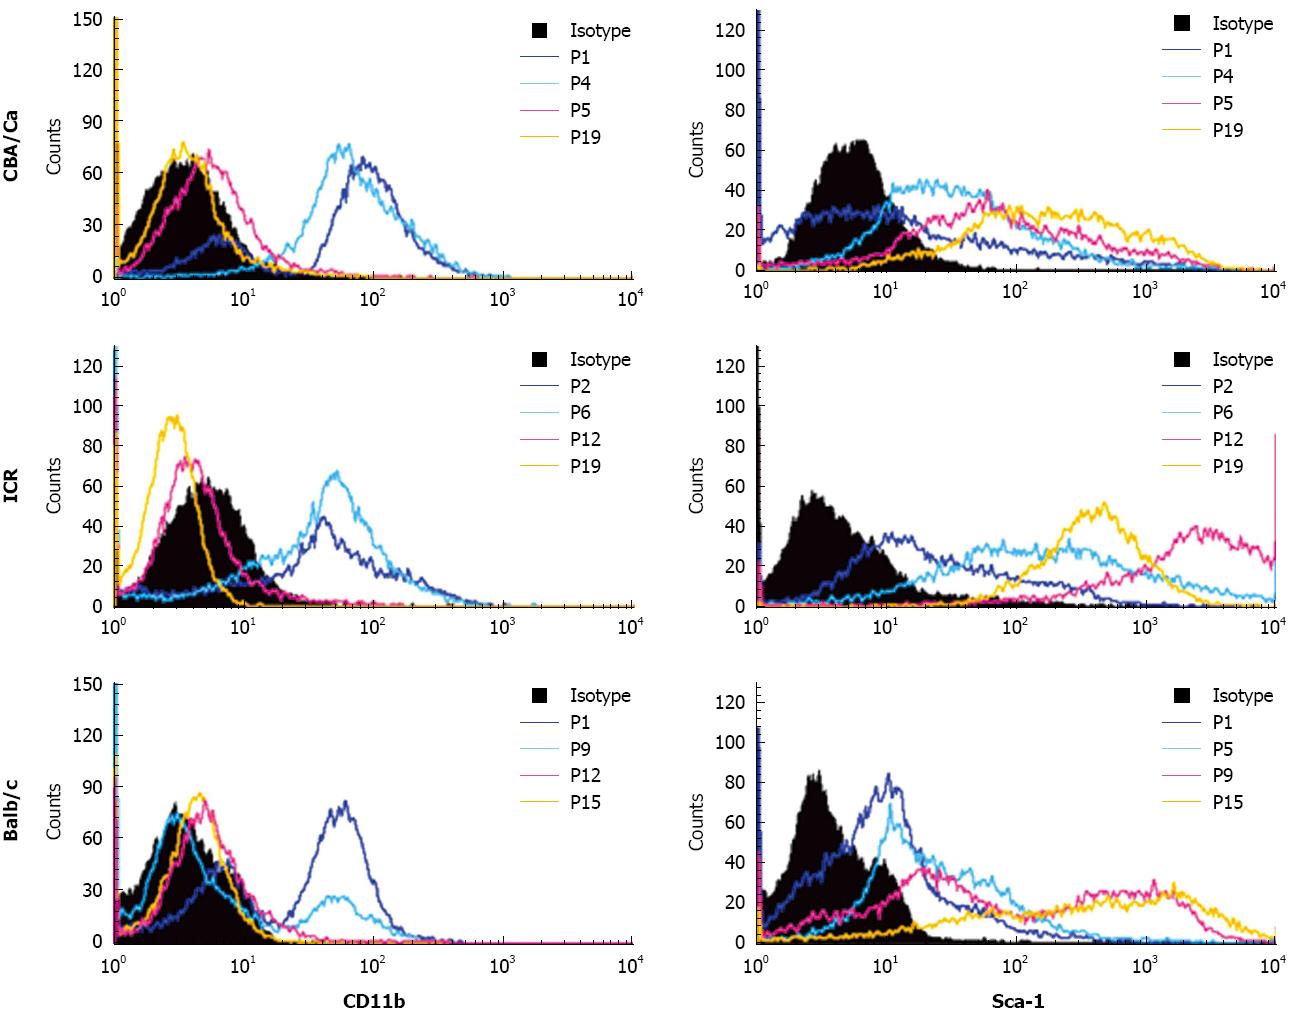
Figure 3 Bone marrow cultures show decreased CD11b and increased Sca-1 expression at later passages.
Histograms show the shift of CD11b+ at earlier passages to CD11b- at later passages for each strain of mice. Expression of Sca-1 is increased with mesenchymal stem cells passages.
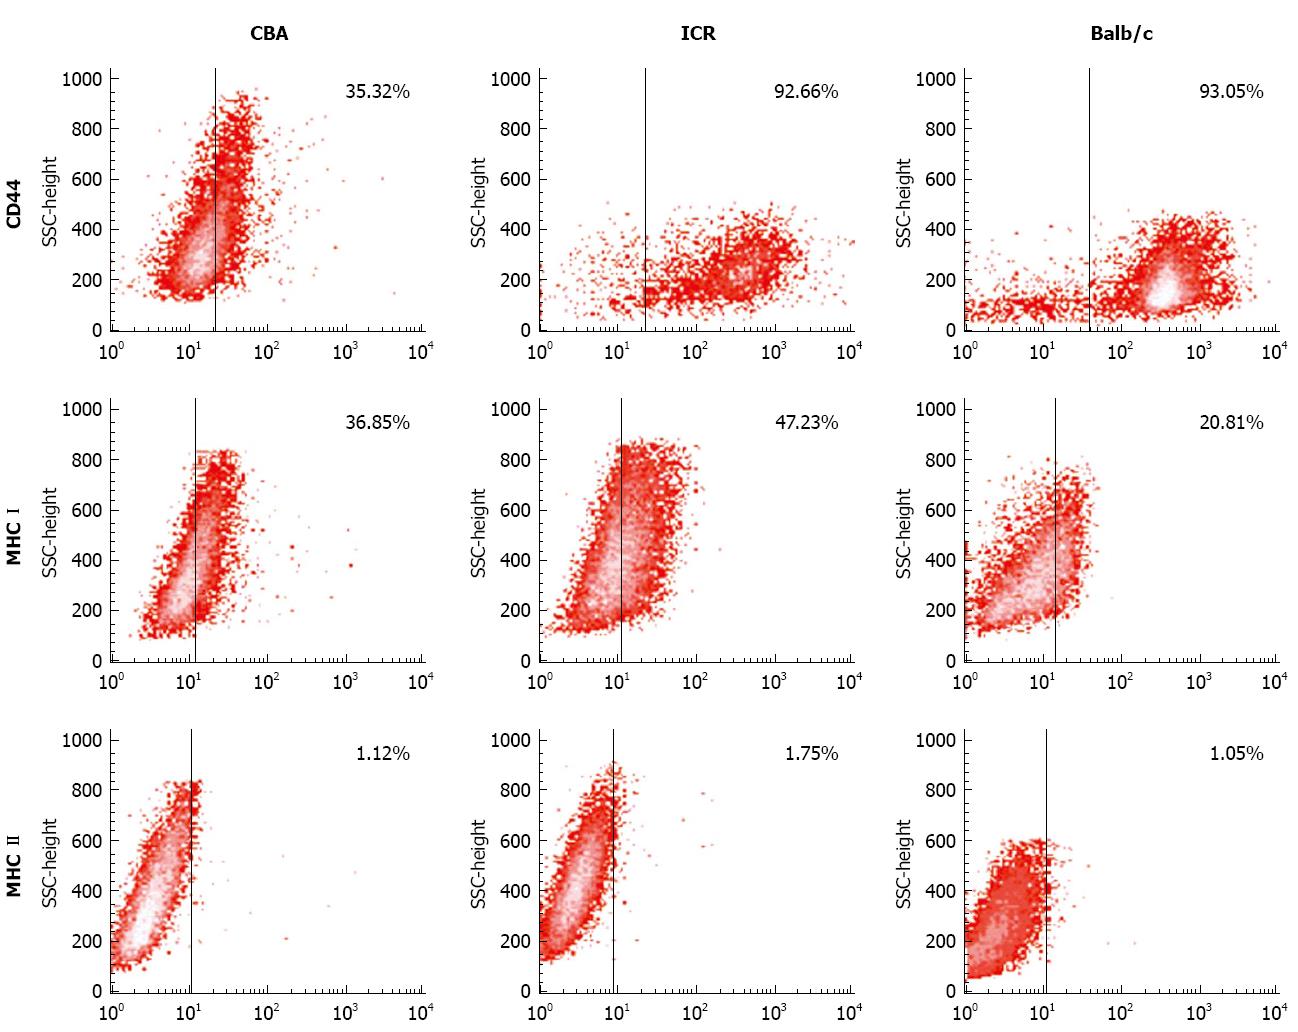
Figure 4 Mesenchymal stem cells cultures from all 3 strains of mice show positivity to CD44 and MHC I but negativity to MHC II.
Numbers within plots indicate the percentage of positivity to each marker.
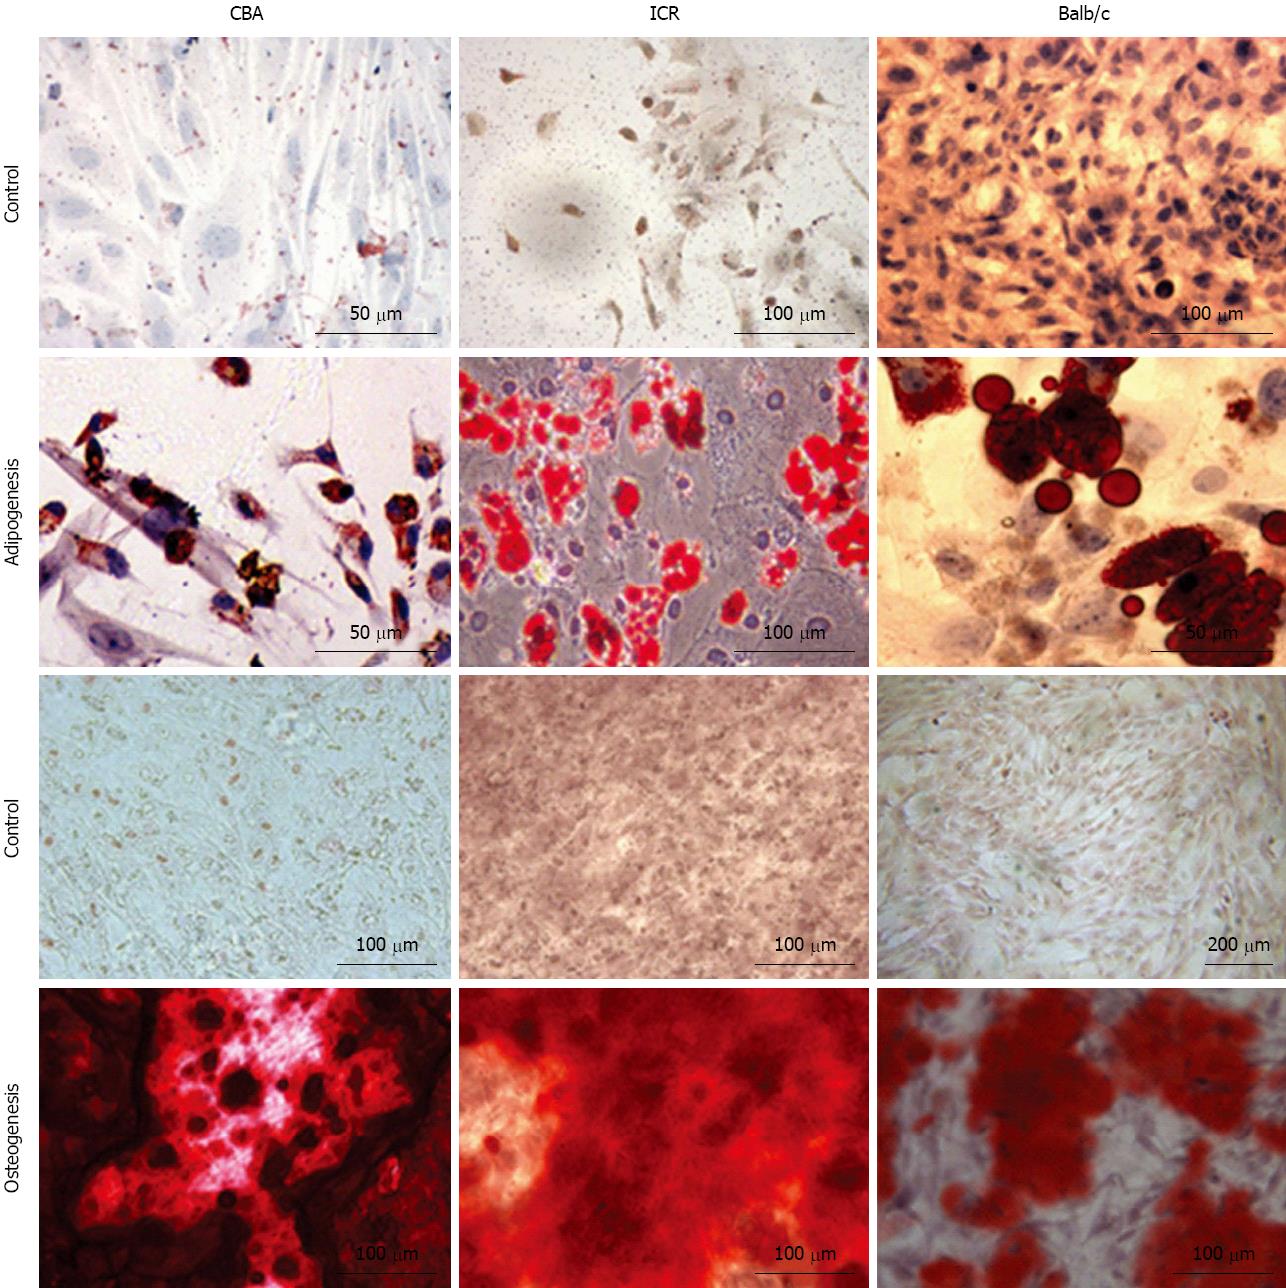
Figure 5 Mesenchymal stem cells from all 3 strains of mice differentiate into adipocytes and osteocytes.
First and second row: images of non-induced mesenchymal stem cells (MSC) control and MSC differentiated into adipocytes, stained with Oil Red O. Third and fourth row: images of non-induced MSC control and MSC differentiated into osteocytes, stained with Alizarin Red S. Differences in quality of images are because they were taken using different camera/microscope systems.
- Citation: Ooi YY, Rahmat Z, Jose S, Ramasamy R, Vidyadaran S. Immunophenotype and differentiation capacity of bone marrow-derived mesenchymal stem cells from CBA/Ca, ICR and Balb/c mice. World J Stem Cells 2013; 5(1): 34-42
- URL: https://www.wjgnet.com/1948-0210/full/v5/i1/34.htm
- DOI: https://dx.doi.org/10.4252/wjsc.v5.i1.34


